Reagents
RPMI-1640 media (abs9468) was purchased from univ bio-technology CO., Ltd (Shanghai, China) and fetal bovine serum (FBS, 10099-141) was purchased from Gibco (Grand Island, NY, USA). Complete Freund’s adjuvant (7027) and incomplete Freund’s Adjuvant (7002) was purchased from Chondrex (Chondrex Inc, WA, USA). Amitriptyline hydrochloride (AMI, HY-B0527A) was purchased from MedChemExpress (Monmouth Junction, NJ, USA). Plastic feeding tubes (TFEP-001, 2.25 × 50 mm) were purchased from Shanghai Yuyan Instruments Company (Shanghai, China). The RNeasy® Mini kit (74,104) was purchased from Qiagen (Hilden, Germany). The anti-GAPDH antibody (EPR16891, ab181602), anti-Acid sphingomyelinase antibody (ab83354), acidic Sphingomyelinase Assay Kit (Fluorometric) (ab190554), and human Acid sphingomyelinase ELISA Kit (SMPD1) (ab277075) were purchased from Abcam (Cambridge, UK). ChamQ SYBR qPCR Master Mix (Q311-02) and HiScript® III RT SuperMix for qPCR (+ gDNA wiper, R323-01) were purchased from Vazyme (Nanjing, China). The anti-STAT3 antibody (AF6294), anti-STAT3 (phospho Y705) antibody (AF3293), and enhanced chemiluminescence kit (KF005) were purchased from Affinity Biosciences (Cincinnati, OH, USA). The Immobilon®-P transfer membrane, 0.45 μm (IPVH00010), was purchased from Merck Millipore (Billerica, MA, USA). The anti-STAT5 Antibody (381,427) and phospho-STAT5 (Tyr694, 381,125 ) were bought from ZEN BIO (Shanghai, China). Mouse IL-6 ELISA kit (MM-1011M1), mouse IL-10 ELISA kit (MM-0176M1), mouse IL-17 A ELISA kit (MM-0759M1), mouse ASM ELISA kit (MM-46150M1) were bought from Meimian (Jiangsu, China). Cell lysis buffer (P0013) and the BCA protein quantitation assay (P0010) were purchased from Beyotime (Shanghai, China). The protease inhibitor cocktail (GK10014), phosphatase inhibitor cocktail I (GK10011), phosphatase inhibitor cocktail II (GK10012), and bordetella pertussis toxin (GC17532) were purchased from Glpbio (Montclair, CA, USA). PBS (1×, G4202) and environmentally friendly GD fixing solution (G1111-100mL) were purchased from Servicebio (Wuhan, China). Foxp3 / Transcription Factor Staining Buffer Set (00-5523-00), ic fixation buffer (00-822-49), fixable Viability Dye 780 APC-cy7 (50-169-66), and permeabilization Buffer (00-8333-56) were bought from ThermoFisher Scientific (Waltham, MA, USA). EasySep™ Mouse Naïve CD4 + T Cell Isolation Kit (19,765) were bought from Stemcell Technologies (Canada). Mouse Th17 Cell Differentiation Kit (CDK017) was bought from R&D Systems (minneapolis, minnesota, USA). Anti-Mouse CD3 BV510 (740,147), anti-Mouse CD25 BB515 (564,424), anti-Mouse FOXP3 APC (560,401), and GolgiStop™ Protein Transport Inhibitor (554,724) were bought from BD Biosciences (New Jersey, USA). Anti-Mouse CD4 Percp-cy5.5 (E-AB-F1097J) and anti-Mouse IL-17 A PE (E-AB-F1199D) were bought from Elabscience (Wuhan, China). Plant hemagglutinin (48–68) (115721-95-4) was bought from AbMole (Chicago, USA). Grip Strength Meter (yls-13 A) was bought from Jinan Yiyan Technology Development Co., LTD (Jinan, China).
Study population
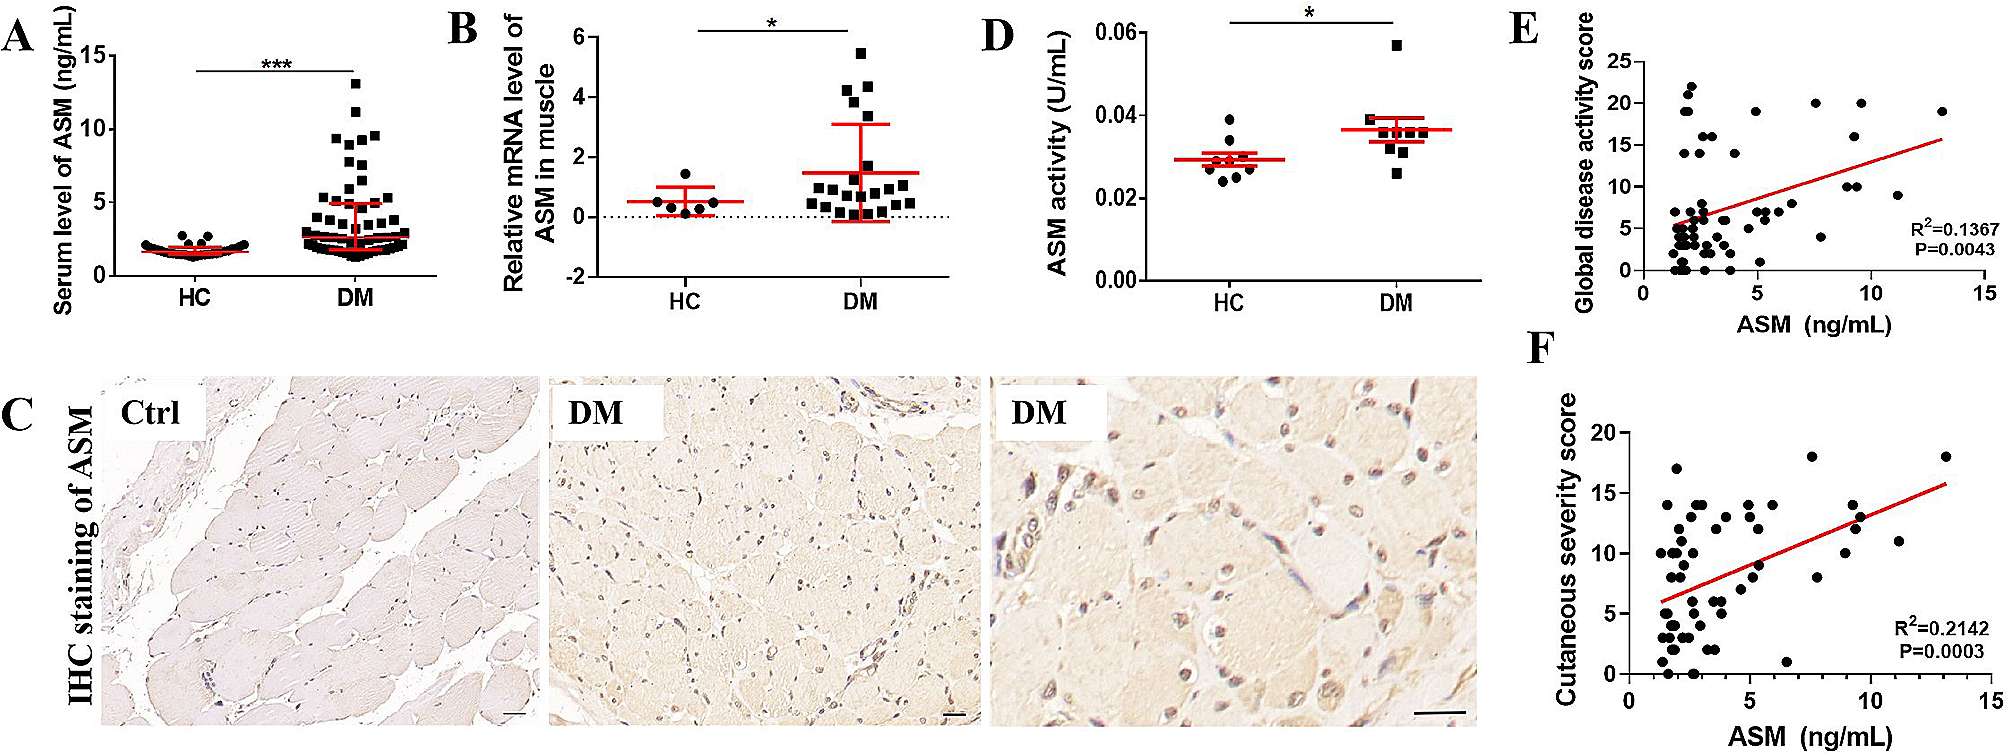
Patients who met the EULAR/ACR criteria for the diagnosis of DM [21] Were recruited tetween December 2019 and November 2020 at the Department of Rheumatology, West China Hospital of Sichuan University. The exclusion criteria were as follows: other lung diseases such as idiopathic pulmonary fibrosis, pulmonary sarcoidosis, pulmonary infection, and chronic obstructive pulmonary disease; autoimmune diseases other than DM; malignant diseases; pregnancy; and overall poor health. A total of 58 DM patients and 30 healthy controls (HCs) matched for age and gender were included. The detailed information regarding the enrolled DM patients and HCs is provided in Table 1. This study was conducted in compliance with the Declaration of Helsinki and approved by the ethics committee of West China Hospital (No. 246 in 2019). Written informed consent was obtained from all participants, and all methods followed relevant guidelines and regulations.
Table 1 Characteristics of included patientsMyositis disease activity assessment
During the clinical evaluation, two experienced rheumatologists collected data on the patients’ medical history and conducted physical examinations. The myositis disease activity assessment tool [22] was used to measure disease activity, specifically utilizing the myositis intention to treat activity index (MITAX). The global disease activity score derived from MITAX is computed by summing as the total of the worst category scores for each of the seven individual organ systems (constitutional, cutaneous, skeletal, gastrointestinal, pulmonary, cardiac, and muscle). This score is divided by the maximum possible score, which ranges from 1 to 63. Each organ system is categorized into five categories: A (active), B (beware), C (contentment), D (discount), and E (no evidence). These categories correspond to values of 9, 3, 1, 0 (indicating no current activity but previously active), and 0 (indicating no current or previous activity), respectively. Therefore, a higher score indicates increased disease activity. The physician assessed disease activity at the time of enrollment.
Cutaneous damage assessment
The cutaneous assessment tool-binary method (CAT-BM) [23] was utilized to assess cutaneous damage with disease activity evaluate based on 7 indicators: Gottron papule, Heliotrope rash, erythema on the zygomatic or facial regions, linear erythema on the limbs’ extension side, V-zone erythema on the front of the neck, erythema on the back of the neck and shoulder (known as the Shawl sign), and erythema on non-exposed areas. Disease activity scores ranged from 0 to 17 while lesion severity was scored on a 0–11 scale, accounting for atrophy or pigmentation at the lesion site. The total score, ranging from 0 to 28, was calculated by combining the disease activity and lesion severity scores.
Detection of serum ASM levels
Each patient and HC provided a 4mL venous blood sample, which was collected into a coagulating agent-containing blood collection tube. The samples were then allowed to clot at room temperature for about 2 h. After clot formation, the samples were centrifuged at 2000 g for 10 min. Subsequently, the sera were collected and stored at a temperature of − 80° C. Human ASM ELISA kit was utilized to assess serum ASM levels following the kit’s provided specifications.
Mice
Female and male C57BL/6J-smpd1 heterozygous mice, aged four to six weeks, were obtained from Cyagen Bioscience (Guangzhou, China) and were then bred to generate SMPD1−/− mice. Wild-type C57BL/6 female mice, aged seven weeks, were obtained from the Beijing Huafukang Biotechnology Company (Beijing, China). The mice were randomly housed in cages with five mice per cage at the Animal Facility of Chengdu Frontier Medical Center, West China Hospital, Sichuan University, under pathogen-free conditions. They were provided with adequate food and water and allowed to acclimate for one week before any experiments were conducted. The mice were maintained on a 12-hour light and 12-hour dark cycle at a consistent temperature ranging from 22 to 24 ◦C. Seven-week-old female wild-type guinea-pigs were purchased from Byrness Weil Biotech Ltd. (Chongqing, China). All animal experiments performed in this study were approved by the Animal Ethics Committee of West China Hospital, Sichuan University (approval number: 2,020,243 A).
Genotyping strategy
Genotyping of SMPD1−/− mice was conducted following protocols provided by Cyagen Bioscience. In brief, tails from 3-week-old mice were digested in a buffer composed of 50 mM KCl, 10 mM Tris-HCl (pH 9.0), 0.1% Triton X-100, and 0.4 mg/mL Proteinase K. Then, the genomic DNA were amplified with the following components: 7.9 µL of double-distilled water, 0.8 µL of forward primer, 0.8 µL of reverse primer, 10 µL of 2 ×Mouse Direct PCR Mix and 0.5 µL of DNA. This amplification process involved 35 cycles. The PCR conditions consisted of denaturation at 94 ◦C for 5 min, annealing at 58 ◦C for 30 s, extension at 72 ◦C for 30 s per kilobase pair, and an additional extension at 72 ◦C for 7 min. Then, PCR products were visualized by agarose gel electrophoresis. The primer sequences employed are listed below: PCR primer set 1, F1: 5′ -GCA AAG TCT TAT TCA CTG CTC T-3′, R1:5′ -AGA GAT GTT CCA AGT CGA AAA GAT-3′, product size: 641 bp; PCR primer set 2, F1: 5′ -TAA AGT TAG GGA GAG TAA AGT CAG C-3′, R2: 5′ -CCA TCT ATT TGG TAA ACT CGG TAG-3′, product size: 550 bp.
EAM mouse model
After a week of housing and acclimatization at the animal facility, mice were randomly assigned to each group using a random number table, with six mice in each group, to establish the EAM model. The model was induced by 1.5 mg of myosin extracted from wild-type guinea pigs, along with complete Freund’s adjuvant containing 10 mg/ml of Mycobacterium tuberculosis. This method was based on previously published protocols [24]. Drugs were administered daily through oral gavage two days prior to model establishment and continued until the end of the experiment. The model group received a drug dilution buffer composed of water, ethanol, and 2% acetic acid in a ratio of 8:3:1 by volume, with less than 5% of DMSO included. The drug groups were administrated the same concentrations of DMSO and dilution buffer, along with varying concentrations of the tested drugs (AMI 1 mg/kg or 10 mg/kg).
At the conclusion of the study, mice were subjected to muscle strength testing using a mouse grip tester (YLS-13 A, Jinan Yiyan Technology Development Co., LTD, China). The test was repeated three times, and the average values were recorded. Subsequently, the mice were sacrificed and blood samples were collected to obtain sera. The spleens were weighed and used for flow cytometry analysis to detect the CD4 T cell subsets Th17 and Treg. Moreover, samples of the gastrocnemius muscle were collected and either preserved as fresh specimens in liquid nitrogen or fixed in the GD fixing solution for pathological analysis.
Detection of serum CK
Mouse serum samples were sent to Wuhan Servicebio Technology Co., Ltd (Wuhan, China) for the detection of serum CK levels. The analysis was performed using an automatic biochemistry analyzer (Chemray 800) manufactured by Rayto Life and Analytical Sciences Co., Ltd ( Shenzhen, China ).
Flow cytometry
To detect the percentages of CD4 T subsets in spleens, we utilized the following fluorescent-labeled antibodies: APC-Cy7-FVS780 (1:2000) for cell death, Anti-Mouse CD3 BV510 (1:50), Anti-Mouse CD4 Percp-cy5.5 (1:50), Anti-Mouse CD25 BB515 (1:50), Anti-Mouse IL-17 A PE (1:50), and Anti-Mouse FOXP3 APC (1:50) for Th17 or Tregs. The stained samples were analyzed using a flow cytometer (Cytoflex, Beckmam, USA).
Muscle homogenate
To prepare the muscle homogenates, the muscle was removed from liquid nitrogen and placed on ice for thawing. The muscle tissues were then fragmented into small sections and transferred to tissue grinding tubes, each containing 1 large steel ball (4 mm in diameter) and 2 small steel balls (3 mm in diameter) for grinding. Samples were obtained by adding PBS with a protease inhibitor (at a ratio of 1:100) to the tubes With each tube having 9 µL of PBS per 1 mg of tissue. The low temperature grinder (KZ-III-FP, Servicebio) was pre-chilled before use. The muscle pieces were ground for 10 s at of 70 Hz with three cycles of grinding at -10 °C and a 20 s pause between each cycle. After grinding, the samples were stored at -20 °C overnight, then thawed twice in liquid nitrogen and centrifuged at 5000 g for 10 min at 4 °C. The resulting supernatants were collected and the protein concentrations were determined using a BCA protein concentration assay kit.
H&E staining
Muscle tissues were fixed in an environmentally friendly solution, GD fixing solution, for 24 h. Subsequently, the tissues underwent paraffin embedding and sectioning to produce 5 μm sections. The hematoxylin and eosin (H&E) staining procedure was conducted following the manufacturer’s instructions. Neutral gum was applied to seal the slides which were subsequently stored at room temperature. An automated quantitative pathology imaging system was employed to scan the stained sections (Vectra Polaris, United States).
Quantitative analysis of H&E staining
Pathological qualitative scores were assessed based on the infiltration of inflammatory cells in the H&E stained sections of mouse muscles [25]. The scoring system ranged from 0 to 4.5, with scores of 1 indicating less than 5 muscle fibers affected, scores of 2 indicating 5 to 30 muscle fibers involved, scores of 3 indicating the involvement of a muscle bundle, and scores of 4 representing diffused widespread lesions. Additionally, a score of 0.5 was added when multiple lesions were found in a muscle segment.
IHC staining
To analyze the levels of crucial proteins, we employed immunohistochemical (IHC) staining.The process began with dewaxing the slides using xylene followed by hydration with gradient alcohol. Subsequently, antigen retrieval was performed, along with blocking of endogenous peroxidase and non-specific binding sites. The target protein was then detected using a primary antibody (diluted at 1:100) and the slides were left to incubate overnight at 4 ℃. The next day, thorough washing of the slides was carried out, followed by the addition of a secondary antibody labeled with horse radish peroxidase (diluted at 1:500) and an hour-long incubation at room temperature. A 3,3’-diaminobenzidine (DAB) kit was used to develop a brown color,, cell nuclei were counterstained, and the slides were sealed. Finally, an automatic quantitative pathology imaging system was employed to automatically scan the slides (Vectra Polaris, USA).
ELISA
Enzyme-linked immunosorbent assay (ELISA) kits were employed according to the manufacturer’s instructions to measure the levels of ASM, IL-6, IL-10, and IL-17 A in the sera or tissue homogenates of mice. The optical density at 450 nm was measured using a microplate reader (CLARIOstar, BMG LABTECH, Germany), and protein concentrations were determined via a standard curve.
qRT-PCR
To analyze relative target gene expressions, the method of quantitative reverse transcriptase polymerase chain reaction (qRT-PCR) was employed. The expressions of target genes were normalized with the internal reference GAPDH. The collection of RNAs from either cells or tissues was carried out following the instructions of the RNA extraction kit. The extracted RNA was then reverse transcribed into complementary DNA (cDNA), which served as the template for synthesizing the target gene using the specific primers. The quantification of gene expression levels was determined using the formula 2−ΔΔCq. The following set of primers was utilized for the experiment: GAPDH primers for human (hGAPDH): F 5′-3′: CAC ATG GCC TCC AAG GAG TAA, R 5′-3′: TGA GGG TCT CTC TCT TCC TCT TGT; hASM: F 5′-3′: CTG TCT GAC TCT CGG GTT CTC, R 5′-3′: CTA TGC GAT GTA ACC TGGCAG; GAPDH primers for mouse (mGAPDH): F 5′-3′: AGG TCG GTG TGA ACG GAT TTG, 5′-3′ R: GGG GTC GTT GAT GGC AAC A; mIL-6: F 5′-3′: TTC CAT CCA GTT GCC TTC TTG, R 5′-3′: AGG TCT GTT GGG AGT GGT ATC; mIL-10: F 5′-3′: CTT ACT GAC TGG CAT GAG GAT CA, R 5′-3′: GCA GCT CTA GGA GCA TGT GG; mIL-17: 5′-3′ F: TCA GCG TGT CCA AAC ACT GAG, 5′-3′ R: CGC CAA GGG AGT TAA AGA CTT; mFOXP3: 5′-3′ F: AGT GGC AGG GAA GGA GTG TCA G, 5′-3′ R: AGG CTG GAT AAC GGC AGA GGA G; mRORγT: 5′-3′ F: AAG GTG GTA CTG GGT ATG GC, 5′-3′ R: CTC TTG GGC CTT GCA GTC TT; mASM: 5′-3′ F: ACT CCA CGG TTC TTT GGG TTC, 5′-3′ R: CGG CGC TAT GGC ACT GAA T.
Western blotting
Jurkat T cells were cultivated in RPMI-1640 medium supplemented with 10% fetal bovine serum and 1% penicillin-streptomycin, incubated at 37 ℃ with 5% CO2. Cell passages were performed if the density exceeded 1.0 × 10⁶ cells per milliliter. For key proteins analysis in the cell signaling pathway, Jurkat T cells were seeded in 6-well plates at a density of 5 × 10⁴ cells per milliliter. AMI at 1µM or 10 µM was added, followed by overnight incubation. The next day, cells were stimulated with plant hemagglutinin at 5 µg/mL for 30 min before proteins extraction.
Protein expression levels were detected using Western blotting (WB). Protein extraction was carried out from stimulated cells or protein supernatants from muscle homogenates. Following determination of the protein concentrations, denaturation was achieved by adding loading buffer and heating at 95 °C for 10 min. Subsequently, 20 µg of proteins were loaded onto a gel for separation via gel electrophoresis. Protein transfer onto a nitrocellulose membrane was employed using a wet transfer system. The membrane was then blocked at room temperature for 30 min using 5% (w/v) non-fat milk in 1×Tris Buffered Saline containing 1‰ Tween 20 (TBST). Primary antibody was added to the membrane and left overnight at 4 °C. After three washes with TBST, the membrane was exposed to the secondary antibody for 1 h at ambient temperature. Following additional washes, the bands on the membrane were visualized by gel scanner (ChemiDoc XRS, BIO-RAD, USA) with an enhanced chemiluminescent substrate.
Spleen naïve CD4 + T cell differentiation
The differentiation of naïve CD4 + T cells from the spleen into T cell subsets was conducted using established methodologies [26, 27]. For Th17 differentiation, a 24-well plate was coated with 1 mL of PBS containing anti-CD3 (2 µg/mL) and anti-CD28 (1 µg/mL) and incubated overnight at 4 °C. The following day, spleens from 8-week-old WT C57BL/6 mice were harvested. Spleen cells were isolated by grinding the spleen on a 70-µm mesh and collected in PBS supplemented with 1% FBS. The collected cells were centrifuged at 1000 rpm for 5 min, repeated twice, and red blood cells were lysed with ACK lysing buffer for 5 min on ice. The CD4 + T cells were then isolated using a CD4 + T cell isolation kit following the manufacturer’s instructions. The coating buffer was removed, and the plate was washed with PBS before seeding the CD4 + T cells in the Th17 differentiation buffer. Additionally, AMI (1µM) or AMI (10µM) was added. After four days, the cells were haevested for flow cytometry analysis. To assess differentiation, 1 µL of Golgi stop buffer was added to each well and incubated for 4 h. Subsequently, the cells were stained. Cell death was assessed using APC-Cy7-FVS780 (1:2000), and Th17 cells were stained with Anti-Mouse CD3 BV510 (1:50), Anti-Mouse CD4 Percp-cy5.5 (1:50), and Anti-Mouse IL-17 A PE (1:50). Data acquisition was performed using a flow cytometry instrument (Cytoflex, Beckmam, USA).
Statistical analysis
The data analysis software SPSS version 22.0 (SPSS, Inc., Chicago, IL, USA) or GraphPad Prism version 6.0 (GraphPad, Inc., La Jolla, CA, USA) was utilized for organizing all data. The normal distribution of continuous variables was assessed using the Kolmogorov-Smirnov test. Data were presented as either the mean ± standard deviation (SD), median (quartile), or number (percentage). The Mann-Whitney U-test was employed to compare differencies between the two groups of continuous variables with non-normal distribution. The t-test was utilized to compare two means, while one-way ANOVA was employed for comparisons among more than two means. Bonferroni corrections were applied for pairwise comparisons among multiple groups. Spearman’s correlation coefficient (r) was employed to analyze the relationships between serum ASM levels and myositis disease activity, activity and damage of cutaneous manifestations, muscle enzymes including CK, LDH, HBDH, AST, and other clinical indicators. Statistical significance was set at a p value of less than 0.05. Any result with a p value less than 0.05 was considered statistically significant, denoted by asterisks(* < 0.05, ** < 0.01, *** < 0.001, **** < 0.0001).


留言 (0)