
記住我


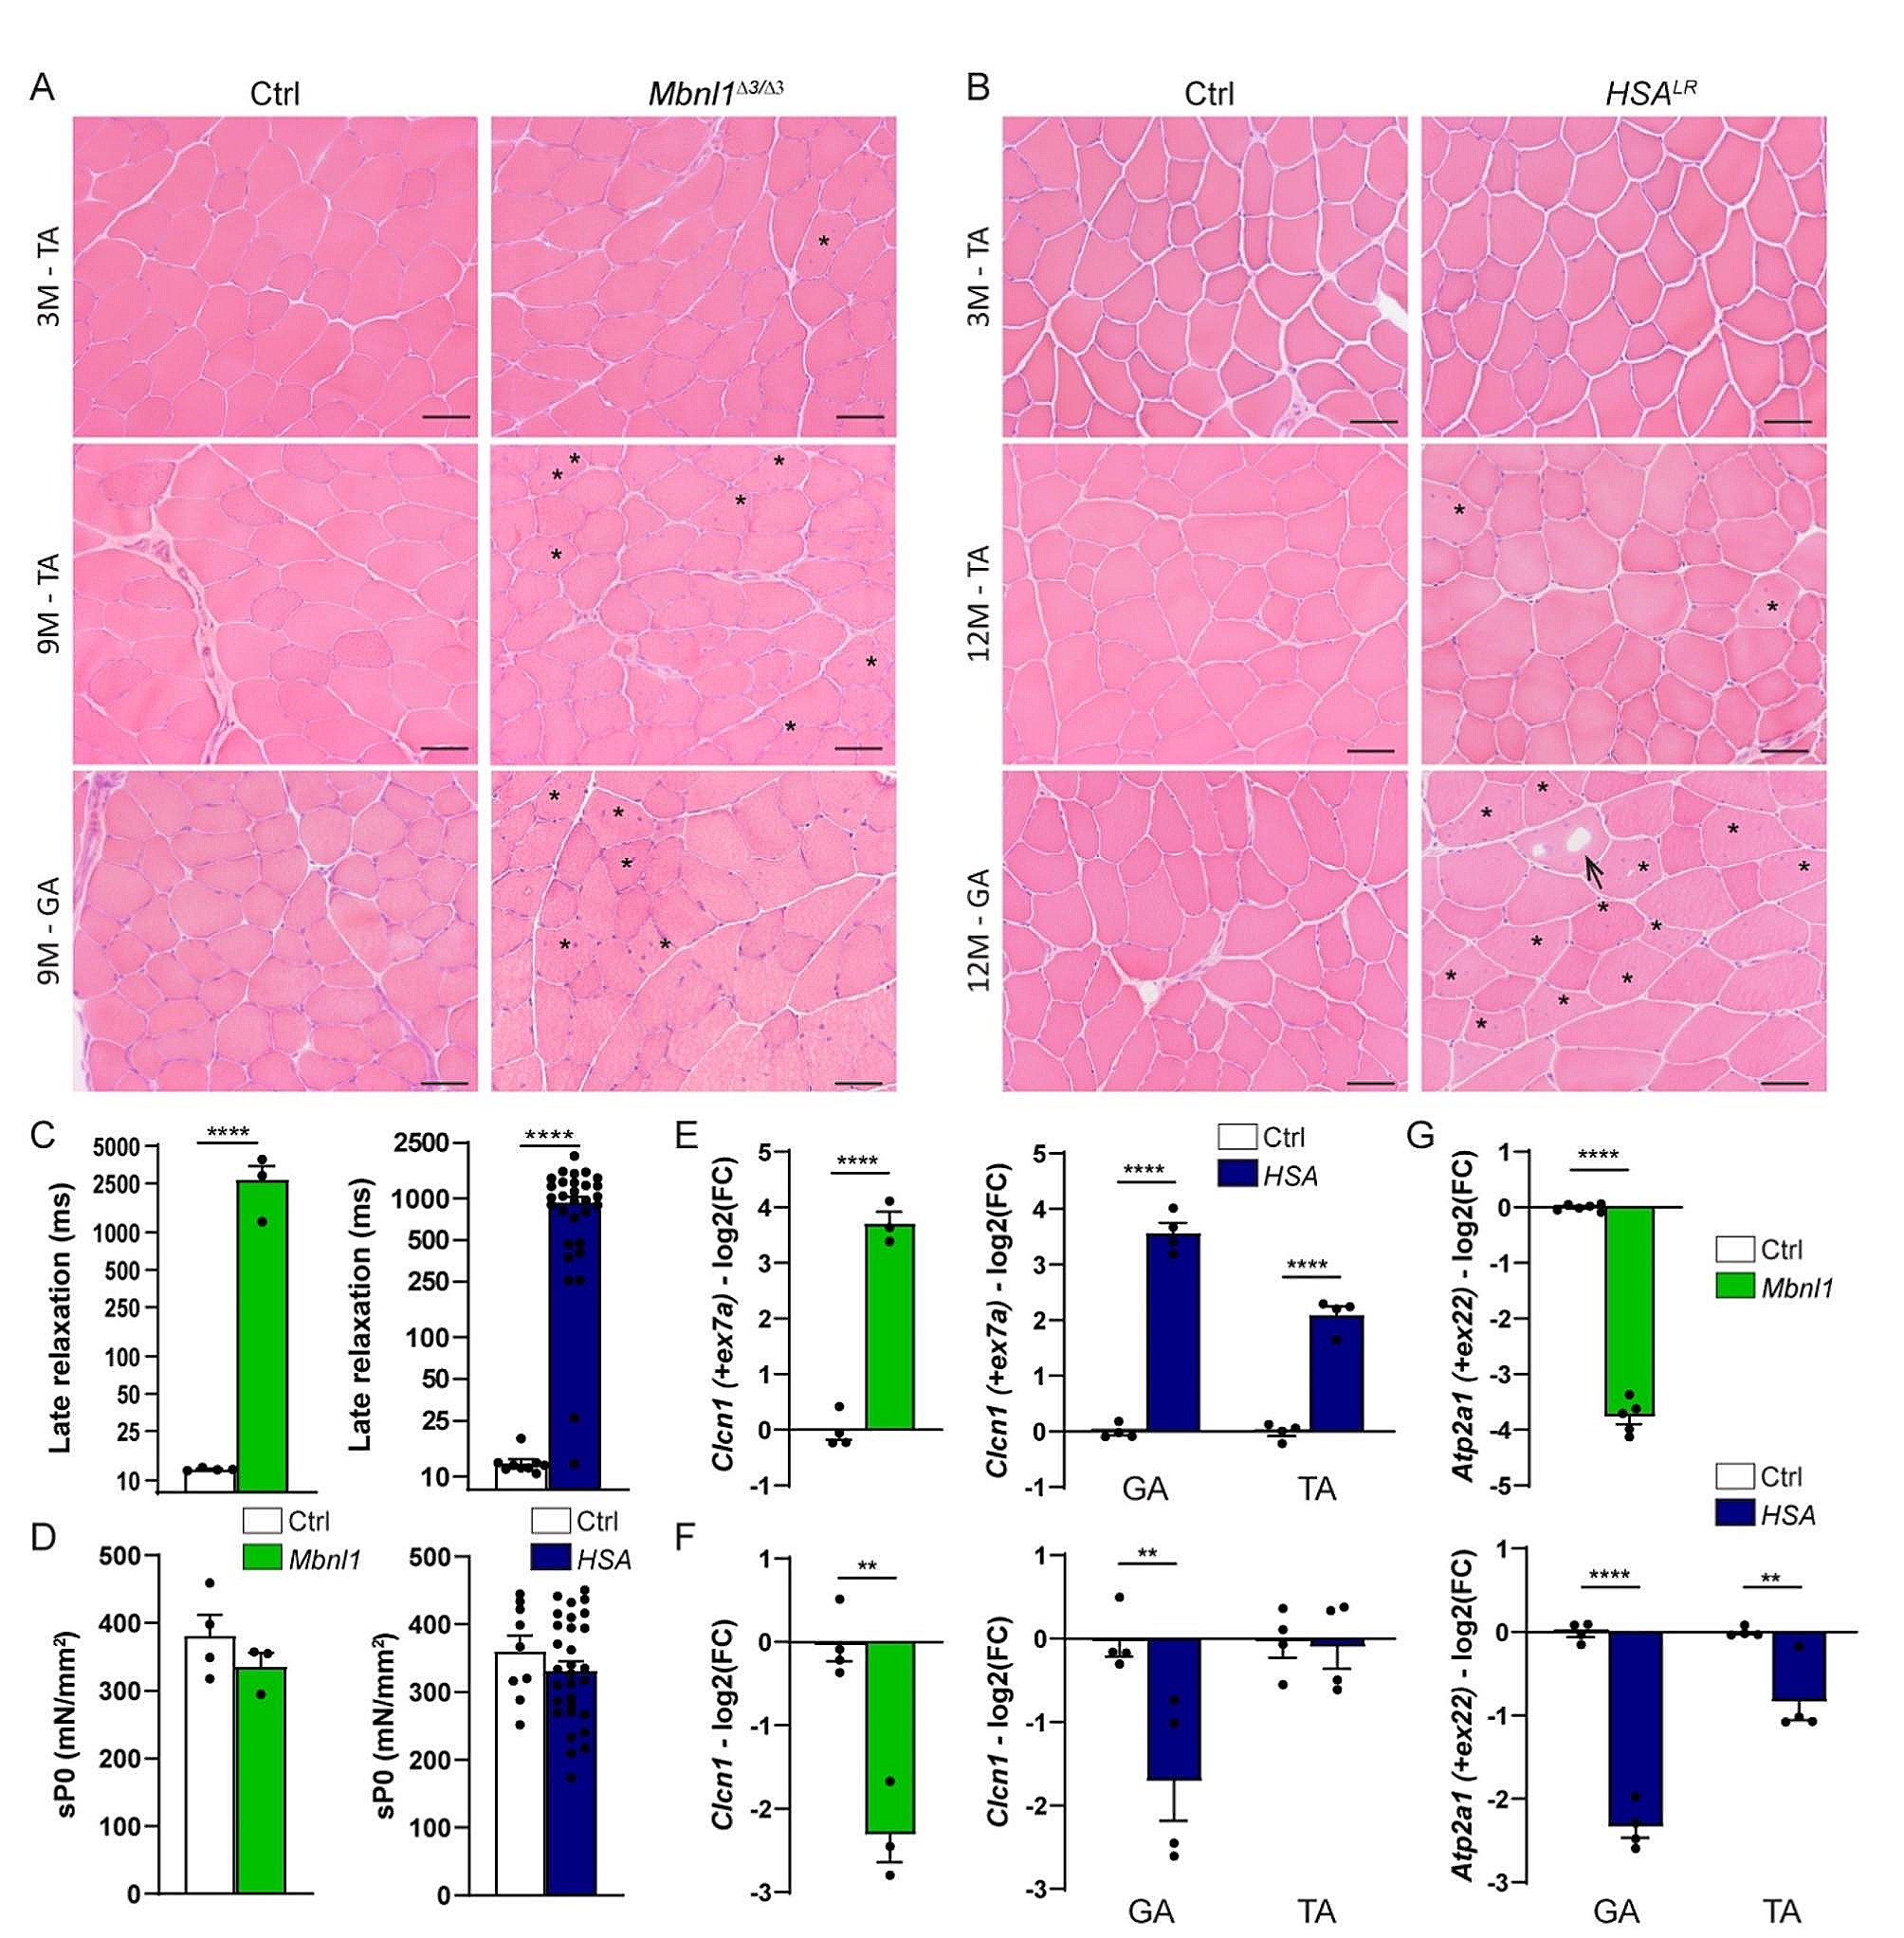


To evaluate changes in NMJs and activity-dependent pathways in DM1, we selected the Mbnl1ΔE3/ΔE3 and HSALR mouse lines, which are two well-established DM1 mouse models. In Mbnl1ΔE3/ΔE3 mice, deletion of Mbnl1 exon 3 leads to body-wide depletion of the splicing factor MBNL1 [22]. In contrast, HSALR mice express the HSA transcript (Human Skeletal Actin) with long (CTG) repeats only in skeletal muscle, which allowed to unveil cell-autonomous defects [21]. First, we compared the muscle phenotype between the two mouse models. There was no dystrophic sign in muscles from 3-month-old mutant mice (Fig. 1A, B), as previously reported [21, 22]. The dystrophic phenotype remained moderate in 9- and 12-month-old Mbnl1ΔE3/ΔE3 and HSALR mice, respectively (Fig. 1A, B). In particular, fibre size variation, increased proportion of fibres with internalized myonuclei, as well as intracellular vacuoles were present in Mbnl1ΔE3/ΔE3tibialis anterior (TA) and gastrocnemius muscles (Fig. 1A), as well as in gastrocnemius muscle from HSALR mice (Fig. 1B). In contrast, these alterations were rare in TA muscle from HSALR mice (Fig. 1B). This was consistent with previous reports describing differential muscle severity in this mouse model [28], which may pertain to the HSA promoter. This heterogeneity between muscles was not observed in Mbnl1ΔE3/ΔE3 mice. Both Mbnl1ΔE3/ΔE3 and HSALR mice exhibited a myotonic phenotype, as shown by the increased late relaxation time of extensor digitorum longus (EDL) muscle after ex vivo stimulation at 3 months (Fig. 1C and Fig. S1A) and 9/12 months (Fig. S1B) of age. In contrast, specific tetanic muscle force (sP0) was unaffected in 3-month-old mutant mice (Fig. 1D) and only slightly reduced in 9-month-old Mbnl1ΔE3/ΔE3 mice (Fig. S1C).
To evaluate DM1-associated mis-splicing, we next quantified the inclusion of exons 7a and 22 of the Clcn1 and Atp2a1 genes, which encode ClC-1 channel and SERCA1 (Sarco/Endoplasmic Reticulum Ca2+-ATPase), respectively. The inclusion of Clcn1 exon 7a was strongly increased in Mbnl1ΔE3/ΔE3 TA muscle (Fig. 1E) and was accompanied by major reduction in total Clcn1 transcript levels (Fig. 1F). Clcn1 mis-splicing and down-regulation were similar in gastrocnemius muscle from HSALR mice (Fig. 1E, F). In contrast, TA muscle from HSALR mice showed milder changes in Clcn1 splicing and no reduction in total Clcn1 transcript levels (Fig. 1E, F). Similarly, the inclusion of Atp2a1 exon 22 was abrogated in Mbnl1ΔE3/ΔE3 TA muscle and in gastrocnemius muscle from HSALR mice, while it was reduced by only half in HSALR TA muscle (Fig. 1G). These results confirm that both mouse models have mild muscle alterations, with similar DM1-associated phenotype observed in Mbnl1ΔE3/ΔE3 muscles and HSALRgastrocnemius muscle, and milder changes detected in TA muscle from HSALR mice.
Fig. 1
Muscle phenotype in Mbnl1ΔE3/ΔE3 and HSALR mice. A, B H&E coloration reveals moderate myopathic alterations in TA and gastrocnemius (GA) muscles from 3- and 9-month(M)-old Mbnl1ΔE3/ΔE3 (A) and 3- and 12-month(M)-old HSALR mice (B). Asterisks and arrows point to internalized nuclei and vacuoles, respectively. Scale bar, 100 μm. C Late relaxation time upon stimulation is increased in EDL muscle from 3-month-old Mbnl1ΔE3/ΔE3 and HSALR mice, as compared to control mice. n = 4 Ctrl / 3 Mbnl1ΔE3/ΔE3; 9 Ctrl / 30 HSALR. D Specific tetanic force (sP0) of EDL muscle is unchanged in 3-month-old Mbnl1ΔE3/ΔE3 (n = 4 Ctrl / 3 KO) and HSALR (n = 9 Ctrl / 30 HSALR) mice. E-G qPCR analysis of Clcn1 exon7a inclusion (E), Clcn1 total mRNA levels (F) and Atp2a1 exon22 inclusion (G) in TA muscle from Mbnl1ΔE3/ΔE3 mice and gastrocnemius (GA) or TA muscle from HSALR mice. Expression is normalised on total mRNA expression for splice variants (E, G) or on Tbp expression (F). Levels are relative to control and expressed as log2(Fold Change). n = 4 Ctrl / 3 Mbnl1ΔE3/ΔE3 (E, F); 6 Ctrl / 5 Mbnl1ΔE3/ΔE3 (G); 4 Ctrl / 4 HSALR. All data represent mean ± SEM. **p < 0.01; ****p < 0.0001; unpaired two-tailed Student’s t test
CaMKIIs are strongly deregulated in muscle from DM1 patients and mouse modelsPrevious reports pointed to mis-splicing of CAMK2 genes in DM1 tissues [3,4,5]. However, it remains unclear which CaMKII isoforms are affected in DM1 muscle, and what the consequences of their deregulation are. CaMKIIβ/γ/δ isoforms are encoded by the three genes CAMK2B, 2G and 2D, and are expressed in skeletal muscle. Each gene is expressed as different splice variants. In particular, CaMKIIβ splice variants include CaMKIIβ/βe/β’/βe’ and the muscle-specific variant CaMKIIβM, which arise from the alternative splicing of CAMK2b exons 13, 16 and 18–20 (Fig. S2A) [29,30,31]. Protein levels of CaMKIIβM, which can be distinguished from other CaMKII isoforms based on its size, were strongly reduced in both Mbnl1ΔE3/ΔE3 (Fig. 2A) and HSALR (Fig. 2B) muscles. Auto-phosphorylation of CaMKIIβM (phospho-Thr287) decreased as well (Fig. 2C), suggesting reduced CaMKIIβM activity. Notably, additional bands around the size of the other isoforms of CaMKIIβ and of CaMKIIγ/δ suggest the expression of alternative CaMKII isoforms in mutant muscles (Fig. 2A, B).
To characterize splicing events in the Camk2b, 2d and 2g genes in DM1 muscle, we used RNA-seq data that we obtained from HSALRgastrocnemius muscle. We detected significant changes in Camk2b transcript, with a major exclusion of exons 13 and 18 to 20 in HSALR muscle, compared to control (Fig. S2B, C). There was no change in the splicing of Camk2b exon 16 in HSALR muscle (Fig. S2B, C). We confirmed the expression of Camk2b transcripts lacking exon 13 (corresponding to CaMKIIβe/e’) in HSALR muscle by RT-PCR (Fig. S2D). Moreover, the amplicon including exons 18 to 20, which encode the variable inserts of CaMKIIβM, was barely detected in HSALR muscle (Fig. S2D). By quantitative RT-PCR, total levels of Camk2b transcripts increased in Mbnl1ΔE3/ΔE3 TA muscle, as well as in HSALRgastrocnemius, TA and EDL muscles (Fig. 2D). Using primers spanning Camk2b exons 12–14, we confirmed that the expression of Camk2b transcripts without exon 13 was more than four times higher in mutant muscles than in controls (Fig. 2E). Conversely, levels of Camk2b transcripts with exons 18 to 20 were reduced by half in Mbnl1ΔE3/ΔE3 TA muscle and in gastrocnemius muscle from HSALR mice (Fig. 2F) compared to controls. Notably, TA and EDL muscles from HSALR mice showed similar extent of Camk2b mis-splicing compared to gastrocnemius muscle (Fig. S2E, F). Interestingly, the mis-splicing of exon 13 and exons 18–20 is also confirmed by RNA-seq data of TA muscle from DM1 patients (Fig. S3) [32]. These results indicate that skeletal muscles from DM1 patients and mouse models shift to the expression of CaMKIIβe isoform (arising from exons 13/18–20 exclusion, with exon 16 inclusion), while CaMKIIβ (+ ex13 + ex16Δex18-20) and CaMKIIβM (+ ex13 + ex16 + ex18-20) are the predominant isoforms expressed in control muscles.
Transcripts encoding CaMKIIγ were also mis-spliced in HSALR muscle. These included increased inclusion of exons 13, 15 and 19 in Camk2g transcripts in HSALR muscle, as seen in RNA-seq reads (Fig. S4A, B) and by RT-PCR (Fig. S4C). Similar Camk2g mis-splicing was observed in Mbnl1ΔE3/ΔE3 TA muscle (Fig. S4D). Increased inclusion of CAMK2G exon 19 was also observed in TA biopsies from DM1 patients (Fig. S4E) [32]. In contrast, there was no major splicing change detected for Camk2d in HSALR muscle (Fig. S5A) and CAMK2D in DM1 muscle (Fig. S5B) [32]. Taken together, these results show that mis-splicing of some Camk2 transcripts alters the expression pattern of CaMKIIs in DM1 muscle.
Fig. 2
CaMKIIβ deregulation in Mbnl1ΔE3/ΔE3 and HSALR muscles. A-C Western blot analysis of CaMKII isoforms and quantification of CaMKIIβM levels in TA muscle from 3-month-old Mbnl1ΔE3/ΔE3 mice (A) and in gastrocnemius muscle from 3-month-old HSALR mice (B). Quantification of CaMKIIβM phosphorylated form in Mbnl1ΔE3/ΔE3 and HSALR muscles is shown in C. Protein levels are normalized on α-actinin (A, B) or on total CaMKIIβM (C), relative to control and expressed as log2(Fold Change). n = 3 (Ctrl/Mbnl1ΔE3/ΔE3) and 4 (Ctrl/HSALR) per group. D-F Quantitative RT-PCR analysis of total Camk2b mRNA levels (D), Camk2 exon 13 exclusion (E), and Camk2b exons 18–20 inclusion (F) in TA muscle from Mbnl1ΔE3/ΔE3 mice and in gastrocnemius (GA), TA and EDL muscles from HSALR mice. Data are normalized on Tbp levels (D) or on total Camk2b transcripts (E, F), relative to control and expressed as log2(Fold Change). n = 4 Ctrl / 3 Mbnl1ΔE3/ΔE3; 4 Ctrl / 4 HSALR (D, E); 3 Ctrl / 3 HSALR (F). All data are mean ± SEM; * p < 0.05; ** p < 0.01; ***p < 0.001; **** p < 0.0001; two-tailed unpaired Student’s t-test
Endplate fragmentation is not caused by abnormal AChR turnover in Mbnl1 ΔE3/ΔE3 and HSA LR miceAs CaMKIIs are key sensors of neural activity involved in NMJ maintenance, we analysed NMJ structures in EDL, TA and gastrocnemius muscles from 3-month-old and 9- or 12-month-old Mbnl1ΔE3/ΔE3 and HSALR mice. Pre- and post-synaptic compartments were stained in whole-mount muscle bundles with antibodies against neurofilament/synaptophysin and with α-bungarotoxin (Btx), which binds specifically to AChRs, respectively. The overall organization of the NMJs was preserved in mutant mice (Fig. 3A, B). In particular, we did not observe signs of denervation or abnormal axonal termination in mutant muscles. Acetylcholinesterase staining was also similar in control and mutant mice (Fig. S6A, B). However, the number of AChR fragments per endplate increased in muscles from both 3- and 9-month-old Mbnl1ΔE3/ΔE3 mice, compared to age-matched controls (Fig. 3C and Fig. S6C). A similar increase in endplate fragmentation was observed in gastrocnemius, TA and EDL muscles from HSALR mice (Fig. 3D and Fig. S6D). Of note, the volume occupied by AChRs was unchanged in Mbnl1ΔE3/ΔE3 and HSALR mice (Fig. S6E). There was a slight increase in the projected endplate area in HSALR EDL muscle, which may arise from endplate fragmentation (Fig. S6F). As the HSALR transgene is specifically expressed in skeletal muscle, these results indicate that post-synaptic perturbations contribute to endplate fragmentation in HSALR mice. Moreover, these NMJ alterations were detected as soon as 3 months of age, i.e., before changes in muscle histology, suggesting that they are primary deficit in DM1 mouse models and not a consequence of muscle degeneration/regeneration.
Fig. 3
Altered NMJ maintenance in Mbnl1ΔE3/ΔE3 and HSALR mice. A, B Fluorescent images of NMJ regions stained with α-bungarotoxin (Btx, red), antibodies against neurofilament/synaptophysin (green), and dapi (blue) in EDL muscles from 3- and 9-month-old Mbnl1ΔE3/ΔE3 mice (A) and 3-and 12-month-old HSALR mice (B). Scale bar, 50 μm. C, D Quantification of the number of fragments per endplate in EDL, TA and gastrocnemius (GA) muscles from 3- and 9/12-month-old Mbnl1ΔE3/ΔE3 (C) and HSALR (D) mice. n = 5/8 (EDL 3 M), 3/4 (TA 3 M), 4/4 (GA 3 M), 5/3 (all muscles 9 M) Ctrl/ Mbnl1ΔE3/ΔE3 (C); 11/12 (EDL 3 M), 7/8 (TA 3 M), 7/8 (GA 3 M), 4/3 (EDL 12 M), 4/4 (TA and GA 12 M) Ctrl/HSALR (D), with more than 50 fibres per muscle. Data represent mean ± SEM. **p < 0.01, ***p < 0.001, ****p < 0.0001, unpaired two-tailed Student’s t test
As CaMKIIs have been shown to regulate AChR recycling at the endplate [6], we next evaluated AChR turnover, by labelling “old” and newly formed receptors by two sequential injections of differently labelled Btx (Fig. 4A, B) [23, 33]. AChR turnover was low in all muscles, as described before for innervated conditions, with no change detected in Mbnl1ΔE3/ΔE3 muscles compared to controls (Fig. 4C). Similarly, there was no significant change in AChR turnover in TA and EDL muscles from HSALR mice (Fig. 4D). These results indicate that CaMKII deregulation, and more specifically the loss of CaMKIIβM, do not alter AChR dynamics in innervated DM1 muscle.
Fig. 4
AChR dynamics is not altered in Mbnl1ΔE3/ΔE3 and HSALR muscles. A Timeline of injections of α-bungarotoxin (Btx) for AChR turnover assay. d, days. Created with BioRender.com. B Turnover assay in EDL and TA muscles from Mbnl1ΔE3/ΔE3 and HSALR mice. Fluorescent images show “old” (green) and “new” (red) AChRs in Mbnl1ΔE3/ΔE3 and HSALR muscles. Scale bar, 50 μm. C, D AChR turnover in EDL and TA muscles from Mbnl1ΔE3/ΔE3 (C) and HSALR (D) mice. n = 10/11 (EDL) and 5/5 (TA) Ctrl/Mbnl1ΔE3/ΔE3 (C); 7/8 (EDL) and 3/3 (TA) Ctrl/HSALR (D), with more than 22 fibres per muscle. Data are mean ± SEM.
Synaptic gene expression and muscle fibre type composition are altered in DM1 mouse modelsCaMKIIs are well known to mediate activity-dependent regulations (e.g., of synaptic gene expression) in adult skeletal muscle [34]. To assess the consequences of CaMKII deregulation in DM1 muscle, we first measured mRNA levels of Myog, which encodes myogenin, and of the synaptic genes Musk, Chrna1, Chrne and Chrng genes, which encode MUSK and the α, ε and γ subunits of AChR, respectively. During muscle development, expression of Musk and Chrna1 becomes restricted to sub-synaptic myonuclei upon muscle innervation [35]. Simultaneously, Chrng transcripts are downregulated, while Chrne starts to be expressed in sub-synaptic nuclei (AChRε subunits replace AChRγ subunits). In non-synaptic regions of muscle fibres, synaptic gene repression is mediated by CaMKIIs and dependent on HDAC4/5 and myogenin inhibition (Fig. 5A) [8, 36]. This adult gene expression pattern depends on neural activity, as denervation reverts it back to a developmental pattern. Transcript levels of Myog tended to be higher in Mbnl1ΔE3/ΔE3 TA and HSALRgastrocnemius innervated muscles, compared to control muscles (Fig. 5B, C). In parallel, transcript levels of Musk, Chrna1, Chrne and Chrng were strongly increased in both mutant muscles (Fig. 5B, C). Their levels were less or not changed in EDL and TA muscles from HSALR mice (Fig. S7A, B).
Expression of Myh genes, which encode myosin heavy chains (MHC), is also dependent on neural activity and Ca2+-associated signalling [37]. In particular, by inhibiting the activity of myogenin and HDAC4, CaMKIIs may perturb the expression of Myh2 and Myh4, encoding MHCIIA and MHCIIB, respectively (Fig. 5A). Indeed, HDAC4 was shown to regulate the switch to type IIA fibres in TA muscle after nerve injury, by indirectly promoting the expression of Myh2 and directly repressing Myh4 [8]. Expression of Myh2 was strongly increased in Mbnl1ΔE3/ΔE3 innervated muscle, as compared to control (Fig. 5D). In contrast, Myh4 transcript levels were reduced in mutant muscle (Fig. 5D). Consistently, innervated TA muscle from Mbnl1ΔE3/ΔE3 mice displayed major accumulation of type IIA fibres and a loss of type IIB fibres compared to controls (Fig. 5E, F). Similarly, we previously described a mild switch towards type IIA fibres in TA muscle from HSALR mice [25]. There was also a tendency towards increased Myh2 transcript levels and reduced expression of Myh4 in HSALR TA muscle, as compared to controls (Fig. 5G). These results were in line with recent data describing myotonia-dependent switch towards oxidative muscle [38]. These results highlight that activity-dependent regulations underlying synaptic gene expression and fibre type composition, are perturbed in muscles from DM1 mouse models, which may involve CaMKII deregulation.
Fig. 5
DM1 model mice display deregulation of activity-dependent signalling pathways. A Regulation of activity-dependent pathways by CaMKII. B, C Quantitative RT-PCR analysis of Myog, Musk, Chrna1, Chrne and Chrng in TA muscle from 3-month-old Mbnl1ΔE3/ΔE3 mice (B) and in gastrocnemius muscle from 3-month-old HSALR mice (C). n = 6/5 Ctrl/ Mbnl1ΔE3/ΔE3 (except for Myog, n = 4/3) and 5/7 Ctrl/HSALR (except for Myog and Chrna1, n = 4). D mRNA levels of Myh2 and Myh4, encoding MHC2A and MHC2B, in Mbnl1ΔE3/ΔE3 TA muscle. n = 6/5 Ctrl/Mbnl1ΔE3/ΔE3. E, F Fluorescent images of control and Mbnl1ΔE3/ΔE3 muscles, stained with antibodies against MHC2A (red) and laminin (green), and quantification of the proportion of type IIA, IIX and IIB fibres in control and mutant muscles (F). Scale bar, 500 μm. G mRNA levels of Myh2 and Myh4 in HSALR TA muscle. n = 3/4 Ctrl/ HSALR. All transcript levels (B, C, D, G) are normalized to Tbp, relative to control and expressed as log2(Fold Change). All data are mean ± SEM; * p < 0.05; ** p < 0.01; *** p < 0.001; ****p < 0.0001; two-tailed unpaired Student’s t-test
HDAC4 accumulates in Mbnl1 ΔE3/ΔE3 and HSA LR musclesCaMKIIs inhibit the nuclear import, and thereby the activity of HDACs, such as HDAC4 [39]. To determine whether changes in HDAC4 pathway mediate the effect of CaMKII deregulation on activity-dependent regulations in DM1 mouse models, we analysed the expression of HDAC4 and of its target genes in Mbnl1ΔE3/ΔE3 and HSALR muscles. While transcript levels of Hdac4 were unchanged in Mbnl1ΔE3/ΔE3 and HSALR muscles (Fig. S8A), HDAC4 protein levels were higher in mutant muscles, as compared to controls (Fig. 6A, B). CaMKII-dependent phosphorylation of HDAC4 (Ser632) remained unchanged in Mbnl1ΔE3/ΔE3 muscle, but decreased in HSALR muscle (Fig. 6A and Fig. S8B). Notably, HDAC4 accumulated in nuclear fractions of Mbnl1ΔE3/ΔE3 and HSALR muscles (Fig. 6C, D). In contrast, HDAC4 protein levels were unchanged in cytosolic fractions of mutant muscles (Fig. 6E, F). This suggests that HDAC4 nuclear import is increased in Mbnl1ΔE3/ΔE3 and HSALR muscles. HDAC4 remained, however, barely detectable in mutant muscles by immunostaining (Fig. S8C). To assess whether HDAC4 accumulation translates into higher nuclear activity, we next evaluated the expression of target genes directly repressed by HDAC4. We focused on Dach2 and Mitr [36, 40], as well as on Ramp2 (Receptor Activity Modifying Protein 2), Actc1 (Actin alpha cardiac muscle 1), Cdh1 (Cadherin 1) and Dhrs7c (Dehydrogenase/Reductase 7 C), which were identified in public RNA-seq data as HDAC4 targets repressed after denervation [41]. Consistent with higher HDAC4 activity, transcript levels of Dach2, Actc1, Ramp1, and to a lesser extent of Dhrs7c, were reduced in Mbnl1ΔE3/ΔE3 and/or HSALR muscles (Fig. 6G), as observed for Myh4 (Fig. 5D, G). However, the expression of other genes was unchanged (Cdh1) or increased (Mitr) in mutant muscles compared to controls (Fig. 6G), suggesting incomplete or mild increase in HDAC4 activity. Hence, nuclear HDAC4 accumulation in skeletal muscle from DM1 mouse models may contribute to transcriptional changes of some activity-dependent genes downstream of CaMKII deregulation in innervated conditions.
Fig. 6
Changes in HDAC4 signalling pathway in Mbnl1ΔE3/ΔE3 and HSALR muscles. A, B Western blot analysis of HDAC4 and its phosphorylated form (Ser632) in total protein lysate of Mbnl1ΔE3/ΔE3 and HSALR muscles. Quantification of total levels is given in B. Quantification of phosphorylated levels is given in Supplementary Material, Fig. S8B. Total levels are normalized to α-actinin. n = 3 per group. C, D Western blot analysis of HDAC4 in nuclear (C, D) and cytosolic (E, F) fractions of gastrocnemius muscle from Mbnl1ΔE3/ΔE3 mice and HSALR mice. Quantifications of HDAC4 levels are given in D and F. Levels are normalized to lamin-B (D) and tubulin (F). n = 5/4 Ctrl/Mbnl1ΔE3/ΔE3 and 3/4 Ctrl/HSALR. G mRNA levels of Dach2, Actc1, Ramp1, Dhrs7c, Cdh1 and Mitr in TA muscle from Mbnl1ΔE3/ΔE3 mice and in gastrocnemius muscle from HSALR mice. Transcript levels are normalized to Tbp. n = 4/3 Ctrl/Mbnl1ΔE3/ΔE3 (except for Dhrs7c and Cdh1, n = 6/5) and 4/4 (Dach2/Mitr), 6/6 (Actc1/Cdh1), 6/5 (Ramp1/Dhrs7c) Ctrl/HSALR. All protein (B, D, F) and RNA (G) levels are relative to control and expressed as log2(Fold Change). All data are mean ± SEM; * p < 0.05; ** p < 0.01; ****p < 0.0001; two-tailed unpaired Student’s t-test
Mbnl1 ΔE3/ΔE3 mice show resistance to denervation-induced muscle atrophyPerturbations observed in innervated muscle from DM1 mouse models are reminiscent of the changes induced after denervation (i.e., synaptic gene up-regulation, HDAC4 accumulation, fibre type switch). CaMKII deregulation in mutant mice may interfere with the effect of neural activity in skeletal muscle. In turn, it may impair the muscle response to neural inactivity and reduce adaptive changes in activity-dependent processes. This reduced muscle plasticity may contribute to progressive NMJ deterioration observed in DM1 mouse models. To test this hypothesis, we challenged activity-dependent signalling pathways in DM1 mouse models with nerve injury. To this end, we cut the sciatic nerve of 3-month-old Mbnl1ΔE3/ΔE3 and HSALR mice to obtain complete denervation of hind limb muscles. Unexpectedly, we observed that HSALR mice lose the expression of the HSA transgene after 3 days of denervation (Fig. S9A). Consequently, ribonuclear foci accumulation and Clcn1 mis-splicing were reduced in denervated HSALR muscle, as compared to innervated muscle (Fig. S9B, C). Therefore, we limited the analysis to the Mbnl1ΔE3/ΔE3 mouse line.
After denervation, the loss of muscle mass was significantly less in Mbnl1ΔE3/ΔE3 mice, as compared to control mice (Fig. 7A). Nerve injury did not aggravate muscle degeneration in Mbnl1ΔE3/ΔE3 mice (Fig. S10A). To get insights into the mechanisms of this atrophy resistance, we first evaluated changes in pathways known to contribute to muscle atrophy after denervation. Transcript levels of the atrogenes Fbxo32 and Trim63, which are induced by HDAC4 and FoxO pathways after nerve injury [42, 43], were similar in Mbnl1ΔE3/ΔE3 and control muscles 3 days after denervation (Fig. S10B). We and others have reported that the anabolic pathway Akt/mTORC1 (mammalian Target Of Rapamycin Complex 1) is deregulated in DM1 muscle [25], and that its activation contributes to muscle atrophy upon denervation [23, 43]. Thus, we assessed whether Akt/mTORC1 activity is perturbed in DM1 denervated muscle. At 3 days of denervation, there was no change in the levels of the phosphorylated, active form of Akt (AktP473) in Mbnl1ΔE3/ΔE3 and control muscles, and levels of the active form of S6 (S6P235) increased similarly in both denervated muscles (Fig. S10C). Moreover, levels of the autophagic marker LC3II remained largely unchanged in Mbnl1ΔE3/ΔE3 and control muscles, suggesting that autophagy is not strongly affected (Fig.
留言 (0)