
記住我
The study was approved by the Department of Research Council of Mashhad University of Medical Sciences, Faculty of Dentistry, Mashhad, Iran (No. 991557), and by the Ethics Committee of Mashhad University of Medical Sciences [IR.MUMS.DENTISTRY.REC. 1399.165]. All participating subjects provided signed informed consent. The total sample size for the study was 99 participants in three groups: OLP (n = 32), OSCC (n = 35), and a healthy control group (n = 32).
Inclusion and exclusion criteriaHealthy control subjects had no history of malignant, inflammatory, or systemic disease. Also, they were similar to the patient groups in age and sex. Eligible patients had not received anti-tumor therapy whose disease was confirmed by biopsy; their samples had the quality to perform real-time PCR tests; and they had no other history of malignancy. Participants with a history of other malignancies and an unwillingness to cooperate to continue the project, as well as samples that were not of the required quality, were excluded from the study.
Serum processing and RNA isolationIn this study, miRNAs were manually extracted from serum samples with high quality and purity, which was one of the most important achievements of this study. The procedure was as follows: 400–450 μl of each sample was collected in a 1.5-ml microtube and 800 μl of RNXplus (SinaClon, Iran) was added to it, and the samples vortexed for 15 s to homogenize and then were placed at room temperature for 3–4 min. 250 μl of chloroform was added to each microtube and shaken by hand for 15 s, incubated for 3–5 min at room temperature, and then centrifuged for 20 min (12,000 RPM, 4 °C). About 500 μl of supernatant was carefully transferred to new 1.5-ml DNase and RNase-free microtubes. Then, for RNA precipitation, 500 μl of isopropanol (Merck Co.) was added to each tube. The microtubes were gently covered and incubated overnight at − 20 °C. After the incubation period, the samples were centrifuged for 45 min (12,000 RPM, 4 °C) and supernatant was removed, and the RNA pellet was washed with 1 ml of cold 80% ethanol and centrifuged for 20 s (12,000 RPM, 4 °C). This step was done twice. Then, the pellet was dissolved in 20 μl of DEPC water and incubated for 5 min at room temperature. To determine the quantity and purity of the extracted miRNAs, NanoDrop 2000c (Thermo Scientific 2000, USA) was used based on absorbance ratio of 260/280 nm. RNAs with sufficient quantity (50 mg/μl) and purity (ratio 2–1.5) were used for the synthesis of complementary DNA (cDNA).
Reverse transcriptionAn Adscriptc DNA synthesis kit (REF: 22,701, Bio-Tech, Addbio, Korea) was used to synthesize cDNA using an ABI thermocycler (One Step, USA) in a final volume of 20 µl containing 10 µl of 2X reaction buffer, 2 µl of 10 mM dNTP mixture, 6 µl of RNA, 1 µl of RT primer (1 pM) for U6 or miR 31 5p, and 1 µl of 20X enzyme. Reverse transcription (RT) was performed using a temperature cycle procedure that included preincubation at 25 °C for 10 min, RT at 50 °C for 60 min, RT inactivation at 80 °C for 5 min, and holding at 12 °C.
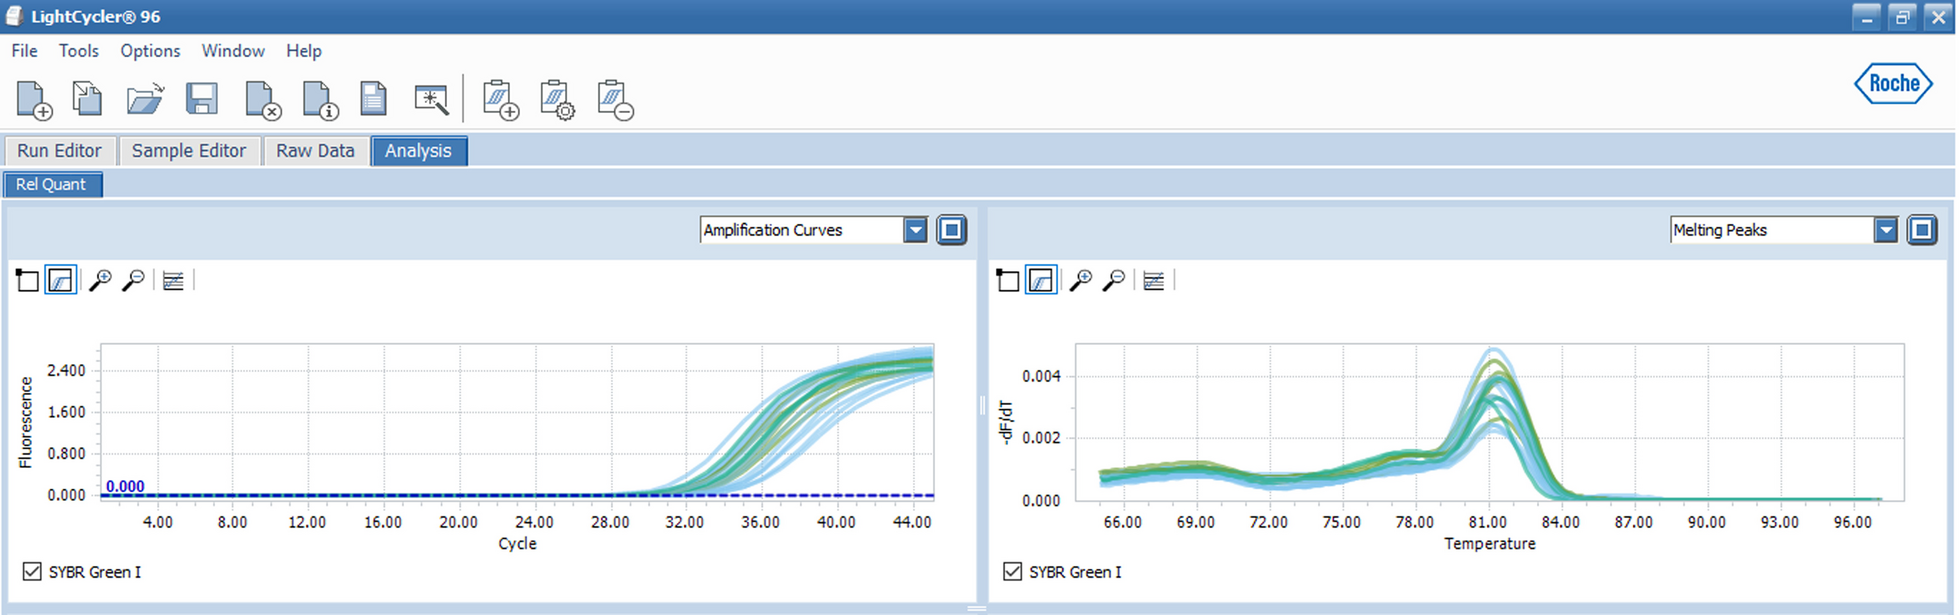
Real-time PCR (qPCR)The qPCR was performed to examine relative expression of miR-31-5p compared with U6 as a reference gene using SYBR Green method. The following primers were used: miR-31-5p forward, 5′-GAGGCAAGATGCTGGC-3′ and reverse, 5′-GTCGTATGCAGAGCAGGGTCCGAGGTATTCGCACTGCATACGACAAAATATGG-3′; U6 forward, 5′-AAGGATGACACGCAAATTC-3' and reverse, 5′-GTCGTATGCAGAGCAGGGTCCGAGGTATTCGCACTGCATACGACAAAATATGG-3′. All reactions were carried out in duplicate in separate wells of 20 µl total volume. 0.5 µl of each primer (10 pM), 10 µl of SYBR Green master mix (XX) (SMOBIO, Taiwan), 7 µl of distilled sterile water, and 2 µl of cDNA were used in each reaction. Following a preincubation phase at 95 °C for 30 s, 50 cycles at 95 °C for 5 s for denaturation, and 60 °C for 30 s for annealing were performed using the Light Cycler 96 (Roche, Germany). The ΔΔCT technique was utilized to examine relative expression of qPCR data. Additionally, we examined the melting curve to verify precise target amplification (Fig. 1).
Fig. 1
The melting curve (right) and amplification plot (left) of miR-31-5p and U6 expressions in real-time PCR
Analytical statisticsSPSS software was used for all data analysis (version 25). The relative miRNA expression level was computed as 2−ΔΔCT, which is a frequently used measure of miRNA expression after the data had been normalized by the threshold cycle number ΔCt. A P value less than 0.05 was considered significant.
留言 (0)