Patients
The present research study was executed on fifty patients diagnosed with type II diabetes (mean age 58.1 ± 6.1 years, 42% males) recruited from the Nephrology Department in Theodor Bilharz Research Institute (Giza, Egypt) in the period from November 2018 to February 2019.
Study population
Diabetic patients diagnosed with fasting plasma glucose ≥ 126 mg/dl or 2 h postprandial ≥ 200 mg/dl during oral glucose tolerance test (OGTT) or hemoglobin A1c ≥ 6.5% were included.
Patients with nephropathy not caused by diabetes, acute inflammation, tuberculosis, autoimmune diseases, cancer, cardiovascular diseases, or patients with other endocrinal disorders apart from diabetes were excluded from this study.
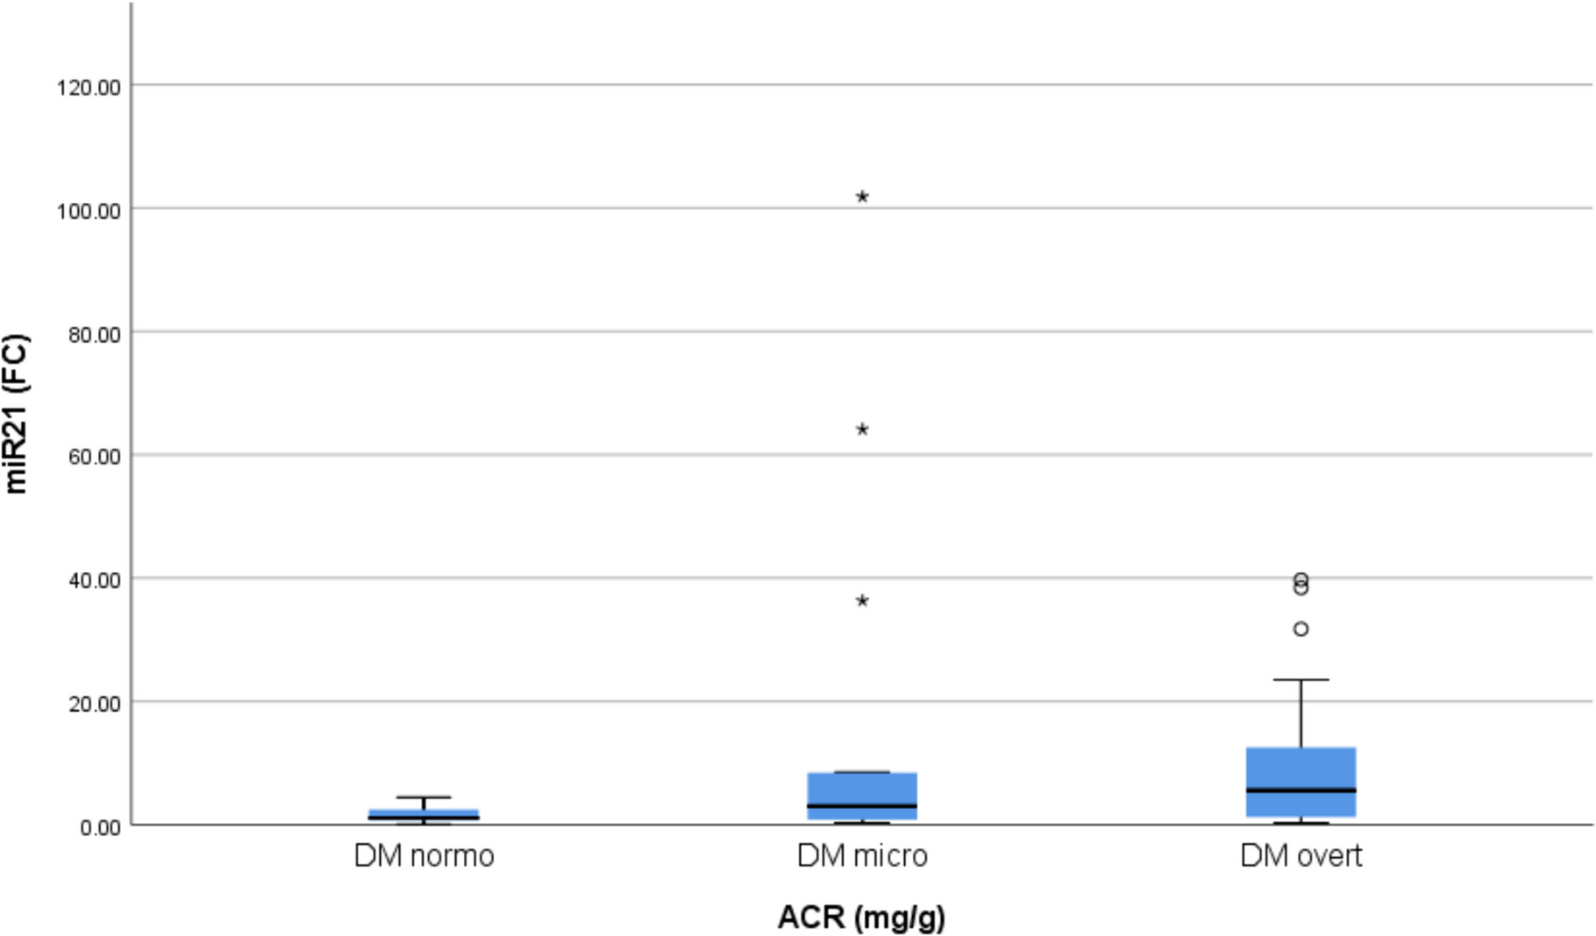
The studied individuals were classified according to ACR into 3 groups:
Group (I): individuals with type II diabetes and normoalbuminuria (n = 16, mean age 57.69 ± 5.79 years, 7 males and 9 females, ACR < 30 mg/g).
Group (II): individuals with type II diabetes and microalbuminuria (n = 16, mean age 56.25 ± 4.17 years, 6 males and 10 females, ACR > 30 and < 300 mg/g).
Group (III): individuals with type II diabetes and overt proteinuria (n = 18, mean age 60.22 ± 7.35 years, 8 males and 10 females, ACR > 300 mg/g).
Patients were identified as having diabetes if they exhibited fasting plasma glucose levels of at least 126 mg/dL or 2 h postprandial plasma glucose levels of at least 200 mg/dL during an OGTT. Additionally, the condition was established if hemoglobin A1c levels exceeded 6.5%.
Patients were categorized as having diabetic nephropathy if they exhibited two out of three consecutive urinary ACRs of more than 30 mg/g.
Individuals with diabetes who presented with nephropathy due to causes such as heart failure, liver disease, neurological or other endocrinological disorders, malignancies, acute or chronic infections, or autoimmune diseases were considered ineligible for participation in the study.
Age, gender, BMI, and diabetes duration were among the demographic and clinical data collected.
The patient's medical history was examined to identify any prior myocardial infarction or stroke. The identification of concurrent hypertension was achieved by monitoring blood pressure measurements that exceeded 140/90 mmHg or by detecting the administration of medications for hypertension. Standard fundoscopy and neurological examinations were employed to ascertain the absence of retinopathy and neuropathy, respectively.
Sampling
Serum samples necessary for routine laboratory testing include plasma fasting glucose, postprandial glucose, kidney function tests and lipid profile. To analyze HbA1c, EDTA samples were obtained, whereas urine samples were acquired to determine the urinary albumin/creatinine ratio (ACR). A Beckman Coulter AU480 analyzer was utilized for the analysis (Beckman Coulter, Brea, California, USA). The calculation of estimated GFR (eGFR) applied the Modification of Diet in Renal Disease (MDRD) formula:
“eGFR = 175 × (Serum creatinine) − 1.154 × (Age) − 0.203 × (0.742 if female) × (1.212 if African American) (mL/min/1.73 m2)” [16].
Serum samples used were stored at − 80 °C until RNA extraction for determination of the expression level of mature miR-21 and miR-192.
Written informed consent was acquired from every patient involved. The research methodology followed the Helsinki Declaration of 1975, as amended in 2012, and obtained permission from the A institutional review board before initiating subject enlistment [17].
TGF-β1 level
The amount of TGF-β1 was measured by utilizing the Human TGF beta1 platinum ELISA kit from Affymetrix eBioscience, catalog number BMS249-4. The purpose of developing an ELISA for human TGF-β1 solid-phase sandwich was to determine the amount of target that is attached between two matched antibodies.
Analysis of the expression of miRNA genes
Serum RNA was extracted utilizing the miRNeasy Mini Kit (Catalog no. 217004) to profile miRNA expression. miRNA complementary DNA (cDNA) was synthesized via reverse transcription of RNA using the stem-loop RT primer and the TaqMan® MicroRNA Reverse Transcription reagent. This enabled the reverse transcription of synthetic controls and target miRNAs simultaneously. Real-time PCR was conducted utilizing TaqMan microRNA assays that are specific to the mature sequence under evaluation. miR-21 (hsa-miR-21-3p) MIMAT0004494 with mature sequence CAACACCAGUCGAUGGGCUGU, miR-192 (hsa-miR-192-3p) MIMAT0007017 with mature sequence CUGCCAAUUCCAUAGGUCACAG and Cel-miR-39 (Cel-mir-39-3p) MIMAT0000010 with mature sequence UCACCGGGUGUAAAUCAGCUUG.
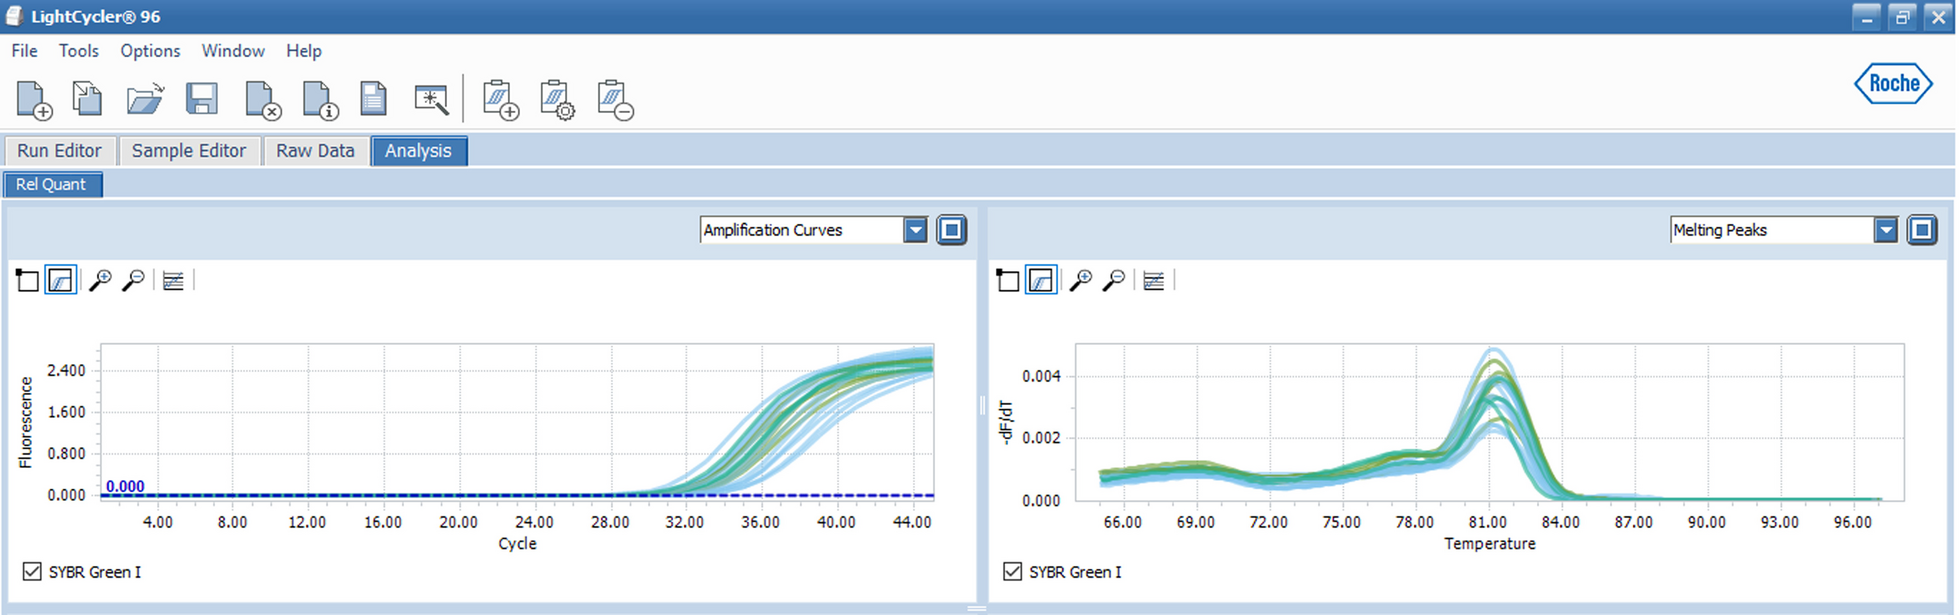
The qPCRs were performed employing an Applied Biosystems StepOne real-time PCR instrument. The cycle threshold was implemented to figure out the level of miRNA expression. To determine the degree of expression demonstrated by a particular miRNA, the CT value of that miRNA is subtracted from the average CT value of reference genes per sample in a provided set of samples. As a standard, the synthetic control gene was utilized. Using equation 2−∆∆CT, the relative expression (fold change) of each putative miRNA in every group was calculated, with Cel-miR-39 serving as the reference gene. The ΔCT value was calculated for each miRNA in each sample utilizing the subsequent formula: to determine the ΔCT sample, the CT value of the miRNA is subtracted from the CT value of Cel miR 39. Next, the ΔΔCT value was determined using the formula: ΔΔCT = (CT miRNA − CT Cel miR 39) for the patient group − (CT miRNA − CT Cel-miR 39) for the control group.
Chemicals used
TGF-β1 was measured using the Human TGF beta1 platinum ELISA kit from Affymetrix eBioscience, catalog number BMS249-4. Serum RNA extraction was done utilizing the miRNeasy Mini Kit (Catalog no. 217004). cDNA was synthesized via reverse transcription of RNA using the stem-loop RT primer and the TaqMan® MicroRNA Reverse Transcription reagent. Real-time PCR was conducted utilizing TaqMan microRNA assays and performed on an Applied Biosystems StepOne real-time PCR instrument.
Statistical analysis
For classification and data entry, version 26 of the Statistical Package for the Social Sciences (SPSS) (IBM Corp., Armonk, NY, USA) was used. The quantitative data were specified by the minimum and maximum values, the mean, standard deviation, and median. An alternative approach was used to describe the categorical data by employing frequency (count) and relative frequency (percent). The Kruskal–Wallis and Mann–Whitney tests, which are nonparametric, have been used to compare quantitative variables. Categorical data were compared utilizing the chi-squared test (χ2). The precise test was used in situations where the expected frequency was less than five. To determine the correlations between quantitative variables, the Spearman correlation coefficient was applied. We considered P-values less than 0.05 to be statistically significant. An analysis of the area under the receiver operating characteristic (ROC) curve was performed to ascertain the most effective cutoff value.

留言 (0)