
記住我


Sixteen female merino ewes (35–45 kg body weight) were housed in individual metabolic cages with free access to water and 800 g/day oaten chaff. The Animal Ethics Committee of the Florey Institute of Neuroscience and Mental Health (Ethics identification number: 21-030-FINMH) approved these experiments under guidelines laid down by the National Health and Medical Research Council of Australia. This report was written in accordance with the ARRIVE 2.0 guidelines [20]. As previously described, the ewes underwent two aseptic surgical procedures, including the general anesthetic techniques, as summarized below [21,22,23,24,25,26,27,28,29,30]. During the first surgery, the left carotid artery was exteriorized into a skin fold to form a carotid arterial loop, allowing easy access for subsequent arterial cannulation [24, 28]. Subsequently, a 20-mm transit-time flow probe (Transonic Systems, Ithaca, NY) was placed around the pulmonary artery to measure cardiac output (CO) [24]. Three weeks later, the carotid artery was cannulated, and the catheter was connected to a pressure transducer for measurement of arterial blood pressure (ABP) (providing systolic, diastolic, and mean arterial pressure: SBP, DBP, MAP) and heart rate and for collection of blood samples [28]. Three catheters were inserted into the right jugular vein: one for delivery of treatment, one for administering E. coli, and one for fluid resuscitation and vasopressors, as required. To maintain patency, the arterial and venous catheters were continuously infused with heparinized saline (10 U heparin/mL at 3 mL/hr). The next day, in the second surgical procedure, a 4-mm transit-time flow probe (Transonic Systems) was placed around the left renal artery to measure renal blood flow (RBF) [24]. The renal vein was cannulated for blood sampling, and two fiber-optic probes (Oxford Optronix, Abingdon, United Kingdom) were inserted into the renal cortex and medulla to measure renal cortical and medullary perfusion (RCP, RMP) and oxygenation (PrcO2, RrmO2) [22, 29]. A Foley catheter was inserted into the bladder, and a fiber-optic probe was inserted through a port and advanced to the tip of the Foley catheter to continuously measure partial urinary oxygen pressure (PuO2) [21, 22]. For all surgical procedures, animals were injected with intramuscular antibiotics (900 mg procaine penicillin, Ilium Propen, Troy Laboratories, Smithfield, NSW, Australia) and an analgesic (Flunixin meglumine, 1 mg/kg; Troy Laboratories or Mavlab), at start of surgery prior to the first incision and at 24 and 48 h postsurgery [22, 25, 30]. Before the experiments, animals were allowed at least five days of recovery following the second surgical procedure to minimize any effects of surgical stress.
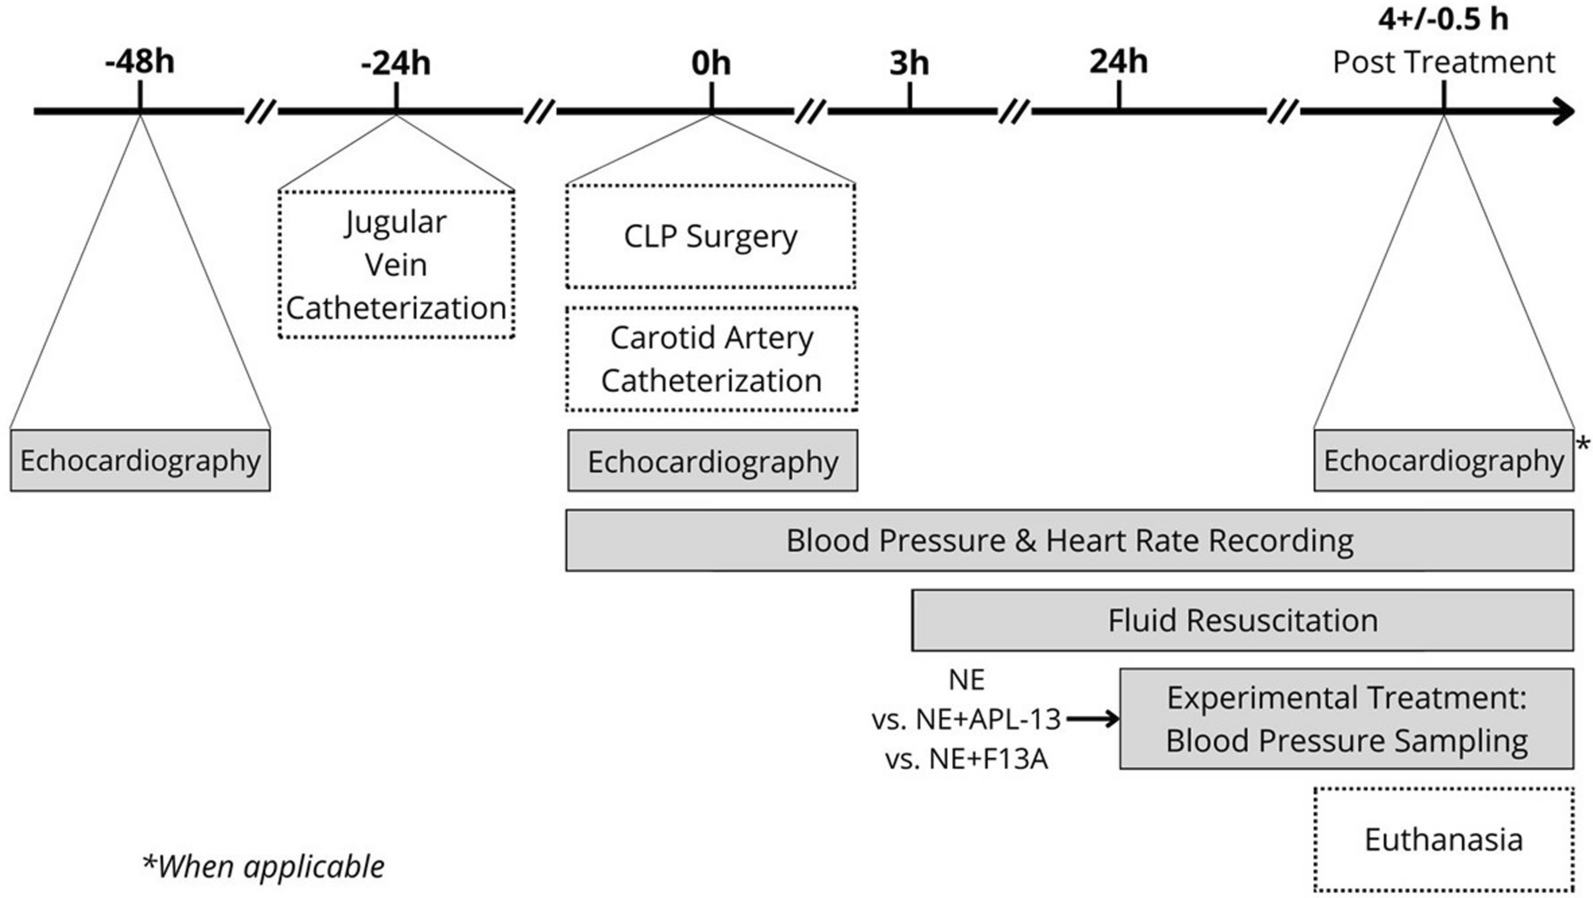
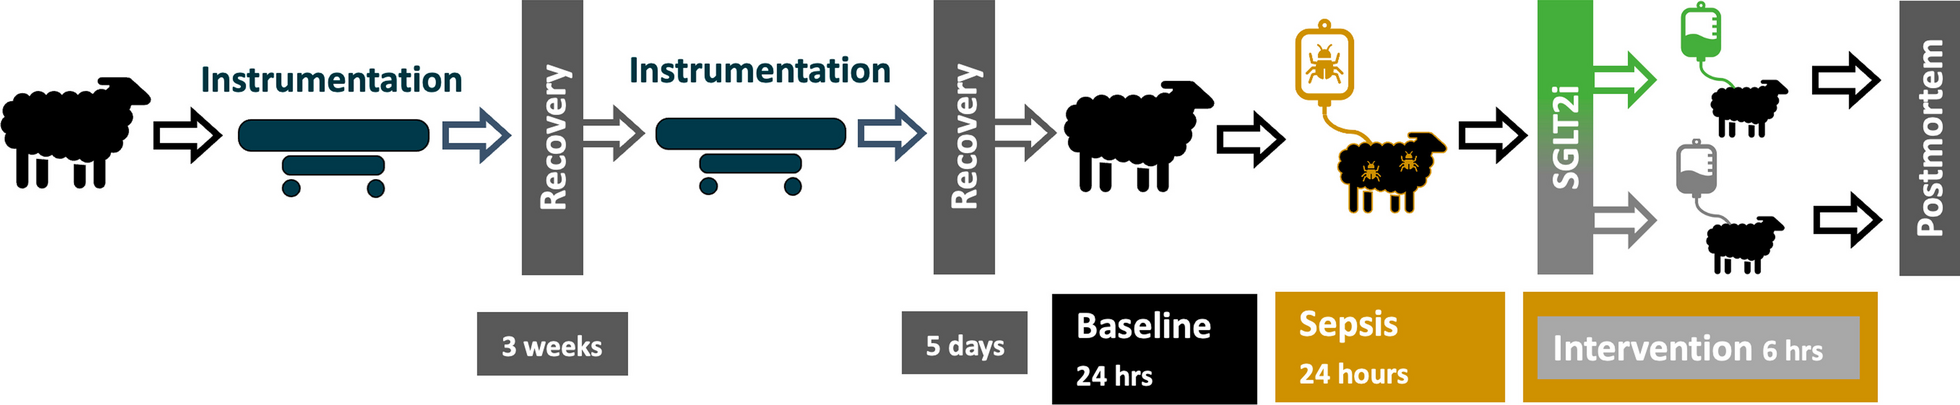
Experimental protocolA schematic representation of the experimental protocol and data collection time points are depicted in Fig. 1. Following a 24-h baseline period, sepsis was induced in non-anesthetized sheep with an intravenous dose of live E. coli (2.8 × 10⁹ colony-forming units [CFUs] over 30 min) as a bolus, followed by a continuous infusion (1.26 × 10⁹ CFU/h for the rest of the experiment). At 23.5 h of sepsis, fluid bolus therapy with Hartmann solution (Baxter Australia, 30 mL/kg over 30 min) was administered [30]. At 24 h of sepsis, the animals were randomized by online software built into the electronic data capturing software (Castor EDC, Castor B.V., Amsterdam, Netherlands). Animals in the intervention group received an IV bolus of 0.2 mg/kg empagliflozin (MedChemExpress LLC, Monmouth Junction, NJ, USA) dissolved in ß-cyclodextrin (MedChemExpress LLC, Monmouth Junction, NJ, USA) over 10 min. This is a clinically effective dose, as indicated by previous studies in critically ill patients in which no major adverse events were reported [31]. Animals in the comparator group received an equal volume of vehicle solution with ß-cyclodextrin. At the end of the protocol, 6 h after the bolus treatment, animals were euthanized with a lethal dose of sodium pentobarbitone (100 mg/kg, IV). Positions of the renal fiber-optic probes were confirmed at autopsy, and kidney biopsies were taken for histopathological assessment. [30]
Fig. 1
Study overview and experimental timeline
Data collectionA computer with a CED 1401 interface, running a data acquisition system (Spike 2 Software, Cambridge Electronic Design, Cambridge, United Kingdom), continuously recorded analog signals (ABP, heart rate, CO, renal blood flow, RCP, RMP, PrcO2 and RrmO2), temperature, and PuO2 at 100 Hz. Renal vascular conductance (RVC) was calculated as RBF/MAP. Stroke volume (SV) was calculated as CO/heart rate. We calculated body surface area (BSA) as 0.09*Weight(0.67), and cardiac index (CI) and stroke volume index (SVI) were calculated as CO/BSA and SV/BSA, respectively. We recorded hourly urine flow and collected 1-hourly urine samples at baseline and at 24, 26, 28, and 30 h time-points after induction of sepsis. Urine samples were collected for measurement of creatinine and sodium concentrations and subsequent analysis of renal excretory function. Arterial and renal venous blood samples were collected at baseline, just prior to the infusion of E. coli, and subsequently at 24, 26, 28, and 30 h of sepsis for measurement of blood oximetry (ABL System 625, Radiometer Medical, Copenhagen, Denmark), as well as creatinine, glucose, and ketones. The occurrence of AKI was based on “the Kidney Disease: Improving Global Outcomes (KDIGO)” clinical criteria; stage 1 AKI is characterized by a > 1.5-fold increase in plasma creatinine or oliguria of 0.5 ml/kg/h for > 6 h.
Statistical analysisData are reported as mean ± SD and between-group differences are reported as the difference with a 95% confidence interval (95% CI). MAP, heart rate, RBF, RVC, and biochemical markers are reported as the average over the baseline period and as hourly averages from 24 to 30 h after commencing the infusion of E. coli. Given the critical role in the development of AKI, we defined renal medullary tissue oxygenation as the primary outcome [26]. Based on our previous investigations, detecting a 50% reduction in medullary tissue oxygenation with 90% power and α = 0.05 required a sample size of eight sheep per group [26]. Data were analyzed using repeated-measures analysis of variance (ANOVA) with factors Intervention (PIntervention: vehicle or empagliflozin), time (PTime), and their interaction (PIntervention*Time). Specific post-hoc comparisons were made using the Student’s T-test. The absolute changes in response to the intervention after induction of sepsis were compared with responses at baseline, prior to induction of sepsis, and 6 h after treatment commenced, using repeated-measures ANOVA. The histological assessment of kidney tissues collected was scored by a pathologist who was blinded to the intervention and analyzed using Fisher’s exact test. Statistical analysis was performed using GraphPad PRISM 6.0 (GraphPad Software, La Jolla, CA). All variables were assessed for normality and log-transformed where appropriate. A two-sided P-value less than or equal to 0.05 was considered statistically significant without correction for multiple comparisons.
留言 (0)