
記住我
In recent years, there has been an increasing interest in understanding the role of Gα13 in cancer [12, 21, 27, 28]. Up to now, the protein has been shown to be upregulated in more aggressive types of solid cancers, and its levels correlate to poorer prognosis [12, 15, 18, 29]. Gα13 has also been shown to induce migration, invasion and stemness when expressed in cancer cells [30,31,32]. In this vein, our previous studies in TNBC cells indicated that Gα13 contributes to increased migration, invasion and suppression of kallikreins (KLKs) in vitro [22, 23]. Here, we broadened the scope and examined the expression of Gα13 across subtypes in breast cancer and the impact of Gα13 expression level on patient survival.
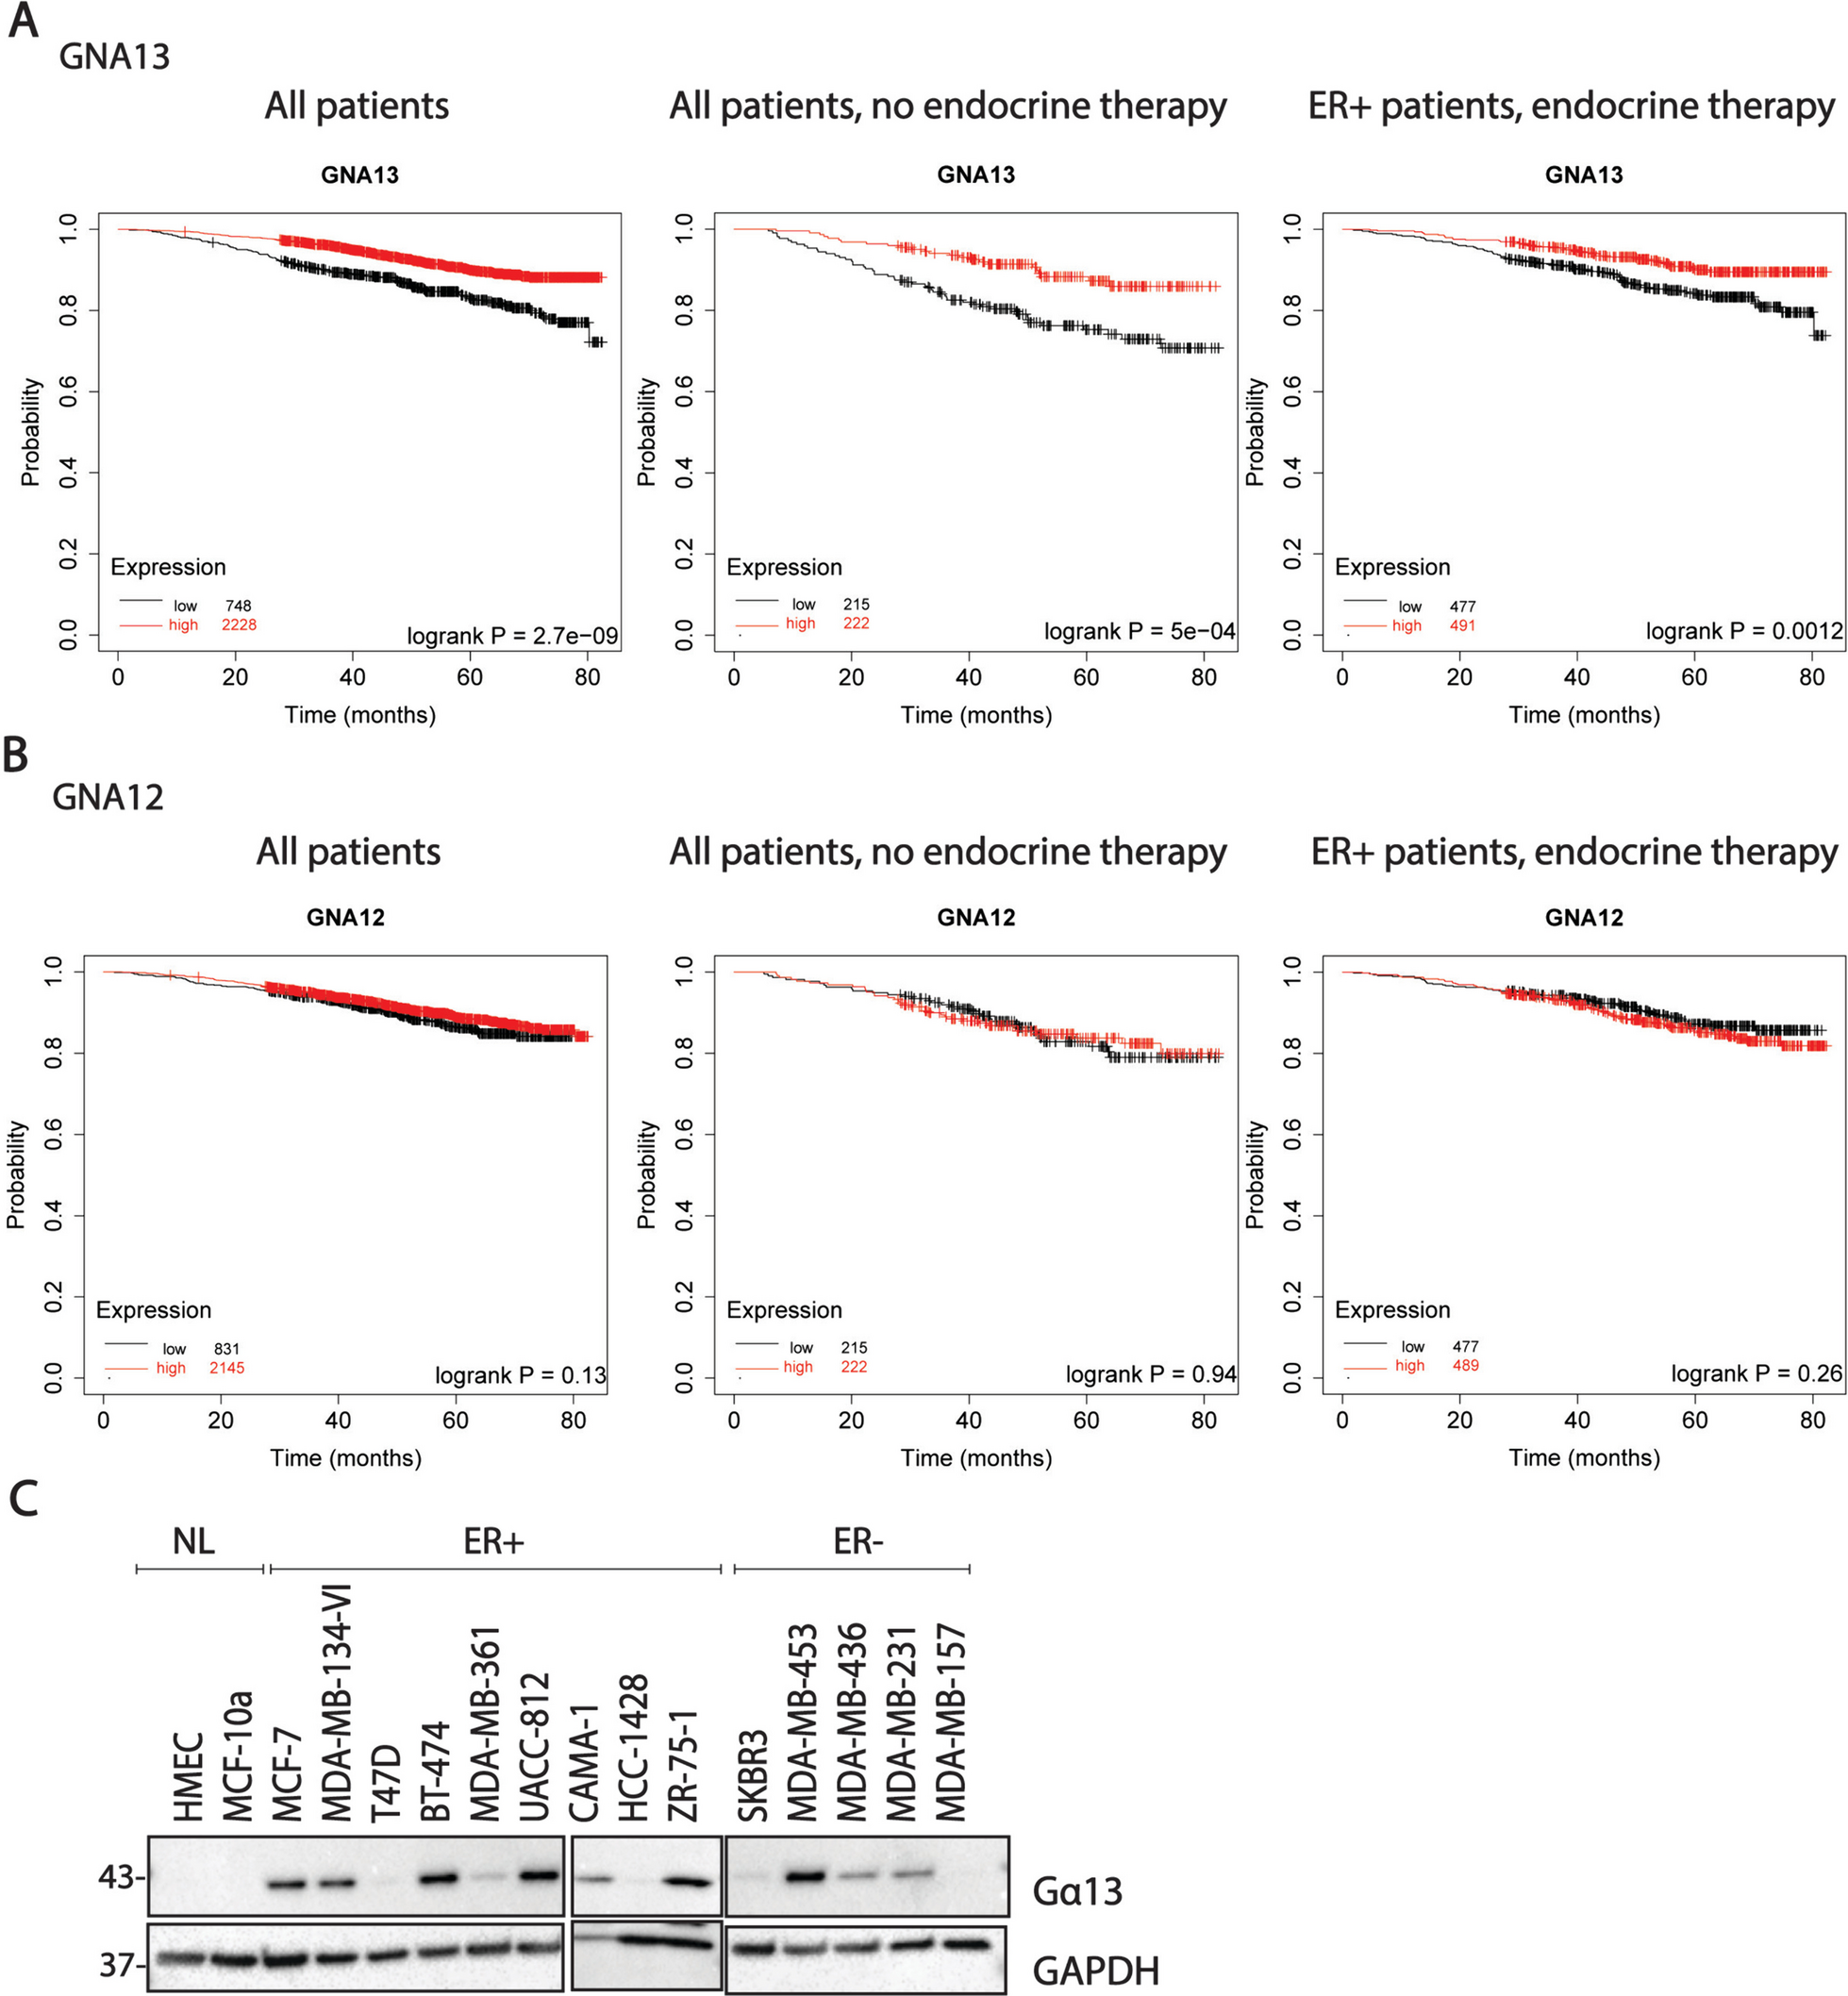
We first examined the correlation between GNA13 expression (TCGA) and overall survival in breast cancer using KMplotter [33, 34]. Interestingly, high GNA13 expression significantly correlated with better survival rates in all breast cancer patients regardless of treatment group, in patients who underwent treatments other than endocrine therapy, in ER+ patients who underwent endocrine therapy (Fig. 1A) and also in ER- patients (Fig. S1A). In contrast, GNA12 levels did not correlate with patient survival in any of the above groups (Fig. 1B). We then surveyed a small panel of ER+ and ER− cells and found that Gα13 levels varied widely among cell lines regardless of the ER status (Fig. 1C). Based on the interesting notion that higher GNA13 expression predicts better survival, different from the previous expectation and from its family member GNA12, we focused on the characterization of the role of Gα13 in breast cancer cells using selected Gα13-high and Gα13-low cell line models.
Fig. 1
High Gα13 expression predicts better survival in breast cancers. A Kaplan–Meier plot showing the association between expression of GNA13 and overall survival in breast cancer in patients in response to all treatment modalities (left); treatments other than endocrine therapy (center) or ER+ breast cancer patients given endocrine therapy (right) B Kaplan–Meier plot showing the association between expression of GNA12 and overall survival in breast cancer in patients in response to all treatment modalities (left); treatments other than endocrine therapy (center) or ER+ breast cancer patients endocrine therapy (right) (data obtained from Kmplotter, www.kmplot.com) C Immunoblot showing the levels of Gα13 in a panel of breast cancer cell lines. HMeC, MCF-10a are non-tumorigenic. MCF-7, T47D, MDA-MB-134-VI belong to luminal A subtype (ER +). BT-474, MDA-MB-361, UACC-812 are luminal B(ER+), SKBR3 and MDA-MB-453 are ER- Her2+ and MDA-MB-436, MDA-MB-231 and MDA-MB-157 belong to TNBC. These immunoblots are representative of three independent experiments
Gα13 negatively regulates proliferation of ER+ breast cancer cellsWe next investigated the function of Gα13 on the proliferation of ER+ T47D, MCF7 and ZR-75-1 and ER− SKBR3 and MDA-MB-231 breast cancer cells. For GNA13-high MCF-7 and ZR-75-1 cells, stable GNA13 knockdown was established using retroviral transduction of short hairpin RNAs. For GNA13-low T47D, SKBR3 and MD-MB-231 cells, stable physiological level of expression of GNA13 was established using a lentiviral vector with human GNA13 coding sequence. In the ER+ GNA13-high ZR-75-1 and MCF-7 cells, knockdown of GNA13 resulted in a significant increase in cell proliferation (Fig. 2A and B). To further validate that the effect of knockdown on cell proliferation is target specific, we established an inducible GNA13 expression model in MCF-7 cells with stable GNA13 knockdown. Exogenous expression of GNA13 in MCF-7-shCtrl cells resulted in lowered cell proliferation, and reintroduction of GNA13 in MCF-7-sh-GNA13 cells resulted in a reversal of elevated cell proliferation resulting from GNA13 knockdown (Fig. 2C). This rescue experiment provided support for the target-specific role of Gα13 in suppressing cell proliferation. Consistently, exogenous expression of GNA13 in the GNA13-low ER+ T47D cells led to a marked decrease in cell proliferation (Fig. 2D). These proliferation results are in line with database analysis that indicates high GNA13 expression predicts better overall survival in breast cancers (Fig. 1A), but in contrast to the past understanding that Gα13 is oncogenic in solid tumors and has a pro-proliferative effect. This novel notion underscores the importance of evaluating Gα13 function in different cancers, even in different subtypes of cancers.
Fig. 2
Gα13 negatively impacts proliferation uniquely in ER+ breast cancer cells. A Viability assay to measure proliferation of ER+ ZR-75-1 cells expressing control shRNA or that targeting GNA13 as indicated. (Inset) immunoblot showing levels of Gα13 in the respective ZR-75-1 cell lines. B Proliferation of ER+ MCF-7 cells, expressing control shRNA or that targeting GNA13 as indicated, determined by confluence measurements using the live cell imaging platform IncuCyte®. (Inset) Immunoblot showing levels of Gα13 in the respective MCF-7 cell lines. C Proliferation of MCF-7 knockdown cells upon reintroduction of GNA13 as indicated, determined as in (B) (Inset) Immunoblot showing expression of Gα13 in the respective MCF-7 cell lines. D Cell viability assay to measure proliferation of ER+ T47D cells, expressing vector alone or that harboring GNA13, as indicated. (Inset) Immunoblot showing levels of Gα13 in the indicated ER+ T47D cell lines. E Proliferation of ER-/Her2+ SKBR3 cells expressing vector only or that containing GNA13. (Inset) Immunoblot showing levels of Gα13 in the respective SKBR3 cell lines. F Proliferation of ER−/Her2− MDA-MB-231 cells expressing either vector or that harboring GNA13. (Inset) Immunoblot showing levels of Gα13 in the respective MDA-MB-231 cells. All results shown are pooled data from three independent experiments. Data is presented as mean ± SD, and p-values are denoted as: *, p < 0.05, **, p < 0.01, ***, p < 0.001, and ****, p < 0.0001 or ‘ns’ for ‘not significant’. All Immunoblots are representative images of three independent experiments of the cells from the corresponding proliferation assays. See Experimental Procedures for details
We then expanded the study to include two ER− GNA13-low cell lines—SKBR3 and MDA-MB-231 cells. Comparing control and GNA13 stable expressing cells, we found that, in contrast to the ER+ cells as shown above, exogenous expression of GNA13 in these ER- cells had no impact on cell proliferation (Fig. 2E and F), suggesting that the effect of Gα13 on cell proliferation could be specific to ER+ breast cancer subtype. As ER+ type accounts for the majority of breast cancers and the role of Gα13 in this group is understudied, we focused on mechanistically elucidating its tumor suppressive role in the ER+ subtype for the reminder of the study.
Gα13 negatively regulates soft agar colony formation and in vivo tumorigenesis of ER+ breast cancer cellsAnchorage independent growth is a characteristic feature of tumorigenic cells; hence it is widely used as an in vitro assay to assess tumorigenicity of cancer cells. Consistent with the adherent cell culture proliferation results, knockdown of GNA13 resulted in increased colony formation in the GNA13-high MCF-7 (Fig. 3A) and ZR-75-1 cells (Fig. 3B), whereas overexpression of GNA13 in GNA13-low T47D cells resulted in decreased colony formation (Fig. 3C). Also, in line with the proliferation data, reintroduction of GNA13 in MCF-7-sh-GNA13 cells resulted in a reversal of the increased colony formation resulting from GNA13 knockdown (Fig. 3D). We then carried the assessment forward to in vivo tumor formation in an orthotopic xenograft mouse model. Consistent with the in vitro observations, loss of GNA13 expression in MCF-7 cells resulted in significantly larger tumors when injected into mammary fat pad of female mice (Fig. 3E). Taken together, these results provide further evidence to support Gα13 as a critical regulator of cell growth in ER+ cells, and that expression of GNA13 alone is sufficient to suppress proliferation in this group of breast cancer cells.
Fig. 3
Gα13 negatively impacts soft agar colony formation and in vivo tumorigenesis in ER+ breast cancer cells. A Soft agar colony formation in MCF-7 cells. MCF-7 cells, expressing control shRNA or that targeting GNA13 as indicated, were subject to soft colony formation assay as described in Experimental Procedures. Top: image showing colonies formed 21 days post seeding. Bottom: quantification of the number of colonies formed. B Soft agar colony formation in ZR-75-1 cells. ZR-75-1 cells expressing control shRNA or that targeting GNA13 as indicated, were subject to soft agar colony as in (A). Top: image showing colonies formed 21 days post seeding. Bottom: quantification of the number of colonies formed. C Soft agar colony formation in T47D cells. T47D cells, expressing vector alone or that harboring GNA13 as indicated, were subject to soft agar colony as in (A). Top: image showing colonies formed 21 days post seeding. Bottom: quantification of the number of colonies formed. D Soft agar colony formation assay in MCF-7 knockdown cells following reintroduction of GNA13. MCF-7 GNA13 knockdown cells, expressing vector alone or that harboring GNA13 as indicated, were subject to soft agar colony as in (A). Top: image showing colonies formed 21 days post seeding. Bottom: Quantification of the number of colonies formed. E Top: quantification of weight of tumors at the endpoint of in vivo tumor formation studies. Bottom: images of tumors post excision. For A–D, results shown are pooled data from three independent experiments. Plotted data is presented as mean ± SD, and p-values are denoted as: *, p < 0.05, **, p < 0.01, ***, p < 0.001, and ****, p < 0.0001 or ‘ns’ for ‘not significant’. All colony images are representative of three independent experiments. See Experimental Procedures for details
GNA13 suppresses MYC signaling in ER+ breast cancer cellsTo further investigate the mechanism of Gα13 involvement in the regulation of proliferation in ER+ breast cancer cells, we performed RNA-sequencing analysis on GNA13-high MCF-7 cells harboring either control shRNA or shRNA against GNA13, as well as on GNA13-low ER+ T47D, and ER- MDA-MB-231 and SKBR3 cells stably expressing either vector or GNA13. In the MCF-7 cells, geneset enrichment analysis using the GSEA platform (https://www.gsea-msigdb.org/gsea/msigdb/human/collections.jsp) revealed an upregulation of MYC signaling upon GNA13 knockdown (Fig. 4A, S2A). The E2F pathway, which is well known to be related to MYC signaling, was also elevated upon GNA13 knockdown (Fig. 4A). In agreement with the results in MCF-7, analysis of T47D cells revealed a suppression of MYC and E2F signaling pathways upon overexpression of GNA13 (Fig. 4B, S2B).
Fig. 4
RNA sequencing analysis of ER+ breast cancer cells reveal a connection between GNA13 expression and Myc-related signaling pathways. For all experiments, cells were harvested at 80% confluence and processed as described in Experimental Procedures. A RNA sequencing analysis of MCF-7 sh-Control cells and those in which GNA13 was silenced with sh-GNA13-2. Shown are the results of GSEA Hallmark analysis showing the top five pathways up-and downregulated upon GNA13 silencing. B RNA sequencing analysis of T47D expressing either vector or that harboring-GNA13. Shown are the results of GSEA Hallmark analysis showing top five pathways up-and downregulated upon GNA13 overexpression in T47D cells. C Results of GSEA GO analysis showing top pathways upregulated upon GNA13 knockdown in MCF-7 cells from (A). D Results of GSEA GO analysis showing top pathways downregulated upon GNA13 overexpression in T47D cells from (B). E RNA sequencing analysis of MDA-MB-231 expressing either vector or that harboring GNA13. Shown are the results of GSEA Hallmark analysis showing the top five pathways up-and downregulated upon GNA13 overexpression in MDA-MB-231 cells. F RNA sequencing analysis of SKBR3 expressing either vector or that harboring GNA13. Shown are the results of GSEA Hallmark analysis showing top pathways upregulated upon GNA13 overexpression in SKBR3 cells. Pathways highlighted in black represent MYC and related pathways. All pathways represented have nominal p-value < 0.05 and FDR < 0.25. All RNA sequencing experiments were performed in triplicate
Further enrichment analysis of the RNA-seq data using Gene Ontology was carried out to identify the biological processes and cellular components impacted by manipulation of GNA13 expression in these ER+ breast cancer cells. This analysis indicated that changes in GNA13 levels had significant impact on several Ribosome related pathways including RIBOSOME, RIBOSOME_BIOGENESIS and RRNA_PROCESSING (Fig. 4C and D). These findings increase the confidence on the impact of Gα13 on MYC signaling as MYC is one of the predominant drivers of the ribosome biogenesis program, which has been used as a common read-out as a major downstream consequence of alteration of MYC signaling. Reinforcing the notion that the impact of GNA13 is more significant on ER+ cells, GSEA analysis on ER- MDA-MB-231 and SKBR3 cells showed no consistent MYC signature upon GNA13 expression (Fig. 4E). The analysis on MDA-MB-231 cells, however, indicated that GNA13 may be a driver for inflammatory response and Epithelial Mesenchymal Transition (Fig. 4E), in line with our previous findings that suggest Gα13 involvement in NFκB signaling in TNBC [22] and prostate cancer cells [21]. The analysis of SKBR3 similarly suggested that GNA13 overexpression mainly affects inflammatory response pathways, with minor effect on MYC signaling (Fig. 4F), consistent with the notion that Gα13 exerts proliferative effect mainly on ER+ cells. In summary, the comparative analysis of top altered pathways upon manipulation of GNA13 expression in four different breast cancer cell lines (MCF-7, T47D, MDA-MB-231 and SKBR3) indicated that Gα13 regulation of MYC signaling, particularly ribosomal biogenesis is unique to ER+ cell (Fig. S2C, highlighted in red).
Gα13 regulates MYC expression in ER+ breast cancer cellsAfter the identification of MYC associated pathway signature from the RNA-seq data, we evaluated the expression of the MYC oncogene and found that its expression is significantly increased upon GNA13 silencing in MCF-7 cells (Fig. S3A). Validation study confirmed that both the transcript levels (Fig. 5A and C) and protein levels (Fig. 5B and D) are elevated upon GNA13 knockdown in GNA13-high—MCF-7 and ZR-75-1 cells, consistent with the findings from RNA-sequencing analysis. In addition, we found that the changes in the Myc levels also translates into the changes in Myc activity, as consistent changes are observed in Myc downstream pathways and genes (Supplementary Fig. S3B, C). In GNA13-low T47D cells, we also found that overexpression of GNA13 results in the selective suppression of the smaller MYC isoform (Fig. S3D), which, of the two isoforms has been shown to be predominantly responsible for oncogenic and proliferative properties of the MYC oncogene [35, 36].
Fig. 5
Gα13 suppresses the expression of MYC, and loss of MYC reverses the proliferative phenotype observed upon GNA13 silencing in ER+ breast cancer cells. A MYC mRNA levels in MCF-7 cells upon GNA13 silencing, RNA levels were assessed by real-time PCR; relative mRNA expression plotted as fold-change to control cells (sh-GNA13-2 compared to sh-control), HPRT was used a normalizing control. B Immunoblot showing the expression of MYC upon GNA13 silencing in MCF-7 cells. C MYC mRNA levels in ZR-75-1 cells upon GNA13 silencing, RNA levels were assessed as in (A). D Immunoblot showing the expression of MYC upon GNA13 knockdown in ZR-75-1 cells. E Immunoblot showing Gα13 and MYC levels in MCF-7 cells (sh-Control and sh-GNA13-2) with or without silencing of MYC. F proliferation of ER+ MCF-7 cells in (E) as determined by confluence measurements using the live cell imaging platform IncuCyte®. G Immunoblot showing Gα13 and MYC levels in ZR-75-1 cells (sh-Control and sh-GNA13-2) with or without silencing of MYC. H Proliferation of ER+ ZR-75-1 cells in (G). Results shown are pooled data from three independent experiments. Plotted data is presented as mean ± SD, and p-values are denoted as: *, p < 0.05, **, p < 0.01, ***, p < 0.001, and ****, p < 0.0001 or ‘ns’ for ‘not significant’. All immunoblots are representative of three independent experiments. See Experimental Procedures for details
To investigate whether the increase in MYC mediates the effect on proliferation upon GNA13 knockdown, we assessed the effect of concurrent silencing of MYC and GNA13 on cell proliferation in GNA13-high MCF-7 and ZR-75-1 cells. As shown earlier, GNA13 knockdown alone led to elevated MYC protein levels (Fig. 5E and G) and increased proliferation (Fig. 5F and H). Concurrent MYC knockdown significantly reversed the increase in proliferation brought on by silencing of GNA13 in both MCF-7 (Fig. 5F) and ZR-75-1 (Fig. 5H) cells. Together, these results demonstrate that Gα13 controls MYC-regulated processes by modulating MYC expression, through which Gα13 plays a significant role in proliferation.
Gα13 regulation of MYC expression is ERα dependent, which accounts for this ER+ specific regulation of proliferationSo far, both RNA-seq and phenotypic assays on multiple cell lines suggest that the Gα13-MYC signaling mechanism is specific to ER+ breast cancer cells, which raises the possibility of the involvement of estrogen and/or estrogen receptor-dependent regulation in this novel Gα13-MYC signaling axis. As a major oncogene, MYC expression is regulated at transcriptional, post transcriptional and translational levels across all subtypes of breast cancers [37]. In ER+ cells, MYC expression is reported to be predominantly driven by estrogen signaling [38, 39] and the MYC gene is a direct transcriptional target of ESR1 (ERα) [40]. In this regard, additional analysis of our RNA-sequencing data from MCF-7 consistently revealed the upregulation of several estrogen signaling related pathways upon GNA13 silencing (Fig S4A, B) and MYC was one of the most significantly upregulated estrogen response targets in MCF-7 cells impacted by GNA13 (Fig. S4C). Further, transcription factor analysis of the genes contributing to the estrogen signature revealed a significant overlap with known MYC targets (Fig S4D). Based on the data, the possibility is raised on whether Gα13 regulation of MYC is mediated by ESR1, which would fit with the Gα13 effect on proliferation being limited to ER+ cells.
We then directly assessed the impact of GNA13 knockdown on ESR1 (ERα) expression and the role of ERα in MYC expression observed upon GNA13 loss in GNA13-high MCF7 cells. As described above, knockdown of GNA13 led to an increased expression of MYC in both cell lines. Interestingly, concurrent silencing of ESR1 expression was sufficient to abrogate the increase in MYC expression observed from GNA13 knockdown (Fig. 6A). A similar phenomenon was observed in ZR-75-1 cells (Fig. 6B). This reversal of MYC expression by suppressing ESR1 provides strong evidence for the ERα-dependence in the regulation of MYC by Gα13.
Fig. 6
Increased levels of MYC observed upon GNA13 loss is context dependent. A Immunoblot showing the levels of MYC upon ESR1 silencing in MCF-7 sh-Control and sh-GNA13 cells. B Immunoblot showing the levels of MYC upon ESR1 silencing in ZR-75-1 sh-Control and sh-GNA13 cells. C Immunoblot showing estradiol dependent induction of MYC in MCF-7 cells, MCF-7 cells were deprived of estradiol by treating in Charcoal-Stripped FBS media for 72 h, and then stimulated with either 1 nM E2 in presence or absence of 100 nM fulvestrant for 6h. D Immunoblot showing estradiol dependent induction of MYC expression in ZR-75-1 cells, ZR-75-1 cells were deprived of Estradiol by treating in Charcoal-Stripped FBS media for 48 h, and then stimulated with either 1 nM E2 in presence or absence of 100 nM fulvestrant for 6h. E Immunoblot showing the levels of MYC in MCF-7 cells (sh-Control, sh-GNA13-1, shGNA13-2) cells upon estrogen signaling inhibition using 100 nM Fulvestrant for 4h. F Immunoblot showing the levels of MYC in ZR-75-1 cells (sh-Control, sh-GNA13-1, sh-GNA13-2) cells upon estrogen signaling inhibition using 100 nM Fulvestrant for 24h.For immunoblots, results shown are representative of three independent experiments
To delineate between ligand dependent and independent ERα signaling in these ER+ cells, we also studied the regulation of MYC by Gα13 in sterol deprived conditions, followed by addition of estradiol (E2). We found that, in the absence of E2, both ERα and MYC expression are induced when GNA13 is silenced, albeit the induction of MYC is at a more subdued level (Fig. 6C). The expression of ERα increased at comparable level as in the normal growth medium (Fig. 6C compared to Fig. 6A), which suggests that Gα13 regulation of ERα expression is largely ligand independent (Fig. 6C). Under E2 treatment, the expression of MYC was significantly greater than in sterol deprived media and appears to be at comparable level to that in the normal medium (Fig. 6C compared to Fig. 6A), suggesting a critical role of upstream estrogen signaling in regulating MYC in these cells. Noteworthy, loss-of-GNA13 still had significant effect on MYC expression. Further evaluation with ERα antagonist fulvestrant added to the sterol-depleted medium demonstrate complete loss of MYC induction upon GNA13 knockdown suggesting a dependency on ligand stimulated ERα in this regulation; and it appears likely that GNA13 and ERα work together to regulate MYC in these cells. Under estradiol stimulation, the levels of ERα as well as its induction on GNA13 knockdown are more subdued than that in the absence of E2 (Fig. 6C). The tapered level of ERα in the presence of E2 is consistent with the understanding that ligand binding of ERα leads to its polyubiquitination and degradation.
The above observations held true for the ER+ ZR-75–1 cells as well, in all of the important aspects as observed in MCF7 cells (Fig. 6D). First, loss of GNA13 led to an increase in ERα and MYC in all treatment conditions; second, the presence of E2 tapers the ERα level while further inducing the MYC level. Ligand binding to activate the receptor appears to induce a more pronounced induction of MYC as compared to the slight induction in the absence of ligand. This supports the notion that this GNA13-ERα-MYC axis of regulation of proliferation is a broader feature of ER+ cells.
Our results suggest that the levels of ligand present in normal medium (containing FBS) is sufficient to significantly induce MYC expression and the ensuing proliferation in these ER+ cells (Fig. 6A and B). To further evaluate this, we also compared the expression of ERα and MYC in normal FBS containing medium with and without the addition of the antagonist fulvestrant to observe the dependency on ERα activation for the induction of MYC expression by GNA13 knockdown. Fulvestrant reduces both the baseline and the induction of ERα expression from GNA13 knockdown, leading to the inhibition of basal and induced MYC expression, suggesting estrogen signaling is the predominant pathway responsible of MYC expression in normal medium as well (Fig. 6E and F).
Taken together, our findings demonstrate that ERα regulates MYC expression, and that the impact of Gα13 on MYC expression is, for the most part, driven through the E2-ERα signaling axis. In both MCF-7 and ZR-75-1 cells, the results from the treatments under both normal growth, sterol deprived, E2 stimulated and fulvestrant inhibited conditions allow us to conclude that Gα13 regulation of MYC expression is dependent on ERα. The activation of ERα by agonist further enhances the promotion of MYC expression and the inactivation of ERα by antagonist abrogates the induction of MYC. We therefore speculate that the ER+ subtype specific impact on proliferation and induction of MYC by GNA13 lies in the ability of the ERα receptor activation by ligand present in the normal media and in the circulation in vivo.
留言 (0)