
記住我
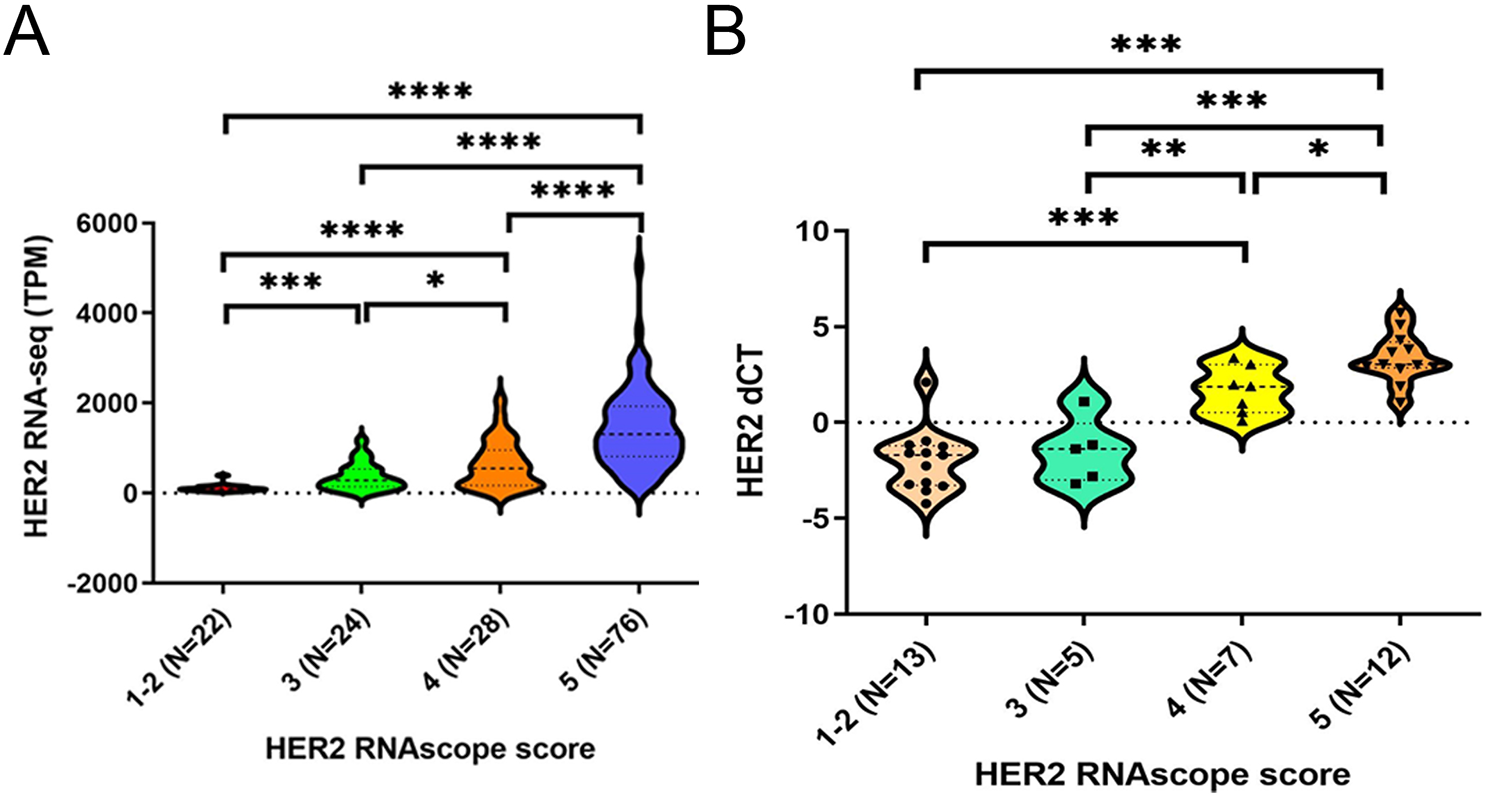
To determine whether HER2 RNAscope scoring could be used for the semiquantitative analysis of isHRE, we initially evaluated the correlation between HER2 RNAscope scores and HER2 RNA expression determined by RNA-seq in 150 BC cases. We observed significantly higher HER2 RNA expression in patients with scores of 5 versus 4, 4 versus 3, and 3 versus 1 and 2 (1–2), respectively (Fig. 1A). Similarly, HER2 RNA expression determined by qRT-PCR was shown as dCT (CtGAPDH – CtHER2) in additional 37 BCs ranging from HER2 IHC 0 to 3 + and was significantly higher in cases with a score of 5 versus 4 and 4 versus 3 (Fig. 1B). However, the difference between the scores of 3 and 1–2, did not reach statistical significance. These findings demonstrated an overall positive correlation between HER2 RNAscope scores and RNA expression levels, validating RNAscope scoring as a semiquantitative method for evaluating isHRE.
Fig. 1
Validation of HER2 RNAscope scoring as a semiquantitative method to evaluate the isHRE. Violin plots denoting the transcripts per million (TPM) value of HER2 gene expression by RNA-seq (A) and the dCT value by qRT-PCR (B) among BCs with HER2 RNAscope scores 1–2, 3, 4, and 5. dCT was calculated as (CtGAPDH – CtHER2). *p < 0.05, **p < 0.01, ***p < 0.001, and ****p < 0.0001
Patients characteristicsAmong the 278 HER2-positive BCs used for HER2 RNAscope, 43 cases had scores ≤ 2 and received further RNAscope for PPIB. Four patients had a PPIB score of 1 and were considered to have degraded RNA. Four cases showed clear clonal (zonal) heterogeneous RNAscope signals. These eight cases were excluded from subsequent analysis. A total of 270 patients were included for further analysis. The kappa coefficient of the HER2 RNAscope scores for the 270 cases between the two reviewers was 0.808 (p < 0.001). Details of the clinicopathological and treatment features are summarized (Supplementary Table S2). HR was positive and negative in 50.4% and 49.6% of the patients, respectively. HER2 IHC 3 + and 2+/FISH + were observed in 79.3% and 20.7% of the patients, respectively. Mono (H) and dual (H and P) anti-HER2 blockade was performed in 46.3% and 53.7% of the patients, respectively. The overall pCR rate was 40.7%.
Positive correlation of isHRE with pCR ratesTo investigate the effect of isHRE on anti-HER2 therapeutic efficacy, we analyzed the relationship between HER2 RNAscope scores and pCR rates in 270 patients with HER2-positive BC who received NCTT. The pCR rate was 66.7% in patients with BCs with a score of 5, which was significantly higher than the rates of 0%, 6.3%, 18.8%, and 21.6% in patients with BCs with scores of 1, 2, 3, and 4, respectively (Fig. 2A). The difference in pCR rates was significantly higher in cases with a score of 5 versus scores of 1–4 (66.7% versus 15.9%, p < 0.0001) (Fig. 2B). Conversely, patients who achieved pCR had significantly higher scores than those without pCR (Fig. 2C). Representative images demonstrating HER2 RNAscope scoring and the corresponding IHC and FISH results are shown (Fig. 2D and E). This finding demonstrated a positive correlation between HER2 RNAscope scores and pCR rates, with significantly higher pCR rates in patients with BCs with scores of 5 versus score 1–4.
Fig. 2
Correlation between HER2 RNAscope scores and pCR rates in the 270 patients with HER2-positive BCs receiving NCTT, and representative images of HER2 and PPIB RNAscope scores with corresponding HER2 IHC and FISH. Barplots of the pCR rates in patients stratified by HER2 RNAscope scores 1–5 (A) and 1–4 versus 5 (B). (C) Dotplot denoting HER2 RNAscope scores in patients with or without pCR. Mean is shown as red line. (D) Representative BCs with HER2 RNAscope score 1, 2, 3, 4 or 5 (upper panel), with corresponding control PPIB RNAscope scores (middle panel), HER2 IHC (lower panel) and HER2 FISH (inset in lower panel). (E) A representative case of HER2 RNAscope (left panel), IHC (middle panel) and FISH (right panel) is shown. Star, non-neoplastic mammary duct. ****p < 0.0001
Positive impact of isHRE on pCR rates in HER2-positive IHC/FISH categoriesTo assess the HER2 RNA expression in HER2 IHC 3 + and 2+/FISH + BCs, the two HER2-positive IHC/FISH categories, we analyzed their HER2 RNAscope scores and TPM values. We observed significantly higher RNAscope scores and TPM values in HER2 IHC 3 + cells than in IHC 2+/FISH + BCs (Fig. 3A and B). Notably, a wide range of RNAscope scores and TPM values was observed, particularly in HER2 IHC 3 + BCs, suggesting heterogeneous HER2 RNA expression even within the same HER2-positive IHC category. Next, we investigated the effects of isHRE on pCR rates in various HER2-positive IHC/FISH categories. The pCR rate was significantly higher in patients with IHC 3 + than in those with IHC 2+/FISH + BCs (Fig. 3C), and the RNAscope score was significantly higher in patients with IHC 3 + than in those with IHC 2+/FISH G1-3 BCs (Fig. 3D and Supplementary Table S3). When patients were stratified by RNAscope scores, we observed a positive correlation between pCR rates and RNAscope scores in both IHC categories (Fig. 3E), with the difference in pCR rates particularly evident when cases were stratified by scores of 5 and scores of 1–4 (Fig. 3F). Reciprocally, patients who achieved pCR had significantly higher HER2 RNAscope scores in both IHC categories (Fig. 3G). Because all 214 HER2 3 + BCs samples underwent additional FISH tests, we further investigated the pCR rates and RNAscope scores among the various FISH groups in both IHC categories. The pCR rates and RNAscope scores were numerically higher in patients with BC with IHC 3+/FISH G1 and G3 than in those with IHC 2+/FISH G1 and G3 (Fig. 3H and I). Patients with IHC 3+/FISH G4 and G5 had significantly lower RNAscope scores than those with IHC 3+/FISH G1, and none of these patients achieved pCR. These results demonstrated the positive effect of isHRE on pCR rates within the HER2-positive IHC/FISH categories.
Fig. 3
Correlation of HER2 RNAscope scores and pCR rates among HER2 IHC/FISH categories in the 270 patients with HER2-positive BCs receiving NCTT. Dotplots denoting the disctribution of HER2 RNAscope scores (A) and HER2 RNA-seq TPM (B) among the two HER2-positive BC groups. Barplot and dotplot denoting the pCR rates (C) and HER2 RNAscope scores (D), respectively, among each HER2-positive IHC/FISH category. Barplots denoting the pCR rates among HER2-positive IHC/FISH categories stratified by HER2 RNAscope scores (1–2, 3, 4, and 5) (E) or (1–4 and 5) (F). G Dotplot showing HER2 RNAscope scores in patients with or without pCR among the HER2-positive IHC/FISH categories. Barplot and dotplot denoting the pCR rates (H) and HER2 RNAscope scores (I), respectively, among cases with IHC 2 + or IHC 3 + stratified by FISH result. Mean is shown in red line. *p < 0.05, **p < 0.01, ***p < 0.001, and ****p < 0.0001
isHRE and pCR rates showing similar non-linear positive correlation with both HER2 copy numbers and HER2/CEP 17 copy number ratiosNext, we investigated the correlation of HER2 FISH parameters, namely HER2 and CEP17 copy numbers and HER2/CEP17 copy number ratios, with isHRE and pCR rates in all 239 HER2 FISH G1 cases. We observed a non-linear positive correlation between HER2 RNAscope scores and HER2 copy numbers: with scores significantly lower in cases with copy number 4–6 ( ≧ 4, < 6) versus 6–9, but not significantly different between those with copy number 12–16 and ≧ 16 (Fig. 4A). The correlation of HER2 copy number groups with pCR rates showed a pattern similar to that of the HER2 RNAscope scores (Fig. 4B). Consistently, we observed significantly higher pCR rates in BC cases with RNAscope scores of 5 versus 1–4, among all HER2 copy number categories (Fig. 4C). CEP17 amplification, defined as CEP17 copy number ≧ 3 [23], correlated with higher RNAscope scores (Fig. 4D), but corresponding pCR rates were not significantly different between those with or without CEP17 amplification (Fig. 4E). However, an RNAscope score of 5 significantly correlated with higher pCR rates, both in cases with and without CEP17 amplification (Fig. 4F). The correlation of both RNAscope scores and pCR rates with HER2/CEP17 copy number ratios showed patterns similar to those of HER2 copy numbers (Fig. 4G-H). Similarly, significantly higher pCR rates were observed in cases with a score of 5 versus scores of 1–4 in all four ratio groups (Fig. 4I). Together, these findings demonstrate the positive impact of isHRE on the non-linear positive correlation between pCR rates and HER2 copy numbers as well as HER2/CEP17 copy number ratios.
Fig. 4
Correlation of HER2 RNAscope scores and pCR rates with HER2 copy numbers, CEP17 copy numbers and HER2/CEP17 copy number ratios in the 239 patients with HER2 FISH G1 BCs. Dotplot and barplot denoting the HER2 RNAscope scores (A) and pCR rates (B), respectively, among BC cases stratified by HER2 copy numbers in the range of 4–6 ( ≧ 4, < 6), 6–9, 9–12, 12–16, and ≧ 16. C Barplot showing the pCR rates of BC cases stratified by HER2 RNAscope scores (1–4 versus 5) within each HER2 copy number range. Dotplot and barplot denoting the HER2 RNAscope scores (D) and pCR rates (E), respectively, among BC cases stratified by CEP17 copy number of 3. F Barplot showing the pCR rates of BC cases stratified by HER2 RNAscope scores (1–4 versus 5) in BC cases with CEP17 copy number < 3 or ≧ 3. Dotplot and barplot denoting the HER2 RNAscope scores (G) and pCR rates (H), respectively, among BC cases stratified by HER2/CEP17 copy number ratios in the range of 2–3 ( ≧ 2, < 3), 3–5, 5–8, and ≧ 8. I Barplot showing the pCR rates of BC cases stratified by HER2 RNAscope scores (1–4 versus 5) within each HER2/CEP17 copy number ratio range. *p < 0.05, **p < 0.01, ***p < 0.001, and ****p < 0.0001
Positive impact of isHRE on pCR rates within HR categoriesNext, we investigated the effect of isHRE on pCR rates within the HR categories. Patients with BCs negative for ER, PR, or HR had significantly higher pCR rates than those with BCs positive for ER, PR, or HR, with the highest and lowest pCR rates in patients with ER/PR double-negative and double-positive BCs, respectively, supporting the negative impact of HR on pCR rates (Fig. 5A). We further observed significantly higher HER2 RNAscope scores in HR- versus HR + BCs (Fig. 5B), and significantly higher pCR rate in cases with RNAscope score 5 versus score 1–4 BCs in both HR+ (55.3% vs. 11.6%, p < 0.0001) and HR- (72.9% vs. 25.6%, p < 0.0001) cases (Fig. 5C). Compared with HER2 RNAscope scoring, HER2 status determined by HER2 IHC/FISH did not stratify HR + or HR- BC patients, with a significant difference in the pCR rates (Fig. 5D). Together, these findings demonstrated the positive effect of isHRE on pCR rates in both HR- and HR + BC patients.
Fig. 5
Correlation of pCR rates and HER2 RNAscope scores within HR categories in the 270 patients with HER2-positive BCs receiving NCTT. (A) Barplot denoting the pCR rates among various HR status, with HR + defined as ER + and/or PR+, and HR- as ER- and PR-. (B) Dotplot denoting the HER2 RNAscope scores among HR- and HR + BCs. Barplot denoting the pCR rates among HR- and HR + BCs patients stratified by HER2 RNAscope scores (score 1–4 versus 5) (C) or by HER2 IHC (IHC 2+/FISH + versus 3+) (D). n.s., not significant. *p < 0.05, **p < 0.01, ***p < 0.001, and ****p < 0.0001
Factors associated with pCR on multivariate analysis and their combinational impact on the pCR ratesUnivariate and multivariate analyses were performed to identify the clinicopathological factors associated with pCR. The results are summarized in Table 1. In multivariate analysis, an HER2 RNAscope score of 5 remained a significant and strong pCR predictor [odds ratio (OR) = 10.865, p < 0.001]. HR (OR = 1.907, p = 0.045), TIL ≧ 20% (OR = 2.057, p = 0.031), and anti-HER2 dual blockade (OR = 2.178, p = 0.018) were also significantly associated with higher pCR rates. We further investigated the combined effect of HER2 RNAscope, HR, and anti-HER2 blockade on pCR rates (Table 2). Overall, patients with HR-/score 5 BCs receiving dual blockade (dual/HR-/score 5) had the highest pCR rate (80.8%), compared to the much lower pCR rates of 10.3%, 12.5%, and 16.7% in patients with mono/HR+/score 1–4, dual/HR+/score 1–4 and mono/HR-/score 1–4 BCs, respectively. Cases with HR- BCs had significantly higher pCR rates than those with HR + BCs when receiving anti-HER2 dual blockade (64.9% vs. 22.1%, p < 0.001). Compared to patients receiving anti-HER2 mono blockade, patients receiving anti-HER2 dual blockade had significantly higher pCR rates only for HR- BCs (64.9% vs. 45.1%, p = 0.030), or score 5 BCs (72.9% vs. 55.3%, p = 0.040), or HR-/score 5 BCs (80.8% vs. 60.6%, p = 0.041). In contrast, cases with a score of 5 BCs had significantly higher pCR rates than those with score of 1–4 BCs irresspective of HR or anti-HER2 blockade status (all p < 0.003). In contrast to RNAscope scores of 5 versus 1–4, patients with BC HER2 status determined by IHC 3 + versus IHC 2+/FISH + did not have significantly different pCR rates, regardless of the combined status of HR and anti-HER2 blockade. These findings supported a HER2 RNAscope score of 5 as a significant and strong predictor of pCR.
Table 1 Univariate and multivariate logistic regression model for pCR according to clinicopathological and treatment factorsTable 2 Impact of combination of multivariate analysis-derived pCR predictors on pCR rates of the 270 patients with HER2-positive BCs receiving NCTTPositive impact of isHRE on the pCR rates within the NCTT treatment subgroupsFinally, we investigated the effect of isHRE on pCR rates in the NCTT treatment subgroups. We observed significantly higher pCR rates in patients receiving TH(P) versus EC(F) to TH(P) (55.8% vs. 35.4%, p = 0.048) or TH(P) to EC(F) (55.8% vs. 35.5%, p = 0.039) (Fig. 6A), however, the HER2 RNAscope scores were not significantly different between these subgroups (Fig. 6B), suggesting that the difference in the pCR rates was not attributed to isHRE. Nevertheless, within each NCTT subgroup, significantly higher pCR rates were observed in patients with a score of 5 versus 1–4 BCs (Fig. 6C), and patients achieving pCR had higher scores than those without (Fig. 6D), which is consistent with the impact of isHRE on pCR rates. Because patients in the TH(P) subgroup had higher rates of anti-HER2 dual blockade (Supplementary Table S4), we further stratified the patients based on the status of anti-HER2 blockade and HER2 RNAscope scores. In all four NCTT subgroups, we observed consistently higher pCR rates in patients with a score of 5 versus score of 1–4 BCs irrespective of the anti-HER2 blockade status (Fig. 6E). In contrast, a significantly higher pCR rate was observed in patients receiving dual versus mono anti-HER2 blockade only when they had BCs with a score of 5 (78.1% vs. 55.9%, p = 0.009). These findings confirmed the positive impact of isHRE on pCR rates in all four NCTT subgroups and demonstrated that the impact of dual versus mono blockade may depend on the isHRE status.
Fig. 6
The pCR rates and the impact of HER2 RNAscope score and anti-HER2 mono/dual blockade on the pCR rates on the four NCTT treatment patient subgroups. Barplot and dotplot denoting the pCR rates (A) and HER2 RNAscope scores (B), respectively, among the four NCTT subgroups. Barplot and dotplot showing the pCR rates (C) and HER2 RNAscope scores (D) of BC cases among patients of the four NCTT subgroups. (C) is stratified by HER2 RNAscope score while (D) is stratified by pCR. (E) Barplot denoting the pCR rates of patients stratified by HER2 RNAscope (score 1–4 versus 5) and anti-HER2 mono/dual blockade. *p < 0.05, **p < 0.01, ***p < 0.001, and ****p < 0.0001
留言 (0)