Study population
We used data from two large-scale prospective cohorts of registered female nurses in the United States, the NHS and NHSII. NHS (established in 1976) recruited 121,701 women between ages 30 and 55 years and NHSII (initiated in 1989) enrolled 116,429 women between ages 25 and 42 years. In both cohorts, participants completed an initial study questionnaire and subsequent questionnaires biennially afterward; cumulative follow-up rates were greater than 90% [7]. As described previously [8], invasive breast cancer cases were identified initially by questionnaire (start of follow-up to 2012) or National Death Index search upon lack of participant response; breast cancer cases were confirmed by centralized medical record review using established protocols. No breast cancer cases included in our analysis had any prior personal history of cancer. Completion of the questionnaire was considered to imply informed consent upon study protocol approval by the Institutional Review Boards of the Brigham and Women's Hospital (Boston, MA) and Harvard T.H. Chan School of Public Health (Boston, MA) in 1976 (NHS) and 1989 (NHSII). NHSI/II were conducted in accordance with recognized ethical guidelines (Declaration of Helsinki).
Gene expression measurements
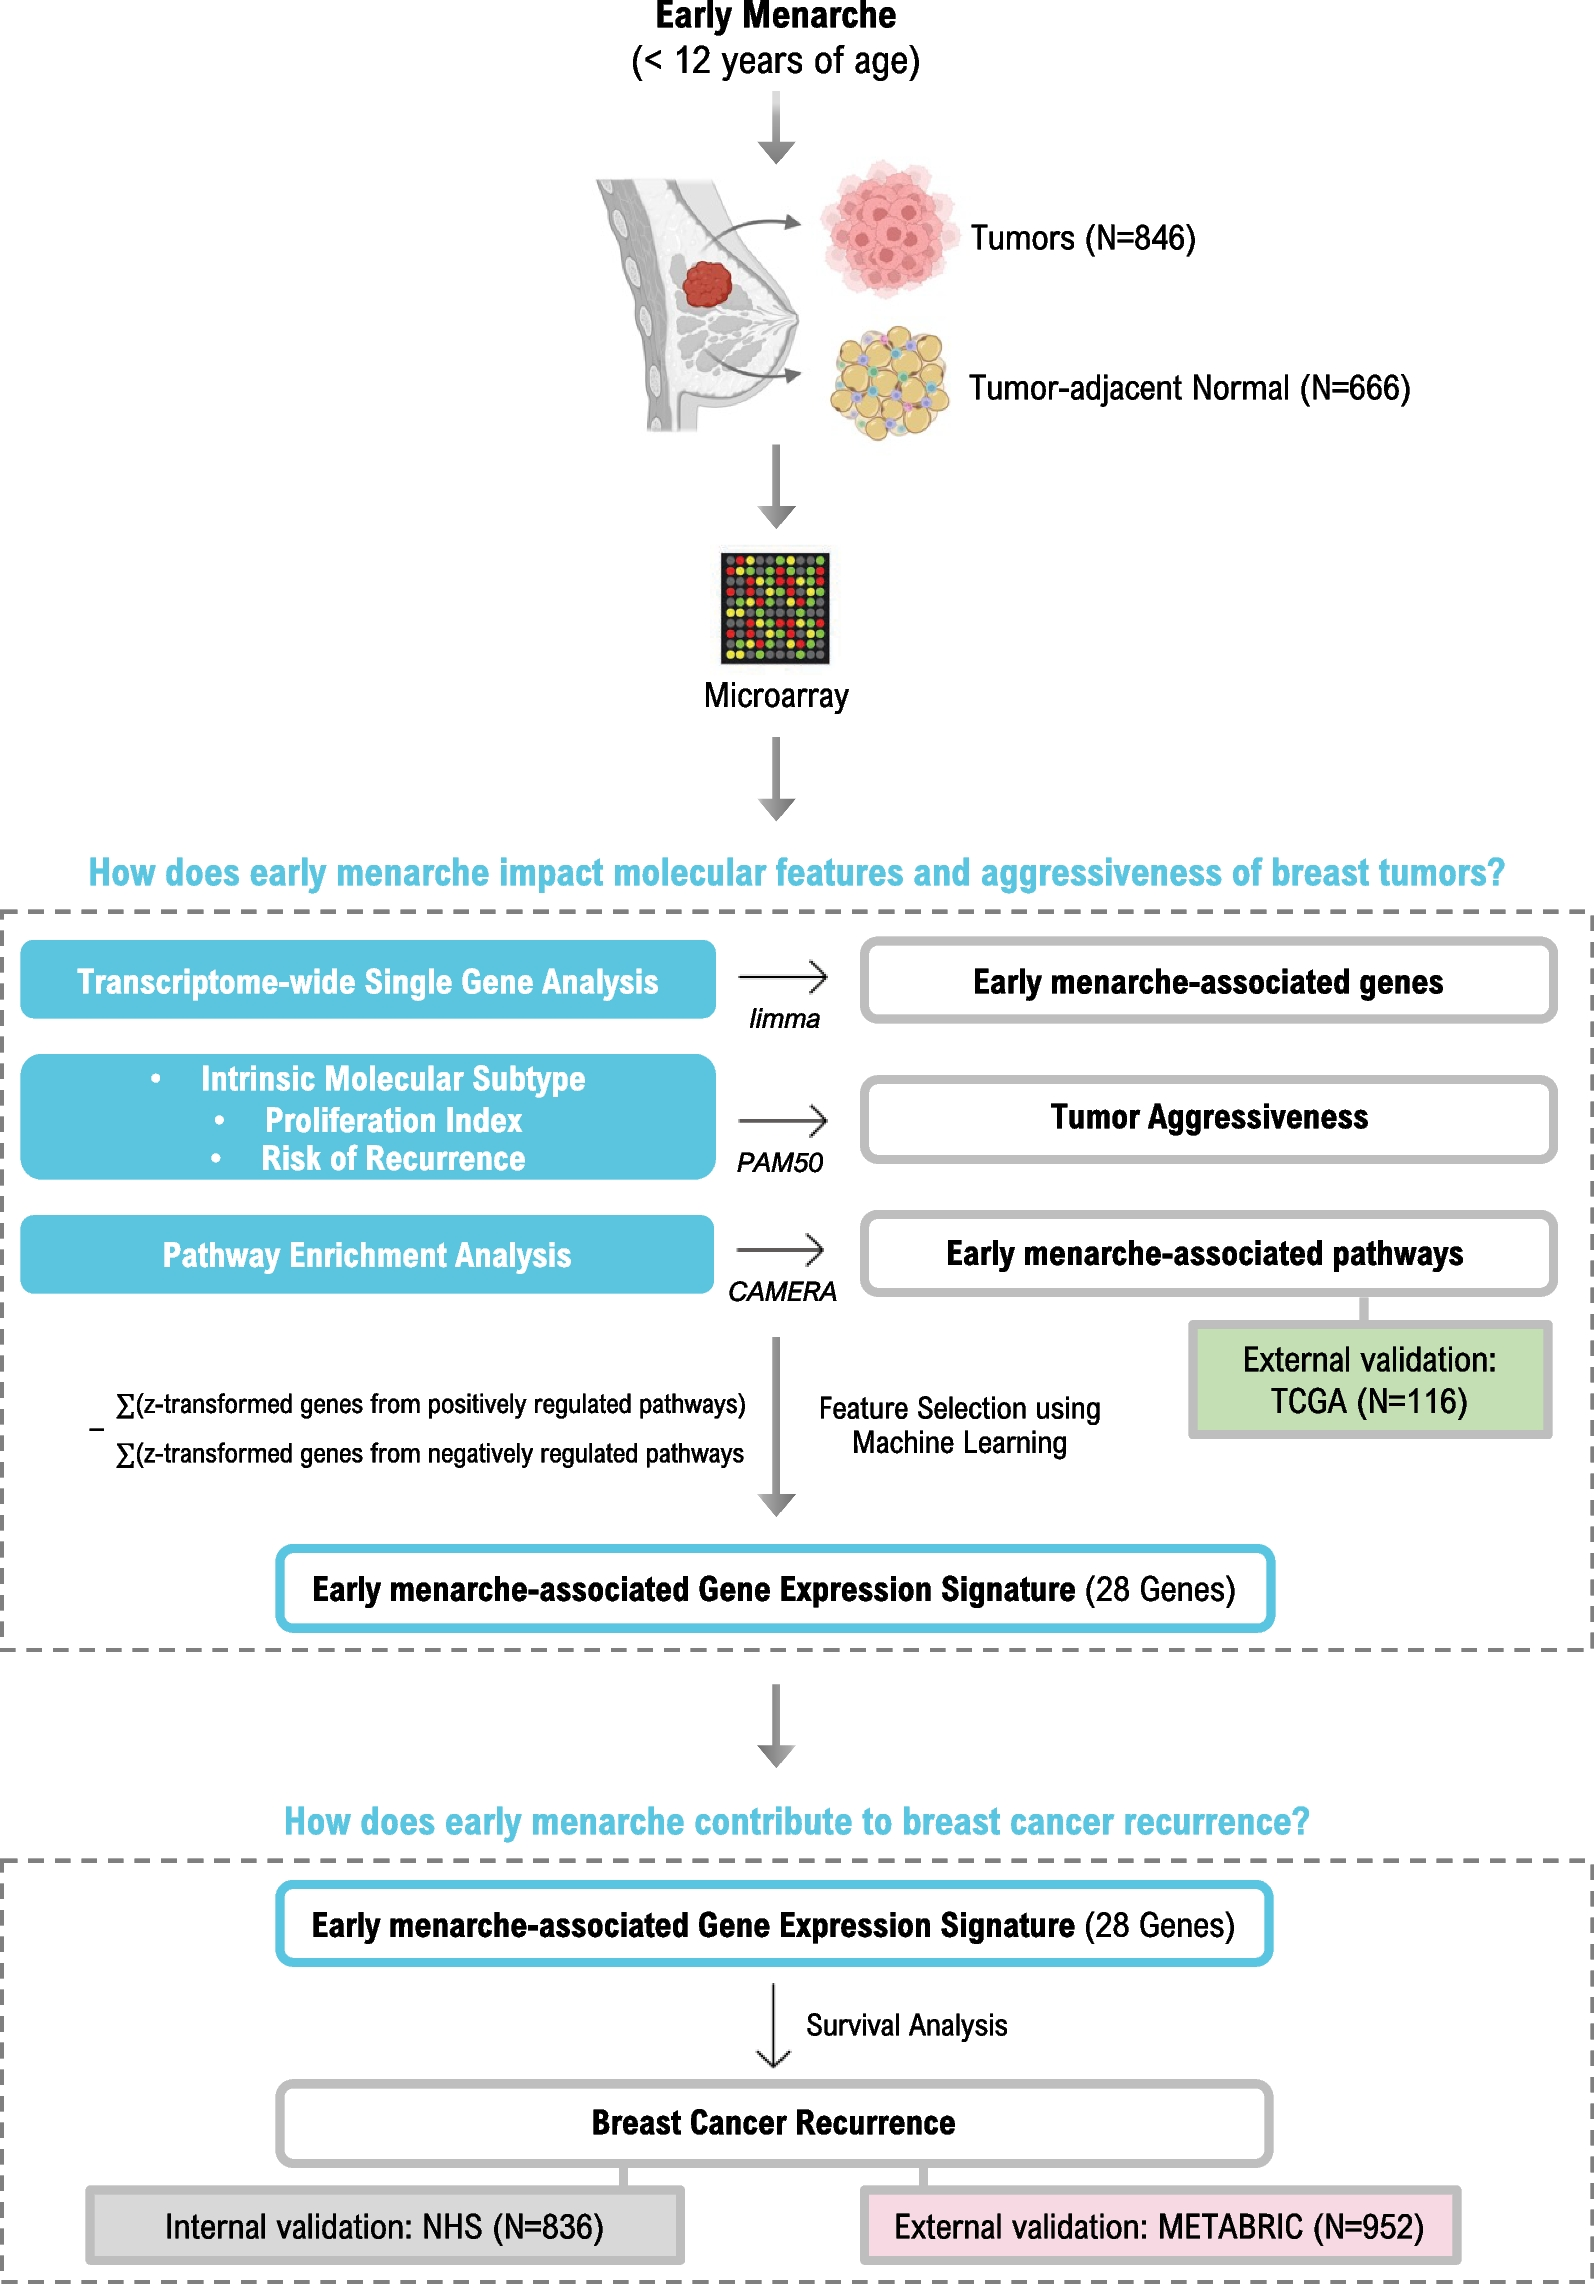
954 incident breast cancer cases within the study were eligible for transcriptomic analysis [10], which had participant characteristics similar to those without gene expression data. RNA was extracted from multiple cores of 1 or 1.5 mm procured from FFPE tumor (n = 1–3 cores) and matched normal adjacent tissue taken from > 1 cm from the tumor margin during surgery (n = 3–5 cores) and isolated using the Qiagen AllPrep RNA Isolation Kit. Transcriptome-wide gene expression was profiled using Affymetrix Glue Grant Human Transcriptome Array 3.0 (hGlue 3.0) and Human Transcriptome Array 2.0 (HTA 2.0) microarray chips. Normalization was performed using robust multiarray averages. Data was log-2-transformed and Affymetrix Power Tools probeset summarization-based metrics were used for quality control. After quality control and exclusion based on missing data, 846 tumor and 666 normal-adjacent tissues were used in this analysis. Gene expression data was deposited in Gene Expression Omnibus and is publicly available (GEO#; GPL22920, GSE93601, GSE115577). Of note, participant characteristics of breast cancer cases with and without gene expression were similar [11]. The most variable probe was selected to represent the gene when genes were mapped by multiple probes. ComBat, which is an empirical Bayes method for batch effects, was used to control for technical variabilities [12]. Genes with expression in the lowest quartile (< 25%) were excluded from the analyses.
Exposure and covariates
Age at menarche (age in years) and height (measured in feet and inches) were reported on the baseline study questionnaire. Weight at age 18 was reported during 1980 questionnaire cycle for NHSI and baseline study questionnaire for NHSII. Race was reported during 1992 questionnaire cycle for NHSI and baseline study questionnaire for NHSII. History of oral contraceptive use, menopausal status, parity, age at breast cancer diagnosis, calendar year of breast cancer diagnosis, weight and physical activity level at time of diagnosis were obtained via the biennial NHS and NHSII questionnaires. BMI was calculated by dividing the participant’s weight in kilograms by their height in meters squared (kg/m2). Tumor characteristics (stage and grade), treatment information (chemotherapy, radiotherapy, and endocrine therapy) were obtained from medical records or supplemental questionnaire. Estrogen receptor (ER) status was determined after central review of breast cancer tissue microarrays (TMAs), or pathology reports if missing. Based on previous literature, we defined early menarche as menstruation occurring before age 12, the median age at menarche in the U.S [9]. Therefore, age at menarche, our primary exposure, was dichotomized and modeled as a categorical variable of “early” (< 12 years old) vs. “later” (≥ 12 years old). Our analyses were restricted to complete cases that included the following covariates, selected a priori: age at breast cancer diagnosis (continuous), year of diagnosis (continuous), tumor stage (1–4), chemotherapy (yes/no/unknown), radiation (yes/no/unknown), endocrine therapy (yes/no/unknown), oral contraceptive use (current user/past user/never user/unknown), race (White/non-White), parity (continuous), BMI at age 18 (continuous), BMI change (BMI at diagnosis – BMI at age 18), and physical activity at time of diagnosis (continuous). Within our analytic cohort with gene expression measurements, 52 cases were excluded from analysis due to missing information on age at menarche; missing BMI and physical activity data were imputed using the median. Secondary analyses were also performed modeling age at menarche as continuous.
Breast cancer recurrence
Breast cancer recurrences were determined as previously described [13]. Briefly, supplemental questionnaires were sent to living cohort members with a previously confirmed diagnosis of breast cancer. Reports of new cancers of the liver, bone, brain, and lung—common sites of breast cancer metastasis—following their breast cancer diagnosis were considered breast cancer recurrences. Participants who died from breast cancer without previous report of recurrence were also presumed to have a breast cancer recurrence. The time scale of disease-free survival is thus defined as the time from initial diagnosis to either recurrence or end of follow-up, with participants who died of other causes censored at time of death. Deaths were most commonly reported by families, and deaths among nonrespondents were identified through the National Death Index, as is consistent in previous NHS analyses [14]. Once a death was reported, the specific cause was subsequently determined by medical record review or death certificate.
Statistical analysisAge at menarche and gene expression
We evaluated the association between age at menarche with transcriptome-wide gene expression for each individual gene using covariate-adjusted linear regression (limma) [15]. Each regression model was adjusted for confounders determined a priori and surrogate variables generated from the transcriptome data (the leek method from Bioconductor sva package in R) [16]. Analyses were performed on tumor and tumor-adjacent tissues separately. Subgroup analyses stratified on ER-status based on the tumor. We used an FDR ≤ 0.1 to determine whether a gene meets transcriptome-wide significance [17]. Functional enrichment of biological pathways associated with age of menarche was performed using Correlation Adjusted Mean Rank (CAMERA), a competitive gene set test [18] using an intergene correlation of 0.01. The same set of covariates used in the single gene analysis are controlled for here. We used the 50 cancer “hallmark” gene sets from the Molecular Signature Database (MSigDB; http://www.broadinstitute.org/gsea/msigdb/) in our pathway analyses and an FDR ≤ 0.1 to determine statistical significance. For external validation, pathway analyses were replicated in a small subset of TCGA for which RNA-sequencing data and information on age at menarche was available (N = 116) [10, 19]. For this validation dataset, six TCGA sites were originally contacted and data from three (Roswell Park Cancer Institute, University of Pittsburgh, Mayo Clinic) sites that agreed to collect or provide breast cancer risk factor data on these cases were included in this study, as previously described [20]. Covariates from TCGA were selected a priori to match those used in the NHS analysis as closely as possible, though there are some differences: age at breast cancer diagnosis (continuous), year of diagnosis (continuous), tumor stage (1–4), race (White/non-White), parity (continuous), BMI at diagnosis (continuous), ER status (yes/no), and menopausal status (yes/no). Pathway analyses were again performed using CAMERA as described above and hits with FDR ≤ 0.2 were considered significant for validation.
Age at menarche and PAM50 scores
Proliferation score and risk of recurrence scores based on PAM50 assay were computed as described previously in NHS [21]. Briefly, proliferation score is computed by averaging gene expression of 11 genes (BIRC5, CCNB1, CDC20, NUF2, CEP55, NDC80, MKI67, PTTG1, RRM2, TYMS and UBE2C) [22]. Risk of recurrence (ROR) score combines gene expression of 50 gene in the PAM50 assay with tumor size and nodal status to compute an integer score proportional to risk of recurrence (0–100). PAM50 ROR score has been found to be highly predictive of risk of distant relapse [23]. Multiple linear regression was performed using these scores as continuous dependent variables and age at menarche as the main predictor. PAM50 is frequently used to classify breast tumors based on their gene expression into five molecular subtypes that differ both in biological characteristics and prognosis [24]. Multinomial regression was performed to test association of early menarche with PAM50-based intrinsic molecular subtypes (luminal B, normal, HER2, and basal) compared to the least aggressive luminal A subtype [24]. All other covariates previously mentioned were used for adjustment.
Early menarche-derived gene expression signature and breast cancer recurrence
To examine associations between an early menarche-associated gene expression signature and breast cancer recurrence, we included individual genes from FDR-significant pathways in the tumor (receptor-agnostic) showing nominal significance (p ≤ 0.05) to create a gene expression score, calculated as ∑(z-transformed genes from positively regulated pathways)—∑(z-transformed genes from negatively regulated pathways). LASSO regression was used in glmnet in R to select the most predictive genes while preventing overfitting through shrinkage of the regression coefficients [25].
Discovery cohort: Nurses’ Health Studies We used Cox proportional hazards regression to examine the association between our menarche-associated gene expression signature and breast cancer recurrence among stage 1–3 breast cancer cases. Scores were modeled as categorical, using quartiles of expression as cut points to make scores from 1 to 4, with 1 representing the lowest score (most dissimilar to early menarche) and 4 representing the highest score (most similar to early menarche). Hazard ratios and 95% confidence intervals were calculated. Recurrence-free survival was defined as the time between cancer diagnosis and either recurrence (cancer detected at common metastatic sites, such as bone, brain, lungs, and liver) or death from breast cancer without reported recurrence (12). We evaluated an interaction term between score and the log of recurrence time to test violation of the proportional hazards assumption with a likelihood ratio test. Proportional hazards were violated; we therefore applied a piecewise Cox model using the crossing of the Kaplan Meier curves as our cut point, which was 10 years.
Validation cohort: METABRIC To assess the generalizability of our menarche-associated gene expression signature, we leveraged an independent dataset, the Molecular Taxonomy of Breast Cancer International Consortium (METABRIC), for validation. Using our NHS-derived gene signature, we computed the early menarche-associated score in tumors from METABRIC using the available gene expression data. We then used a Cox regression model to assess the association of the score with breast cancer recurrence. Covariates included: age at diagnosis, ER status, batch, menopausal status, cancer stage, and treatment (chemotherapy, radiotherapy, and/or hormonal therapy). Analysis was restricted to complete cases to include a total of 952 breast cancer cases, stage 1–3 only. Score was again modeled as categorical, using quartiles of expression in METABRIC as cut points. We evaluated an interaction term between score and the log of recurrence time to test violation of the proportional hazards assumption; no violation was found.

留言 (0)