Materials
Copper(II) chloride dihydrate (CuCl2·2H2O) was purchased from Sinopharm Chemical Reagent Co., Ltd. (Xi’an, China). Hyaluronic acid (HA, MW: 8000 Da) was obtained from Bloomage Freda Biopharm Co., Ltd. (Shandong, China). Chlorine e6 (Ce6) was purchased from Aladdin Biochemical Technology Co., Ltd. (Shanghai, China). Anlotinib (AL3818) was purchased from Sino Biopharmaceutical Co., Ltd. Methylene blue (MB), terephthalate (TPA) and glutathione (GSH) were purchased from Macklin Biochemical Co., Ltd. (Shanghai, China). A singlet oxygen sensor green (SOSG) fluorescent probe was obtained from Beyotime Biotechnology Co., Ltd. (Shanghai, China). Dulbecco’s modified Eagle’s medium (DMEM), penicillin‒streptomycin, fetal bovine serum (FBS) and 0.25% (w/v) trypsin were obtained from Gibco (USA). A live/dead cell double staining kit (Calcein AM/PI), cell counting kit-8 (CCK-8), annexin V-FITC/PI apoptosis detection kit, Hoechst 33,258 (Hoechst), mitochondrial membrane potential assay kit with JC-1, 2,7-dichlorodihydrofluorescein diacetate (DCFH-DA) kit, LPO fluorescent probe (C11-BODIPY581/591) and HIF-1α rabbit polyclonal antibody were purchased from Beyotime Biotechnology Co., Ltd. (Shanghai, China). 3,3’-Dithiobis(propanoic dihydrazide) (TPH) and aldehyde hyaluronic acid (HAA) were synthesized according to our previously reported methods [34, 35]. 1H NMR spectra of TPH (DMSO-d6, Bruker 400 MHz, δppm): 2.50 (t, 4 H, CO-CH2-CH2), 2.85 (t, 4 H, CO-CH2-CH2), 4.20 (s, 4 H, NH2-NHCO), and 9.08 (s, 2 H, NH2-NHCO).
Preparation of TCC nanoparticles
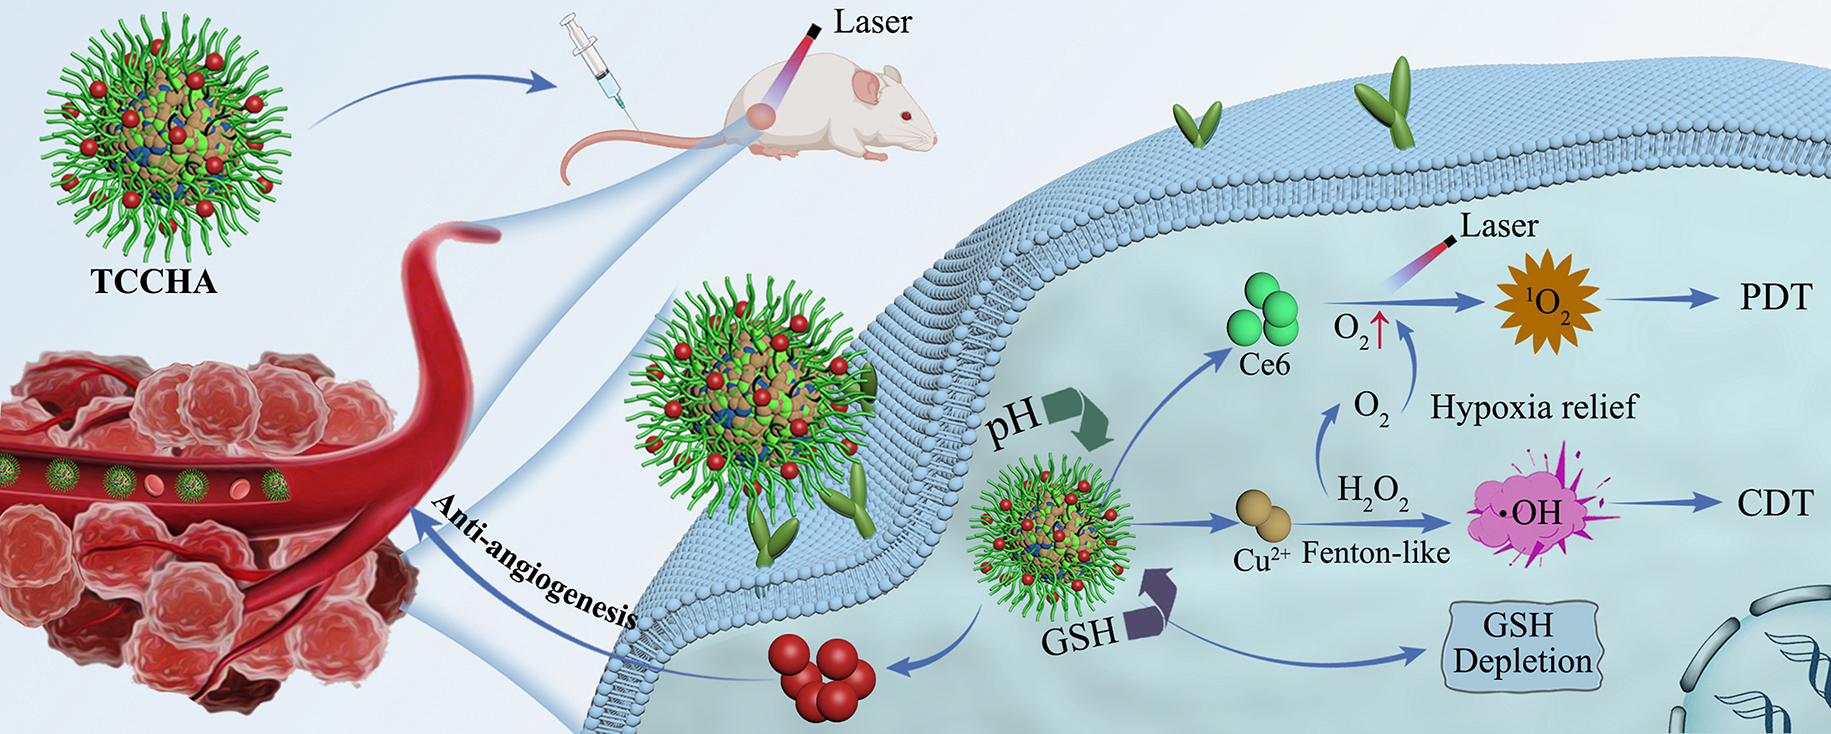
To prepare the TCC nanoparticles, 2 mL of TPH solution (23.8 mg/mL) was mixed with 1 mL of Ce6 solution (1 mg/mL, dissolved in DMSO) and stirred at 25 °C for 2 h. Subsequently, the mixture was immediately supplemented with 85 µL of CuCl2 solution (100 mg/mL) and vigorously stirred for 3 min. Then, the mixed solutions were gently stirred at 25 °C for 24 h. The formed TCC nanoparticles were washed three times with water by centrifugation (18 000 rpm, 10 min), dispersed in water and stored at 4 °C until use.
Surface modification of TCC nanoparticles
Two milliliters of AHA solution (10 mg/mL) was mixed with 3 mL of TCC nanoparticle suspension under vigorous stirring. After reacting at room temperature for 24 h, the surface-modified TCC (called TCCH) nanoparticles were obtained by centrifugation (18 000 rpm, 10 min), redispersed in water and stored at 4 °C until use.
Preparation of TCCHA nanoparticles
TCCHA nanoparticles were obtained through a Schiff base reaction. Briefly, 1 mL of 1 mg/mL AL3818 solution was added dropwise to 3 mL of the as-prepared TCCH suspension. After stirring for 24 h, the TCCHA particles were collected via centrifugation at 18,000 rpm for 10 min and washed three times with water. The obtained TCCHA nanoparticles were dispersed in water and stored at 4 °C until use.
Characterization
UV-vis absorption spectra were recorded by a TU-1810 spectrophotometer (Purkinje General Instrument Co. Ltd. Beijing, China). A JEM-200CX transmission electron microscope (TEM, Nippon Electric Co. Ltd. Japan) was used for morphological analysis of the nanoparticles. The size distribution and zeta potential of the nanoparticles were measured using a Zetasizer Nano ZS90 dynamic light scattering (DLS) instrument (Malvern Instruments, UK). High-performance liquid chromatography (HPLC) data was recorded to determine the amount of released AL3818 (E2695, Waters Corporation, USA). Laser irradiation experiments were conducted using a MW-GX-660 660 nm near-infrared (NIR) laser (Changchun Laser Optoelectronics Technology Co., Ltd., China). In vitro cell fluorescence imaging was performed using a TCS-SP8 confocal laser scanning microscope (CLSM, Leica, Germany) or a fluorescence microscope (BX51, Olympus, Japan). Flow cytometric analysis was performed on a FACS Canto II flow cytometer (BD Biosciences, USA). An IVIS Lumina imaging system (PerkinElmer, America) was used for real-time NIR fluorescence imaging in vivo. To study the stability of the TCCHA nanoparticles, the nanoparticles were dispersed in water, phosphate buffered saline (PBS), saline or cell culture medium (DMEM) for seven days to test their hydrodynamic size.
In Vitro release study
The drug release behaviors of Ce6 and AL3818 from the TCCHA nanoparticles were evaluated under different pH conditions. Briefly, a TCCHA suspension (5.0 mg/mL, 2.0 mL) was placed in a dialysis bag (MWCO: 1000 Da). The dialysis bag was then immersed in PBS solutions with different pH values (pH 7.4, pH 6.5, pH 5.0). Thereafter, the sample was incubated in a shaker at 37 °C with constant shaking at 100 rpm. At specified time intervals, 2 mL of release medium was removed, and the same volume of fresh medium was immediately added. The release amounts of Ce6 and AL3818 were determined using HPLC.
Functional characteristics of the TCCHA nanoparticlesFenton-like activity of the TCCHA nanoparticles
To detect the Fenton-like activity of the TCCHA nanoparticles, MB, TMB and TPA were used as indicators. For the MB method, a TCCHA nanoparticle suspension (20 µg/mL), H2O2 (10 mM) and MB (10 µg/mL) were mixed in deionized water and incubated on a 37 °C shaker for 2 h. Then, the absorption spectrum of the mixture was recorded using a UV‒vis-NIR spectrometer at 20-minute intervals. Similarly, for the TMB assay, a TCCHA nanoparticle suspension (20 µg/mL), H2O2 (10 mM) and TMB (5 µg/mL) were mixed in deionized water for 10 min. Afterwards, the mixture was removed for UV‒Vis analysis. For the TPA test, TPA (5 µg) was first dissolved in NaOH solution (2 mM, 1 mL) to prepare the TPA working solution. Then, 100 µL of TCCHA nanoparticle suspension (20 µg/mL) and H2O2 (10 mM) were added to the TPA working solution. After 5 min, the fluorescence intensity of the test solution was recorded by a fluorescence spectrophotometer (λex = 310 nm).
O2 generation
0.1 mL of TCCHA nanoparticle suspension (500 µg/mL) was mixed with 5 mL of H2O2 solution (10 mM). Subsequently, the O2 generated from the mixed solution was monitored by a portable dissolved oxygen meter.
Singlet oxygen (1O2) generation
A singlet oxygen sensor green (SOSG) probe was used to determine the generation of 1O2 in cells. First, the SOSG working solution was prepared in accordance with the manufacturer’s instructions. Subsequently, the TCCHA nanoparticle suspension was added to the SOSG working solution. The resulting mixture was then exposed to 660 nm laser irradiation for 3 min at a power density of 0.5 W/cm2. The production of 1O2 was assessed by measuring the fluorescence intensity. To induce a hypoxic condition, nitrogen gas was continuously introduced to the working solution for 10 min, followed by the addition of 10 mM H2O2.
GSH consumption
The consumption of GSH was assessed using the DTNB method. Briefly, DTNB solution (2.5 mg/mL, 200 µL), TCCHA suspension (200 µg/mL, 100, 250, 500 or 1000 µL), and GSH solution (5 mM, 50 µL) were added to a centrifuge tube, after which the reaction system was diluted to 4.0 mL with water. Subsequently, the resulting mixture was placed on a shaking Table (37 ℃, 150 rpm) for 30 min, followed by centrifugation to remove any precipitate. Finally, the relative content of GSH was determined by measuring the absorbance of the supernatant at 412 nm using a UV‒vis-NIR spectrometer.
In vitro cell study
Four cell lines were used, including human hepatoma HepG2 cells, mouse hepatoma Hepa1-6 and H22 cells, and normal mouse fibroblast L929 cells. L929 cells and HepG2 cells were obtained from the Medical Center of Xiʼan Jiaotong University (Xiʼan, China), and H22 and Hepa1-6 cells were purchased from the National Collection of Authenticated Cell Cultures (Shanghai, China). The cells were cultured in DMEM supplemented with 10% FBS and 1% penicillin‒streptomycin. The cells were maintained in a 5% CO2 atmosphere at 37 °C and routinely subcultured.
In Vitro cellular uptake
The uptake of TCCHA by HepG2 cells was assessed using both confocal laser scanning microscopy (CLSM) and flow cytometry. HepG2 cells were initially seeded in confocal dishes at a density of 1 × 10⁵ cells per dish and incubated in 1 mL of culture medium for 24 h. Subsequently, the cells were incubated with 25 µg/mL TCCHA for 1, 4–8 h. Afterwards, the cells were stained with 5 µg/mL Hoechst 33342 according to the manufacturer’s instructions and then observed via CLSM. In addition, the intracellular Ce6 concentration in HepG2 cells was quantitatively analysed via flow cytometry. Typically, HepG2 cells were seeded into 6-well plates and incubated for 24 h. After being treated as described above, the cells were collected for flow cytometry analysis. To verify whether the HA moiety possessed active targeting ability, a competitive binding experiment was performed. This involved pretreating the cells with 1 mg/mL free HA before coculturing them with the TCCHA nanoparticles. An excess amount of free HA was used to block the CD44 receptor during coculture.
In vitro cytotoxicity
First, the cytotoxicity of the TCCHA nanoparticles on HepG2, Hepa1-6, and L929 cells was assessed. The cells were seeded into 96-well plates at a density of 1 × 10⁴ cells/well and cultured for 24 h. Then, the cells were subsequently incubated with various concentrations of TCCHA nanoparticles (10, 20, 50, 100, or 200 µg/mL) for 24 h, after which cell viability was evaluated by a CCK-8 assay. To investigate the effects of HA-mediated active targeting on the cytotoxicity of the TCCHA nanoparticles, HepG2 cells were pretreated with free HA (1 mg/mL) for 1 h. Following pretreatment, the cells were incubated with different concentrations of TCCHA (10, 20, 50, 100, or 200 µg/mL) for 24 h. A CCK-8 assay was subsequently performed to assess cell viability. To assess the cytotoxicity of various drug formulations, HepG2 cells were exposed to free AL3818, free Ce6, TCCH, or TCCHA for 8 h. After rinsing with PBS, the cells in the Ce6-containing groups were irradiated using a 660 nm NIR laser at a power density of 0.5 W/cm2 for 3 min. Following a 24-hour incubation, cell viability was determined using the CCK-8 assay.
Calcein-AM/PI double-staining assay and cell apoptosis assessment
A calcein-AM/PI double-staining assay was performed to visually assess the cytotoxicity of TCCHA. Briefly, HepG2 cells were seeded in 6-well plates at a density of 5 × 10⁵ cells/well. After 24 h of incubation, the cells were treated with PBS, free AL3818, free Ce6, TCCH, or TCCHA at 37 °C for 8 h. Subsequently, the cells in the Ce6-containing groups were irradiated with a 660 nm NIR laser (0.5 W/cm2, 3 min). After 4 h, the cells were stained with calcein-AM and PI according to the manufacturer’s protocol and observed using a fluorescence microscope.
Flow cytometry was used to analyse the mechanism of cell death. HepG2 cells were initially seeded in 6-well plates at a density of 5 × 10⁵ cells/well for 24 h. Subsequently, the cells were treated according to the procedures described for the calcein-AM/PI double-staining assay. After that, the cells were treated with an annexin V-FITC/PI apoptosis detection kit, and flow cytometry analysis was conducted.
Intracellular GSH consumption
HepG2 cells were seeded into a 6-well plate at a density of 5 × 10⁵ cells/well for 24 h. Then, the cells were treated with either 25 µg/mL or 100 µg/mL TCCHA. After 12 h, the cells were collected, and the intracellular content of GSH was measured using a GSH/GSSG detection kit.
Evaluation of intracellular ROS, LPO and H2O2 levels
HepG2 cells were seeded into confocal dishes at a density of 2 × 10⁵ cells/dish for 24 h. Subsequently, the cells were incubated with PBS, free Ce6, or TCCHA for 8 h. For the ROS assay, the cells were stained with 10 µM DCFH-DA for 30 min according to the manufacturer’s protocol. The cells in the NIR groups were irradiated with a 660 nm laser for 3 min at a power density of 0.5 W/cm2. CLSM was used to observe the cells. In addition, the cells were cultured under hypoxic condition for 12 h and then subjected to the same procedures as those described above to measure ROS levels. For the LPO assay, the cells were stained with 5 µM LPO fluorescent probe C11-BODIPY581/591 for 30 min and then detected via CLSM.
To examine the level of H2O2, the cells were treated with different concentrations of TCCHA (25–100 µg/mL) for 12 h. Afterwards, H2O2 levels were determined by using a fluorometric hydrogen peroxide assay kit.
Evaluation of hypoxia relief in Vitro
Immunofluorescence staining was performed to detect intracellular hypoxia relief. HepG2 cells were seeded into confocal dishes at a density of 2 × 10⁵ cells/dish and cultured under hypoxic conditions for 12 h. Subsequently, the cells were treated with either 25–100 µg/mL TCCHA for 2 h. Afterwards, the cells were washed, fixed, and stained with anti-HIF-1α according to the manufacturer’s instructions. CLSM was used to visually observe and determine the level of cellular hypoxia relief. In addition, a hypoxia probe was used to evaluate the hypoxia relief ability of TCCHA according to the manufacturer’s instructions. CLSM was also employed to visually investigate the degree of cellular hypoxia.
In vivo animal study
Four- to five-week-old BALB/c mice were obtained from the Experimental Animal Center of Xi’an Jiaotong University. All animal experiments were conducted in accordance with protocols approved by the Animal Care and Use Committee of Xi’an Jiaotong University. All necessary ethical regulations were strictly adhered to during the experiments. To evaluate the antitumor effects of TCCHA nanoparticles on human hepatocellular carcinoma, a HepG2 tumor-bearing model was established. One hundred microliters of HepG2 cells (human hepatocellular carcinoma cell line) was subcutaneously injected (1 × 10⁷ cells) into the right flank of each immunodeficient nude mouse. Tumor-bearing mice were treated when the tumor volume reached approximately 100 mm3. To further confirm the antitumor effects of TCCHA nanoparticles, an H22 tumor-bearing model was established. H22 tumor cells (a mouse hepatocellular carcinoma cell line) were injected subcutaneously (1 × 10⁶ cells) into the right flanks of each immune-competent BALB/c mouse. The mice were treated when the tumor volume reached approximately 80 mm3. The in vivo antitumor experiment was conducted following the same steps as those for HepG2 tumor-bearing BALB/c nude mice. Furthermore, a lung metastatic Hepa1-6 tumor model was established. A tumor lung metastasis model was established through subcutaneous injection of 5 × 10⁶ Hepa1-6 cells into the right flank and intravenous injection of 5 × 10⁵ Hepa1-6 cells separately at day 7 and day 2 before the treatments for development of the primary and lung metastasis tumors, respectively. The mice were treated when the tumor volume reached approximately 100 mm3.
In vivo fluorescence imaging and biodistribution
To trace the in vivo distribution of TCCHA, 100 µL of 5 mg/mL TCCHA suspension was intravenously injected into tumor-bearing mice. At predetermined time points, the mice were imaged on an IVIS Lumina imaging system. At the indicated time points, the mice were sacrificed, and major organs and tumors were collected for ex vivo fluorescence imaging.
The biodistributions of Cu2+ in major organs and tumors were assessed by ICP-MS, and the biodistributions of Ce6 and AL3818 were assessed by HPLC. For ICP-MS analysis, each tumor-bearing mouse was intravenously injected with 100 µL of 5 mg/mL TCCHA and then sacrificed at predetermined time intervals (n = 5 per time point). The tumors and main organs were collected, wet-weighed, lyophilized, and ground into powder. Subsequently, the powder samples were predigested with aqua regia overnight, completely digested in open vessels at 140 °C for 2 h, and then cooled to room temperature. Each solution was diluted with water to 10 mL for ICP-MS analysis. For HPLC analysis, the tumors and main organs were collected, wet-weighed, homogenized, extracted with chloroform, and analysed via HPLC.
In vivo antitumor efficacy
Tumor-bearing mice were randomly divided into six groups (n = 6): (1) PBS (control group), (2) Ce6 + Laser, (3) AL3818, (4) TCCH + Laser, (5) TCCHA, and (6) TCCHA + Laser. The mice were intravenously injected with 100 µL of the above formulations at an equivalent dose of TCCHA (5 mg/kg). At 8 h postinjection, the tumors in the laser treatment groups were irradiated with a 660 nm laser for 5 min at 1.0 W/cm2. The irradiation procedure was repeated every 2 days for a total of three times. The tumor volume and body weight were recorded every 2 days. Tumor volume was calculated by the following equation: Volume = (tumor length) × (tumor width)2/2. After 14 days, the mice were sacrificed, and the tumors were harvested, weighed and analysed by H&E, TUNEL, Ki67, and CD31 staining. to determine the antitumor efficacy of the TCCHA nanoplatform.
Statistical analysis
All data were represented as the means ± standard deviations (S.D.). Statistical comparisons were made by unpaired Student’s t test (between two groups) or one-way ANOVA (for multiple comparisons). ns indicates no significance. *p < 0.05 was considered statistically significant, whereas **p < 0.01 and ***p < 0.001 were considered highly and extremely significant, respectively. All the data were analysed with SPSS 17.0 software.


留言 (0)