Probiotics and microalgae culture experiments
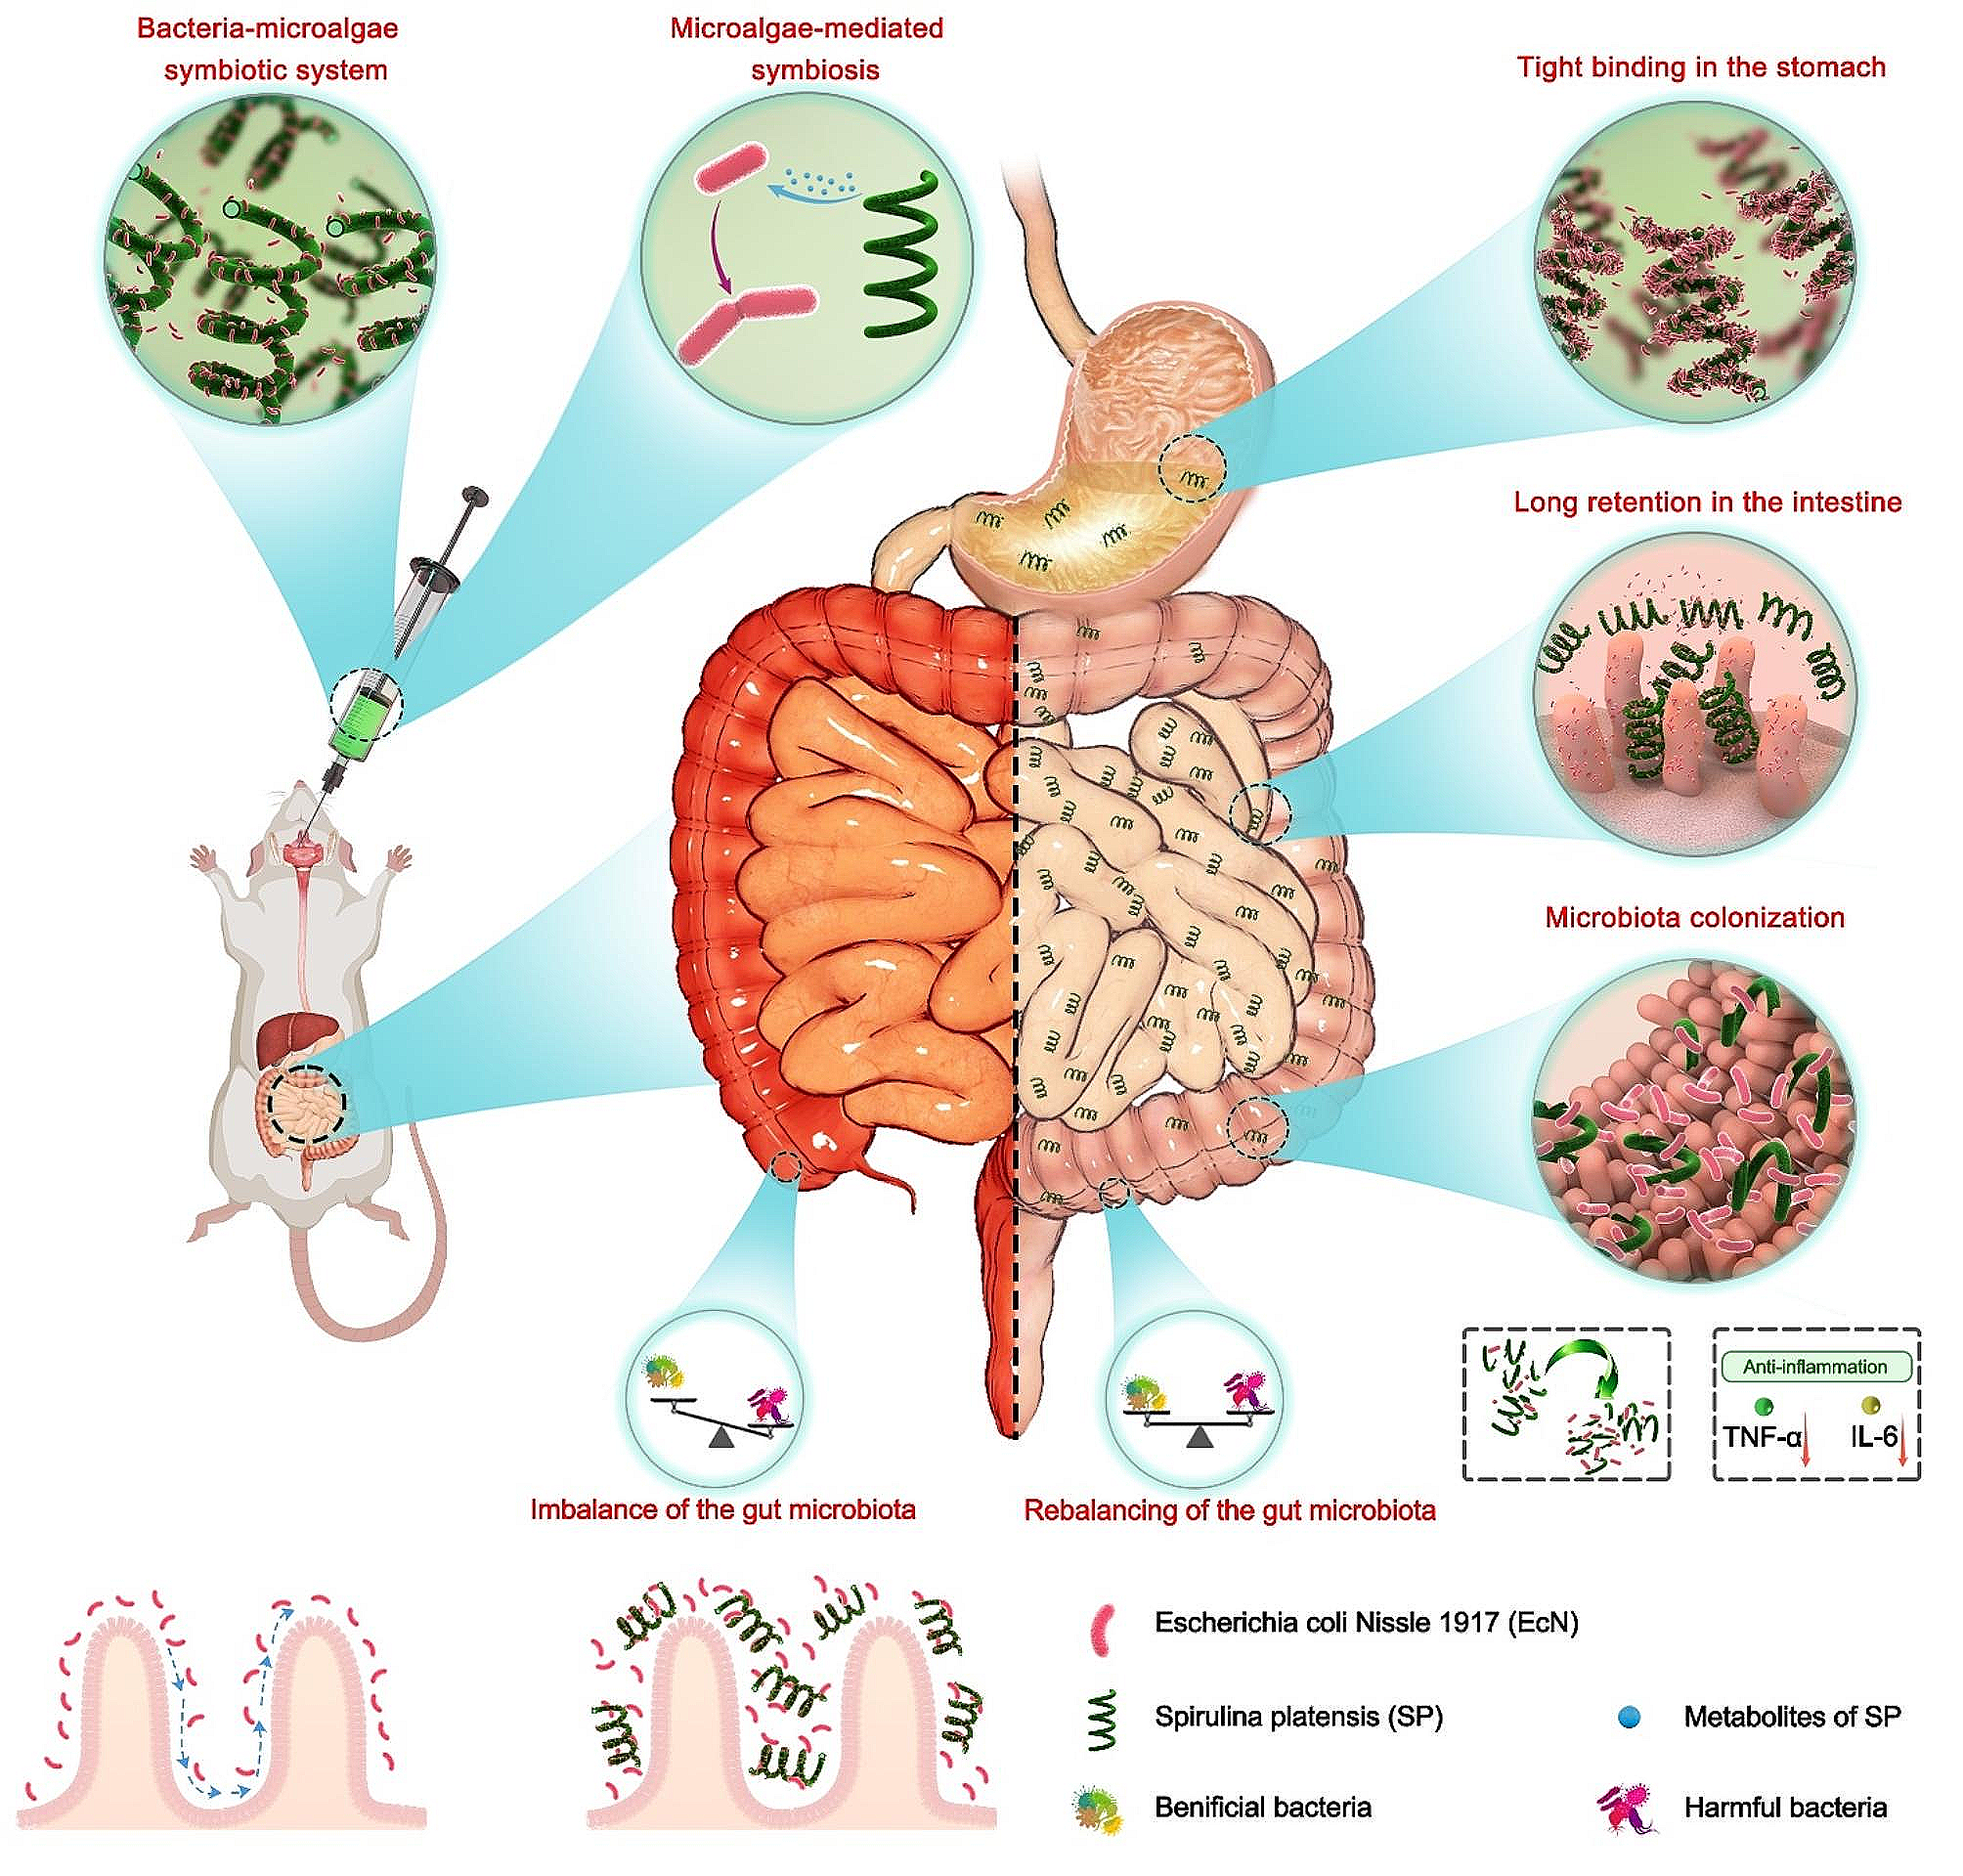
Strain EcN, a kind gift of Professor Jinyao Liu (Shanghai, China), was cultivated in lysogeny broth (LB) culture media in a 250-mL Erlenmeyer flask at 37 °C and 200 rpm. 10 g tryptone, 5 g yeast extract, and 10 g NaCl were included in one liter of LB, and the initial pH of the media was 7.4. EcN samples were collected at 12 h cultivation, and harvested by centrifugation (6,500 ×g, 10 min, 4 °C), then washed using phosphate buffered saline (PBS) three times, and the resulting cells were resuspended with PBS (OD600 = 1). SP and its culture media, Zarrouk media, were both purchased from Guangyu Biological Technology (Shanghai, China). SP was cultured in an illumination incubator (Bluepard, Shanghai, China) at 30 °C. One liter of Zarrouk media contained 16.8 g NaHCO3, 2.5 g NaNO3, 1 g NaCl, 0.5 g K2HPO4, 1 g K2SO4, 0.2 g MgSO4, 0.01 g FeSO4·7H2O, 0.08 g EDTA, 0.04 g CaCl2, 0.00286 g H3BO3, 0.00186 g MnCl2, 0.00022 g ZnSO4, 0.00008 g CuSO4, and 0.00005 g Co(NO3)2·6H2O. SP samples were harvested by centrifugation (3,260 ×g, 10 min, 4 °C), and washed by PBS three times, and the cells were resuspended with PBS (OD680 = 1). EcN-SP was obtained by adding equal volume of bacterial samples into SP solution.
Characterization of EcN, SP, and EcN-SP
Strain EcN was first stained using the Gram stain method, and then using an optical microscope (Zeiss, Oberkochen, Germany) to capture bright-field and fluorescence microscope images. The morphology of EcN, SP, and EcN-SP was measured using a scanning electron microscope (SEM, SU-8010, Hitachi, Japan). Firstly, the samples were fixed with 2.5% glutaraldehyde in phosphate buffer (0.1 M, pH 7.0) overnight. and washed three times using phosphate buffer (0.1 M, pH 7.0). To protect the surface structure of EcN-SP during the subsequent processing, the sample was placed on a square filter paper and folded into 1 cm2 after pouring out the glutaraldehyde. All samples were fixed with 1% OsO4 in phosphate buffer for 2 hours and washed by phosphate buffer for three times. Then, the samples were sequentially dehydrated in 30, 50, 70, 80, 90, 95, and 100% ethanol. Finally, the samples were completely dehydrated using a Hitachi HCP-2 critical point dryer. The samples were covered with gold-palladium in a Hitachi model E-1010 ion sputter and observed using an SEM.
Coculture of EcN with SP in the light or dark conditions
To explore the effect of SP and the SP extract after ultrasonic decomposition (SP-Ex) on the growth rate of strain EcN, EcN was cocultured with SP or SP-Ex in PBS with no nutrients. Before the experiment, the bacteria were freshly played on LB ager. Then, the single colonies of bacteria were picked and amplified in LB broth overnight (37 °C, 200 rpm). Strain EcN (OD600 = 2) and SP (OD680 = 2) were washed and harvested in sterile PBS as described above. SP was broken for 10 min using an ultrasonic crusher (ULD43, Ningbo Sincere Ultrasonic Equipment Technology Co. Ltd., Ningbo, China) at a sonication power of 75 W to obtain SP-Ex. EcN was mixed with SP or SP-Ex to achieved a 1:1 bacterium: microalgae ratio, and cocultured at 37 °C and 200 rpm for 8 h. Strain EcN was cultured alone with the same volume of PBS as a control. Samples were collected every 2 h and bacterial colony counts were performed using the spread plate counting method: samples were diluted for spread plate using LB agar media, and incubated at 37 °C for 24 h, the colonies on the plate were counted and analyzed. Furthermore, to investigate the effect of light on the proliferation of EcN in the symbiotic system, EcN and EcN-SP were cultured in PBS, simulated gastric fluid (SGF) containing pepsin (pH 2.0), and simulated intestinal fluid (SIF) with or without light. Samples from PBS were collected at 0, 2, 4, 6, and 8 h, from SGF at 0, 0.5, and 1 h, and from SIF at 0, 1, 2, 3, and 4 h. Bacterial colony counts were then performed as previously described, with colonies on the plates being counted and analyzed.
Fluorescence imaging and in vivo biodistribution
All animal experiments and procedures in this study were approved and performed by the Institutional Animal Care and Use Committee of Zhejiang University. All animals in this study were purchased from Shanghai SLAC Laboratory Animal Co. Ltd. Mice were housed in isolator cages with sterilized bedding under the following auto-controlled conditions: temperature (24 °C), lighting (12 h light, 12 h dark), and relative humidity (55%).
Female C57BL/6 mice (six-week-old) were randomly allocated into two groups including EcN (108 CFU EcN, 200 µL), and EcN-SP (108 CFU EcN and 80 µg/mL SP suspensions, 200 µL). Mice were fasted for 12 h and orally administered with EcN and EcN-SP. After 1, 2, 4, 6, 8, and 24 h, the mice (n = 3) were sacrificed, and brain, heart, liver, spleen, lung, kidney, bladder, and GI tract of mice, were dissected and photographed with IVIS Lumina LT Series III (PerkinElmer, USA) using the fluorescence channel of GFP (excitation wavelength: 488 nm, emission wavelength: 505–550 nm) for EcN and chlorophyll (excitation wavelength: 605 nm, emission wavelength: 615–665 nm) for SP. The ileum (1 h after the oral administration) and colon (4 h after the oral administration) tissues in two groups were excised and incubated with PBS with 5% formaldehyde for fixing. Then, the samples were sectioned. Afterward, the samples were embedded in an OCT compound, and frozen. Frozen sections of ileum and colon were harvested with a slice thickness of 25 μm, and then the nuclei of the cells were stained using 4-6-diamidino-2-phenylindole (DAPI) for fluorescence microscope images.
Cell culture
Normal rat small intestinal epithelial cells IEC-6 (ATCC; USA), were cultured in Dulbecco’s modified Eagle’s medium (DMEM) supplemented with 10% fetal bovine serum, 1% antibiotics, and 0.1 U/ml bovine insulin at 37 °C under 5% CO2 atmosphere.
Cell counting kit-8 assay
IEC-6 cells were seeded into 96-well plates and cultured overnight. Afterward, IEC-6 cells were incubated with SP and SP-Ex at a series concentration (0, 1.6, 3.2, 6.3, 12.5, 25, and 50 µg/mL) for 24 h, respectively. The IEC-6 cell viability after dealing with SP or SP-Ex were verified by using cell counting kit-8 (CCK-8) assay (Beyotime, China). The absorbance at 450 nm was measured by using a microplate reader to verify the cell viability.
Assessment of the anti-inflammatory effect of SP and SP-Ex
IEC-6 cells were seeded and incubated into 24-well plates overnight. Then the cells were incubated with 50 µg/mL lipopolysaccharide (LPS) and 50 µg/mL SP or SP-Ex for 12 h to test the anti-inflammatory effect of SP and SP-Ex. DCFH-DA assay kit (YEASEN, Shanghai, China) was used to measure the ROS generation. The images of treated cells were taken using a fluorescence microscope (Zeiss, Oberkochen, Germany), and then the fluorescent signals were quantified by using a flow cytometer (Beckman, California, USA) for further verification.
Anti-inflammatory effects against DSS-induced mouse colitis
After acclimation, six-week-old female C57BL/6 mice were randomly divided into five groups (n = 6): 1, PBS (normal control, 200 µL PBS); 2, DSS + PBS (200 µL PBS); 3, DSS + EcN (108 CFU EcN, 200 µL/mouse); 4, DSS + SP (80 µg/mL SP suspensions, 200 µL/mouse); and 5, DSS + EcN-SP (108 CFU EcN and 80 µg/mL SP suspensions, 200 µL/mouse). The acute colitis of mice in the 4 treatment groups (PBS, DSS + PBS, DSS + EcN, DSS + SP, DSS + EcN-SP) were induced by providing drinking water containing DSS (3%, w/v) for the first 7 days. Mice were orally administered with PBS, EcN, SP, or EcN-SP every other day during the 2 weeks, respectively. Daily clinical assessment of DSS-induced colitis, including measuring body weight and noting rectal bleeding, stool conditions, and blood in stool using the disease activity index (DAI) scoring system was performed. Mice from different groups were sacrificed on the 14th day to dissect colons of each mouse. Then the length colons from different groups were measured, and the H&E, TNFα, and IL-6 staining were applied to the colons as well.
16 S rRNA sequencing analysis of gut microbiota
The feces of the mouse were collected on day 14 and stored at -80°C for further 16S rRNA gene sequencing. Magabio soil/fecal genomic DNA purification kit (Bioer, Hangzhou, China) was used to extract total genomic DNA. The concentration and purity were measured using the NanoDrop One (Thermo Fisher Scientific, MA, USA). Polymerase chain reaction amplification of the 16S rRNA gene V3-V4 region was conducted using the primer pairs F338 5’-ACTCCTACGGGAGGCAGCAG-3’ and R806 5’-GGACTACHVGGGTWTCTAAT-3’. Sequencing was performed on an Illumina Nova6000 platform by Guangdong Magigene Biotechnology Co., Ltd, China, and 250 bp paired-end reads were generated. OTUs were clustered in UPARSE [46]. Then, the taxonomy of the OTU representative sequence was assigned using the RDP classifier [47]. Further, the PICRUSt analysis workflow was applied to predict the functional composition of microbial communities’ metagenome from the 16 S profile [48]. Magichand Cloud Platform (http://www.magichand.online) was used to analyze all of the data.
Biosafety assessment
To evaluate the biosafety of the bacteria-microalgae symbiotic system, twenty healthy female C57BL/6 mice were allocated into four groups (n = 6), and given PBS, EcN, SP, and EcN-SP respectively every three days for 30 days. During one month, the mice’s body weight was monitored, and then, the mice were sacrificed to harvest their blood samples and major organs for the hematological and pathological examinations after one month.
Statistical analysis
All statistical analyses were conducted using Prism GraphPad v.8.00 (GraphPad Software, Inc., San Diego, CA, USA). In this study, all error bars were calculated from at least three independent experiments by using means ± SD. The P value indicates statistical significance as ns p > 0.05, *p < 0.05, **p < 0.01, ***p < 0.001.


留言 (0)