Materials
All chemicals and reagents were used as received without any further purification. Carboxymethyl chitosan (CMCS, degree of substitution: ≥ 80%) and calcium chloride (CaCl2) were purchased from Macklin (Shanghai, China). Chloroauric acid hydrated (HAuCl4·H2O) and glutathione (GSH) were obtained from Sigma-Aldrich (St. Louis, USA). Dulbecco’s modified eagle’s medium (DMEM), phosphate-buffered saline (PBS), trypsin-EDTA, and fetal bovine serum (FBS) were purchased from Gibco-BRL (Burlington, Canada). De-ionized water (18.2 MΩ cm− 1) was prepared using a Milli-Q purification system (St. Louis, MO, USA) and used in all experiments.
Synthesis of au NCs
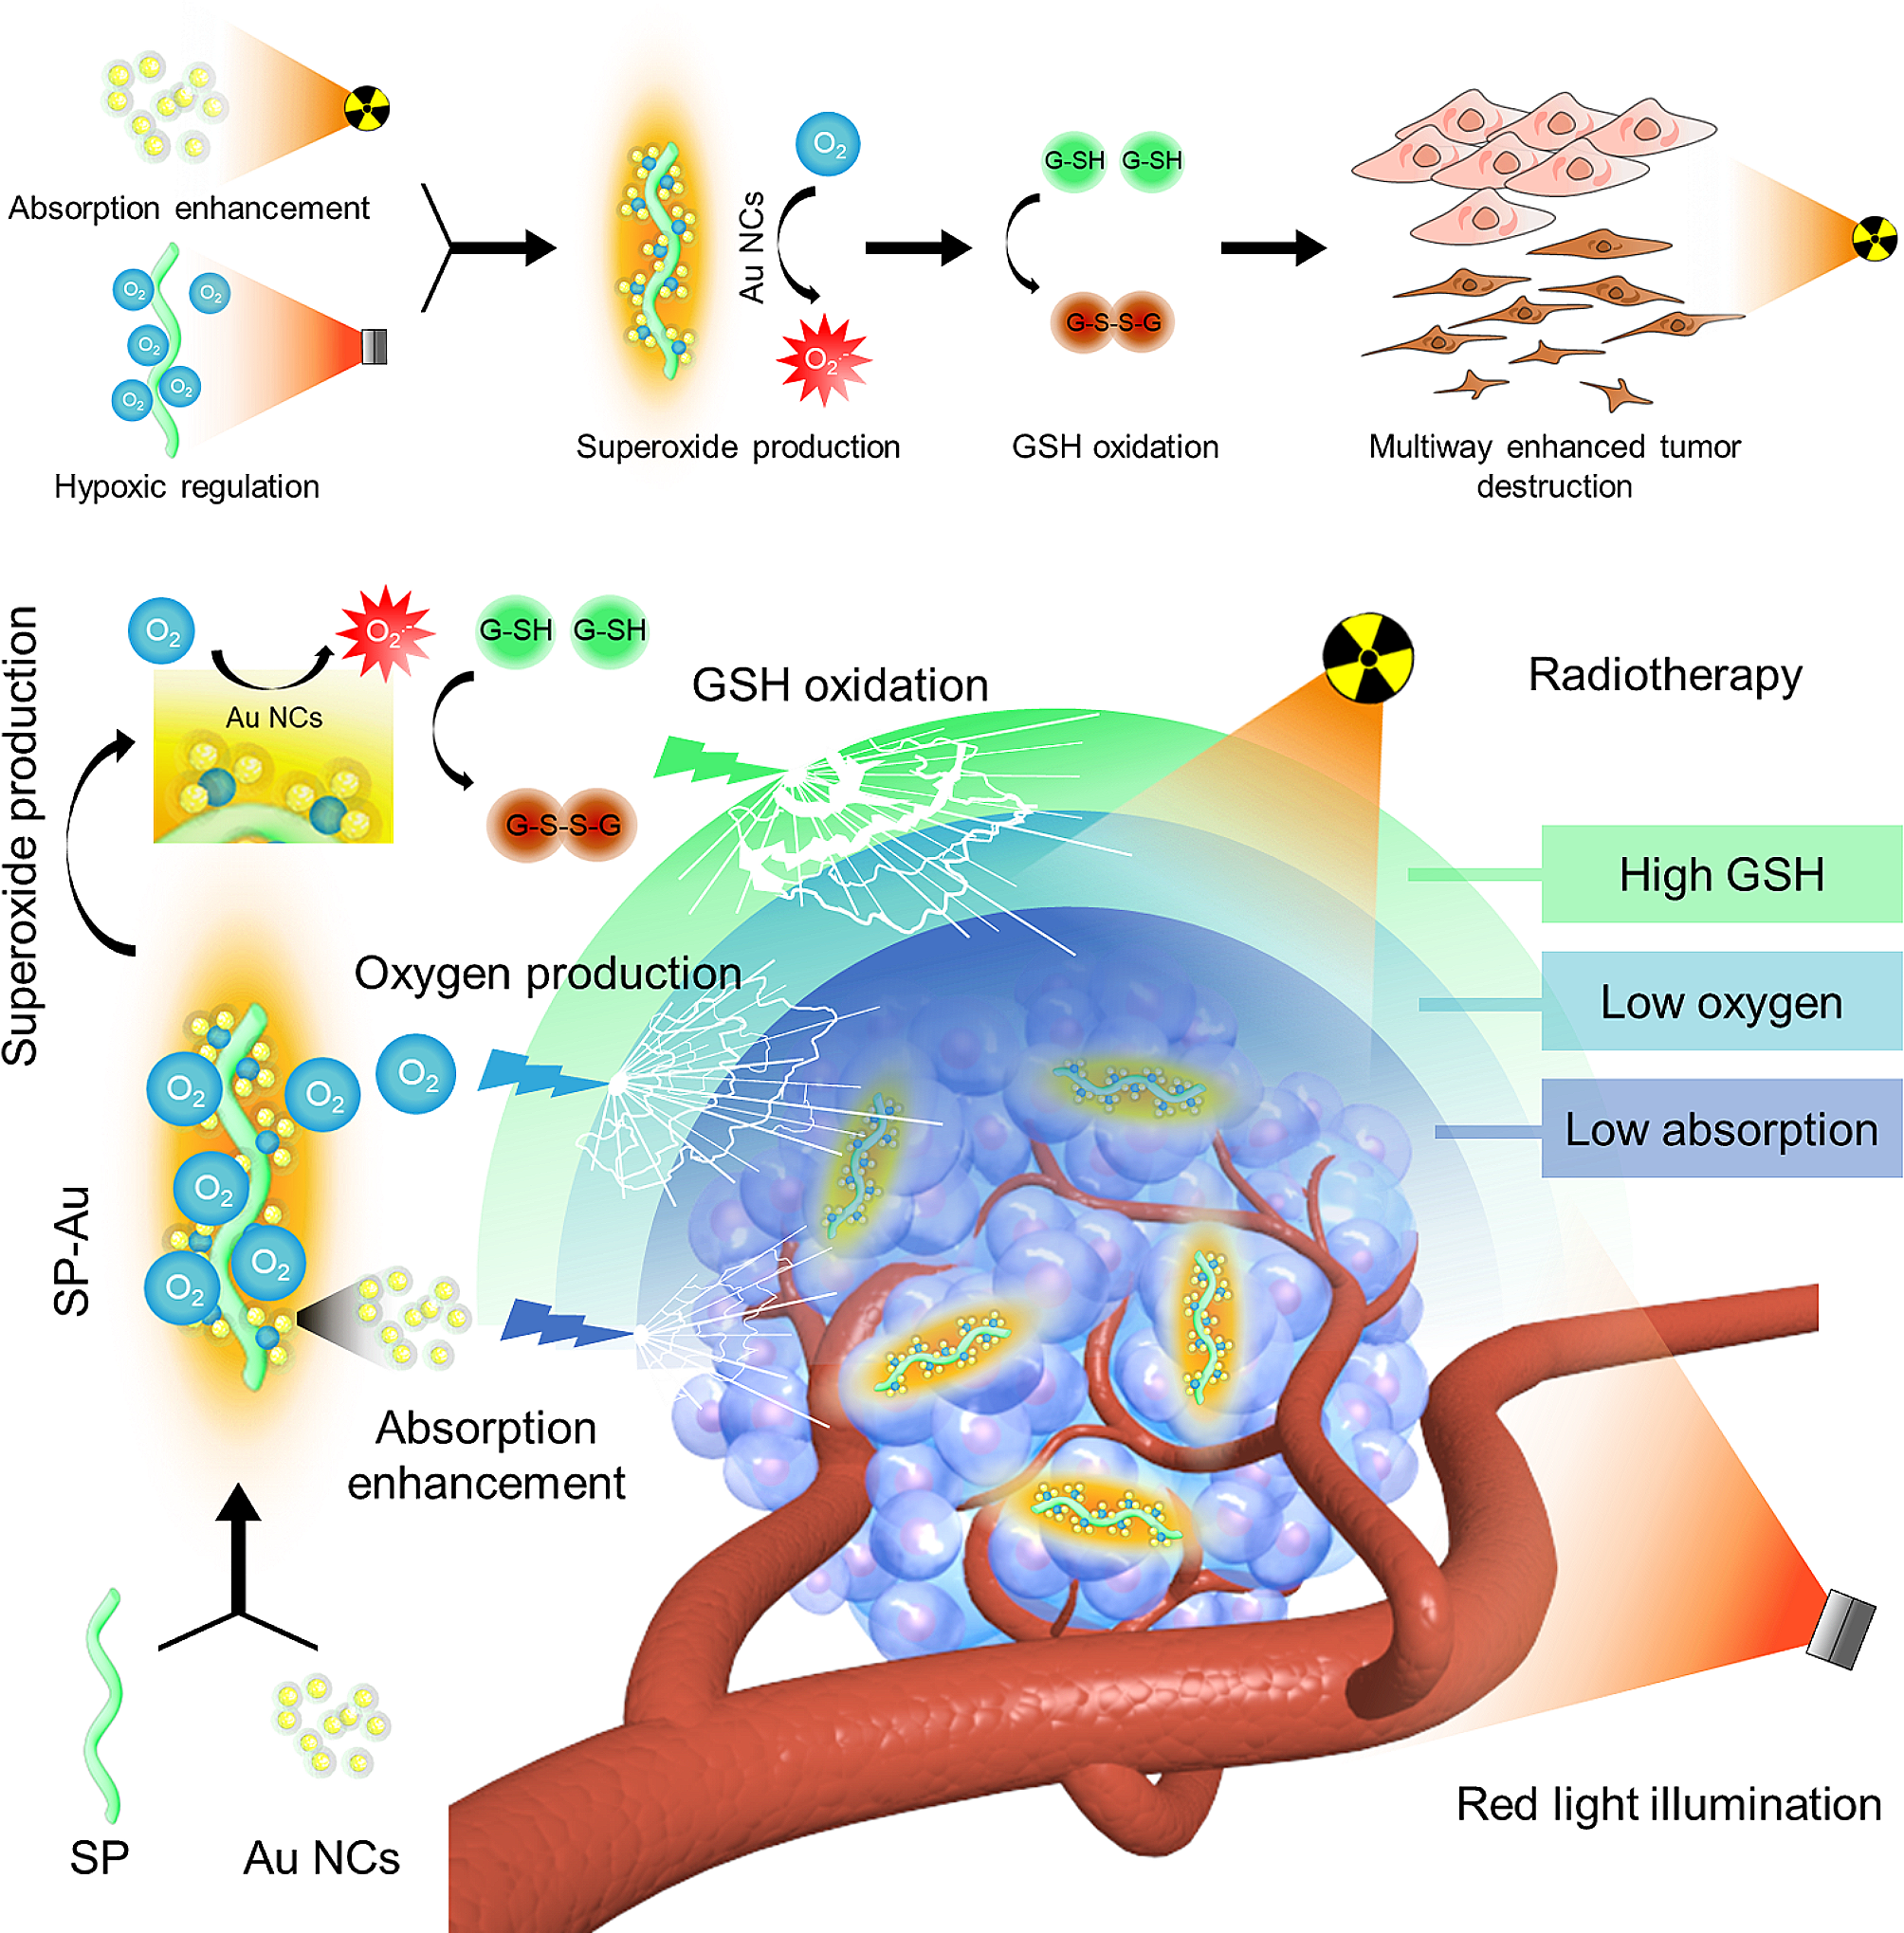
HAuCl4 solution (4 mL, 50 mM) and GSH (6 mL, 50 mM) were added into the CMCS solution (80 mL, 1 mg/mL) with vigorous stirring at room temperature for 30 min, NaOH (2 M) was added to maintain the pH at 7.0. The solution was then heated at ∼ 70 °C for 9 h and gradually cooled to room temperature to yield a yellow solution. Au NCs were obtained and purified by ultrafiltration centrifugation.
Synthesis of SP-Au
S. platensis sample was first collected by repeated centrifugation (4500 rpm, 10 min) and re-dispersion in 50 mL deionized water (DI water). It was then dispersed in 50 mL 1% CaCl2 solution and incubated for 30 min. After removing the unbound calcium ions by centrifugation, S. platensis was re-dispersed and stirred in 10 mL as-prepared Au NCs solution for 1 h to yield SP-Au [6, 52].
Characterization
Optical and fluorescense images were captured by fluorescence microscope (Zeiss, Oberkochen, Germany). The morphology and EDS spectra of SP-Au were monitored with the transmission electron microscope (TEM, Hitachi HT7700, Japan) and scanning electron microscopy (SEM, HITACHI SU8010, Japan). Reactive oxygen species were analyzed using electron spin resonance (ESR, Bruker EMXplus-6/1, Germany). Optical absorption of SP-Au was measured on an ultraviolet, visible and near infra-red (UV-Vis-NIR) spectrophotometer (UV-2600, Shimadzu, Japan).
Oxygen production of SP-Au
30 mL of SP, SP-Au (containing 1.5 mg SP) samples, or DI water were sealed in 50 mL centrifuge tubes in dark overnight to exhaust pre-dissolved oxygen. The tubes were then exposed to bright red light for 30 min, after which an oxygen sensing electrode (Unisense, Denmark) was used to measure the amount of produced oxygen. The standard curve of oxygen concentration was plotted using an oxygen saturated solution and an oxygen-depleted solution containing 0.1 mol /L ascorbic acid and 0.2 mol/L sodium hydroxide.
Catalyticcapacity of SP-Au
The catalase-like activity of Au NCs and SP-Au was measured through the oxidization of 3,3′,5,5′-tetramethylbenzidine (TMB) by H2O2via UV-Vis-NIR spectrophotometer (UV-2600, Shimadzu, Japan). First, TMB (200 µL, 5 mM) and H2O2 (200 µL, 50 mM) were mixed with DI water, Au NCs (20 µg/mL), or SP-Au (equivalent to20 µg/mL Au NCs). The mixed solution was exposed to red light (LED light, 615 ∼ 650 nm, 4600 lx) for 15 min and scanned on a UV-Vis-NIR spectrophotometer. The production of superoxide anions was detected using 1,3-diphenylisobenzofuran (DPBF). DPBF solution (20 µL, 10 mM in ethanol) was added into 1980 µL of DI water, Au NCs (20 µg/mL) or SP-Au (equivalent to 20 µg/mL Au NCs) solution. The mixed solution was exposed to red light (615 ∼ 650 nm, 4600 lx) for 15 min and scanned on a UV-Vis-NIR spectrophotometer. The consumption of glutathione (GSH) was monitored using a glutathione detection assay kit (Solarbio, Beijing, China). In brief, DI water, Au NCs (20 µg/mL) or SP-Au (equivalent to 20 µg/mL Au NCs) was mixed with GSH (2 mM) and the final volume was adjusted to 2 mL using DI water. The mixed solution then was subjected to illumination using the red light for 15 min and centrifuged to remove catalyzers. The supernatant was then collected to measure the content of GSH.
Cellular viability
3-(4,5-dimethylthiazol-2-yl)-2,5-diphenyltetrazolium bromide (MTT) assay was used to determine cellular viability. Briefly, HACAT keratinocytes, HEK293 human embryonic kidney cells, 4T1 murine breast cancer cells, and A549 murine lung cancer cells were seeded in 96-well plates overnight at 8 × 10³ cells per well. A 100 µL suspension of SP-Au in complete growth medium at different concentrations (0, 6.25, 12.5, 25, 50,100, or 200 µg/mL) was added to each well followed by a 24-h incubation. After aspiring the treatment solution and washing with phosphate buffered saline (PBS), the MTT working solution was added and incubated for 4 h. The supernatant was aspirated and dimethyl sulfoxide (DMSO) was added to dissolve the insoluble formazan product. The cellular viability was measured using the absorbance at 490 nm on a multifunctional plate reader (MD M5, Molecular Devince, San Jose, USA).
In vitro catalytic performance of SP-Au
4T1 cells were seeded in 96-well plates at 8 × 10³ cells per well overnight in a hypoxic incubator (1% O2). Blank DMEM medium, Au NCs (20 µg/mL), or SP-Au (equivalent to 20 µg/mL Au NCs) was added and the plates were illuminated under 4600 lx red light (615 ∼ 650 nm) for 15 min. The cells were then stained with superoxide anion selective dihydroethidium (DHE), and visualized under a fluorescence microscope (Zeiss, Oberkochen, Germany).
In vitro evaluation of SP-Au based radiosensitization
4T1 cells were seeded in6-well plates at 2 × 10⁵ cells per well and incubated overnight at 37 °C in in a hypoxic incubator (1% O2). DMEM medium, Au NCs (20 µg/mL), or SP-Au (equivalent to 20 µg/mL Au NCs) was then added with or without GSH (2 mM), and illuminated with 4600 lx red light (615 ∼ 650 nm) for 15 min. The plates were exposure to X-ray at doses of 0, 3, 6, and 9 Gy, respectively. The cells were culture for 7 more days for the formation of colonies (≥ 50 cells), which were subsequently stained with Giemsa and counted. The produced ROS was stained right after irradiation at a dose of 6 Gy using a DCFH-DA assay kit (YEASEN, Shanghai, China) The staining of Live/dead cells, were conducted using a Calcein-AM/PI double stain kit (YEASEN, Shanghai, China).
In vivo biodistribution of SP-Au
Animal studies were approved by the Institutional Animal Care and Use Committee of Zhejiang University. Balb/c mice bearing 4T1 tumors were injected intravenously (i.v.) with SP-Au (150 µL, 200 µg mL− 1), and then monitored on an IVIS Lumina LT Series III scanner (Perkin Elmer, Massachusetts, USA) at 0.5, 1.5, 2.5, 4, 7, and 24 h post-injection. The tumors and major organs (heart, liver, spleen, lung, and kidney) were then collected and imaged ex vivo at 2.5, 7 and 24 h post-injection.
In vivo biodegradability of SP-Au
SP-Au sample (100 µg/mL) was suspended in DMEM solution, added into 24-well plates pre-seeded with 1 × 10⁵ 4T1 cells per well, and then incubated in a 5% CO2 atmosphere at 37 °C. After 6 h, the SP-Au samples were imaged under a fluorescence microscope (Zeiss, Oberkochen, Germany). To investigate the renal clearance of SP-Au, mice were intravenously injected with SP-Au (150 µL, 200 µg/mL). At 0, 3, 6, 12, 24, 48, and 72 h post injection, urine samples were collected and characterized on an RF-6000 fluorescence spectrophotometer (Shimadzu, Kyoto, Japan).
In vivo catalytic performance of SP-Au
4T1 tumor-bearing mice were injected intravenously with 150 µL PBS, Au NCs (40 µg/mL); SP (200 µg/mL), or SP-Au (equivalent to 40 µg/mL Au NCs) [38, 52]. At 2.5 h post-injection, the mice were illuminated with red light (615 ∼ 650 nm, 4600 lx) for 15 min. Subsequently, mice in Light + RT, Au + Light + RT, SP + Light + RT and SP-Au + Light + RT groups were further treated with 6 Gy X-ray irradiation. After 30 min, the 4T1 tumors were collected for the preparation of frozen sections and staining with DHE or DCFH-DA.
Radiosensitization of intratumorally/intravenously injected SP-Au
Two tumor models, 4T1 and A549, were used to validate the intratumoral and intravenous administration of SP-Au, respectively. BALB/c mice were used for the 4T1 tumor model and BALB/c nude mice were used for the A549 tumor model. Mice bearing 4T1 or A549 tumors were randomly allocated into eight groups once the tumor volume reached 100 mm3: Control, Au, SP, SP-Au, RT, Au + RT, SP + RT and SP-Au + RT (n = 5 per group). Mice in the control and RT group were injected intratumorally/intravenously with 50/150 µL saline. Mice in the Au, SP, SP-Au, Au + RT, SP + RT and SP-Au + RT groups were injected intratumorally with 50/150 µL of respective catalysts: Au NCs (40 µg/mL), SP (200 µg/mL); or SP-Au (40 µg/mL) [38, 39, 52]. At 2.5 h post-injection, the mice were illuminated with red light (615 ∼ 650 nm, 4600 lx, 15 min), and those in RT, Au + RT, SP + RT, and SP-Au + RT groups were irradiated with 6 Gy X-ray. Tumor size was measured using a digital caliper and calculated as volume (mm3) = length × width2 × 0.5. All the mice were sacrificed on day 18 (4T1 tumors) or day 10 (A549 tumors) after enrollment. Tumors and major organs (heart, liver, spleen, lung, and kidney) were excised and fixed in 4% paraformaldehyde. Hematoxylin and eosin (H&E) sections were scanned on a virtual slide microscopy (Olympus VS120, Olympus Life Sciences, Waltham, MA, USA). Unstained sections were stained for CD31, Ki-67, or HIF-1α.
In vivo toxicity of SP-Au
Mice (n = 3) were intravenously injected with 150 µL of PBS or SP-Au (500 µg/mL), and sacrificed 24 h later. Blood samples were obtained for routine blood chemistry and biochemical analysis.
Statistical analysis
All data were presented as the mean ± standard deviation or mean. Statistical significance was determined using Student’s t-test. P values less than 0.05 were considered statistically significant and indicated in Fig.s and/or legends as ***P < 0.001; **P < 0.01; *P < 0.05.


留言 (0)