Cell culture
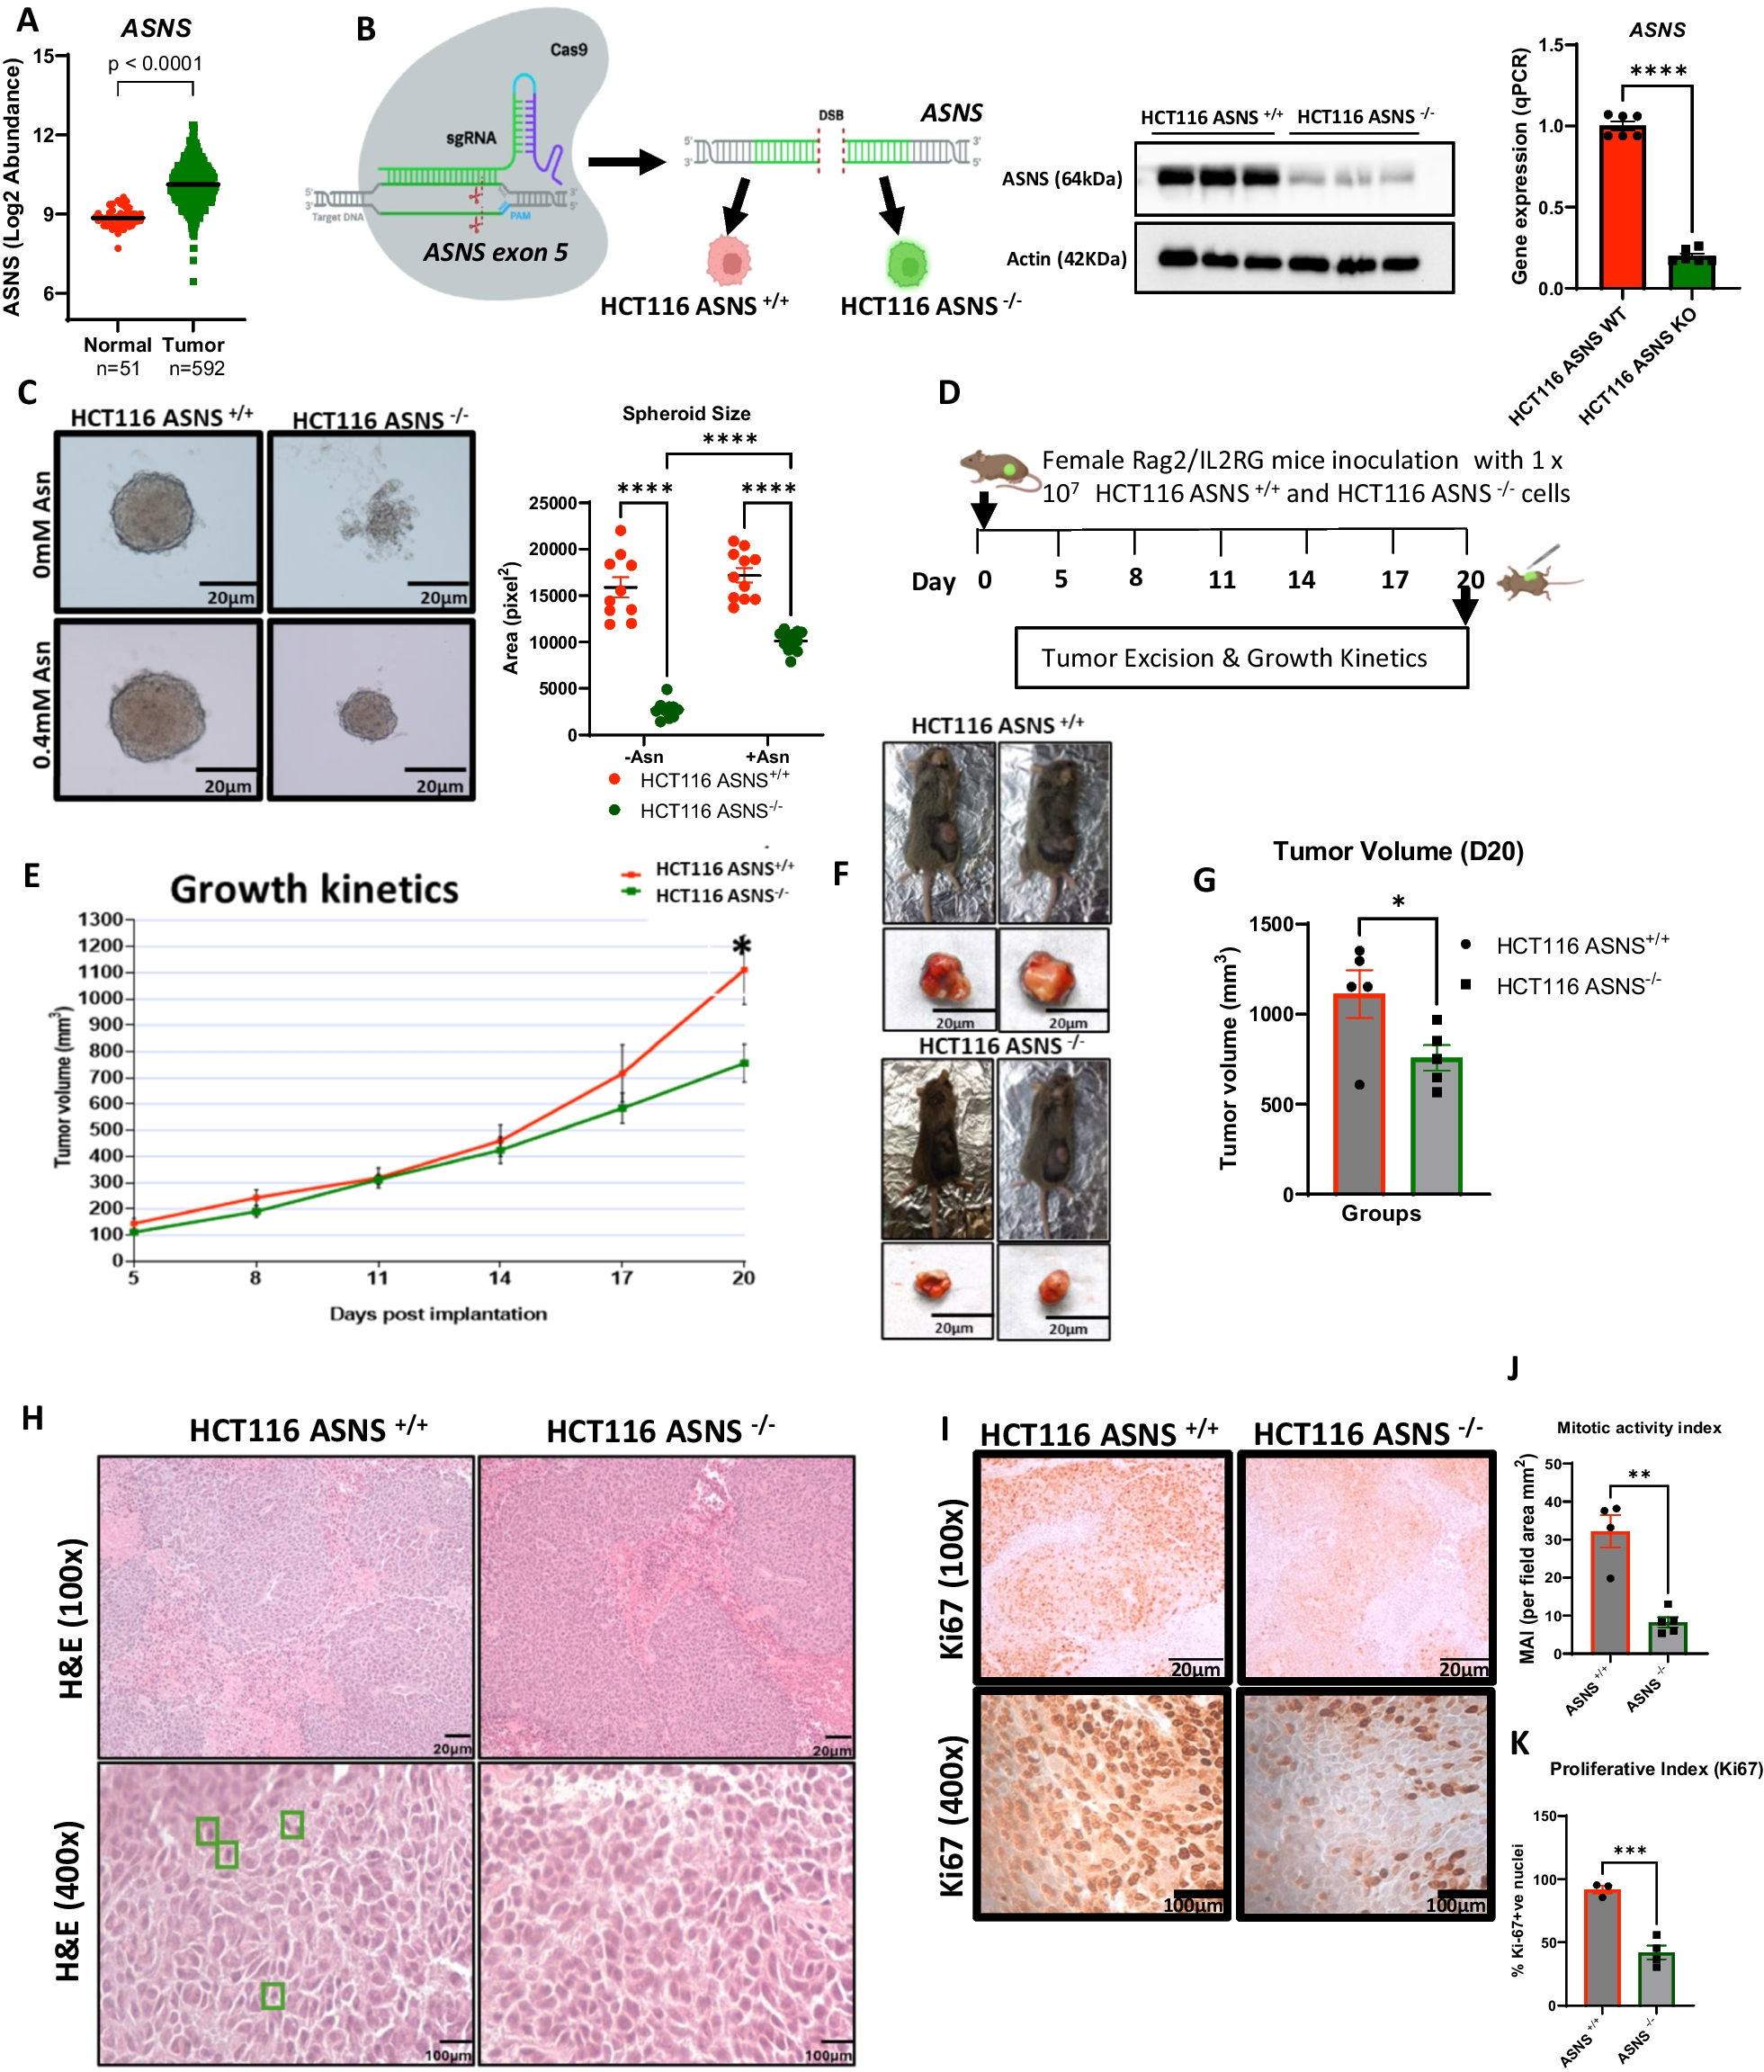
Human CRC HCT116 cell lines were obtained from American Type Culture Collection (ATCC) (Manassas, VA, USA). CRISPR-Cas9 editing was performed to generate HCT116 ASNS wild-type (ASNS+/+) and HCT 116 ASNS knock-out (ASNS−/−) (Synthego Corp, Redwood City, (CA, USA)). HCT116 ASNS−/− cell lines were generated using a CRISPR-mediated gene knockout. The wildtype pool was mock transfected with Cas9 which served as control cell line for the downstream experiment. ASNS−/− status was confirmed by western blot analysis. Cells were maintained in Dulbecco’s Modified Eagle Medium (DMEM) (Thermo Fisher Scientific, Waltham, MA, USA) with 10% fetal bovine serum (Life Technologies, Carlsbad, CA, USA) and 1% penicillin/streptomycin (Life Technologies, Carlsbad, CA, USA) and 4 mM L-Glutamine (Life Technologies, Carlsbad, CA, USA). For the L-asparaginase (L-Asp) experiment, both HCT116 ASNS+/+ and ASNS−/− cells were grown in RPMI-1640 culture medium (Thermo Fisher Scientific, Waltham, MA, USA) with sufficient asparagine and supplemented with 4 mM glutamine to scale up before exposure to L-Asp. For the metabolomics analysis, HCT116 ASNS+/+ and HCT116 ASNS−/− cells were cultured in RPMI-1640 and supplemented with 4 mM glutamine. Cells were cultured at 37 °C and under 5% CO2. All experiments were performed at 90% cell confluency with no more than ten [10] cell passages. After three [3] passage rounds, cells were screened for biological contaminants at the Molecular Diagnostics laboratory (Yale University School of Medicine) and were declared to be pathogen-free. Amino acid composition of asparagine-depleted medium is presented in Supplementary Table S3.
Thawing process
Cells were stored in LN2 and placed in a temperature-controlled water bath for 2 min 50 s equilibrated to 37 °C according to a previously reported standard method for thawing conventional cryovials [20]
Formation of 3D spheres using hanging- drops
Adherent cell cultures were grown to at least 90% confluence before rinsing off monolayers with PBS. Cells were trypsinized using 0.05% trypsin with EDTA and incubated at 37 °C until cells detach. Trypsinization was stopped by adding 2mls of complete medium before transfer to a 15 ml conical tube. Cells were counted using a hemacytometer. 20 μl droplets were deposited onto a 100 mm tissue culture plate lid ensuring that each droplet was placed sufficiently apart. Lid was inverted onto a PBS-filled bottom chamber and incubated at 37 °C/5% CO2 and 95% humidity. At least 10 droplets/treatment group were deposited for the medium-asparagine depletion experiment. For the L-asparaginase experiment, at least 8 droplets/treatment condition were deposited onto the culture plate. Sizes of formed spheroids were evaluated using a light microscope.
Animal experiments
Rag2/IL2RG double knockout (R2G2) immunocompromised mice, having reduced functions of T, B and Natural Killer (NK) cells, were obtained from Charles River Laboratories (Wilmington, MA, USA) at 4 weeks old. Animals were held in the Yale West Campus Animal husbandry unit until ready for xenograft (IACUC #2021-20218).
In vivo tumorigenesis
HCT116 ASNS+/+ and HCT116 ASNS−/− were grown in complete medium and harvested for in vivo studies. 1 × 10⁷ cells were implanted subcutaneously (s.c) into the flanks of R2G2 mice. Tumor sizes were obtained in two dimensions by measuring with calipers every three days. Tumor volumes were calculated using the formular V = (L × W2)/2, where L is length and W represents width.
In study 1, ten female R2G2 mice were used for the tumorigenicity experiment. HCT116 ASNS−/− and HCT116 ASNS+/+ were implanted subcutaneously (s.c) into the flank of each mouse (n = 5/group). Animal survival was evaluated from the day of cell line implantation until the mice became moribund according to predetermined criteria that includes a tumor volume of ≥ 1 cm3 [21, 22]. Animal husbandry and experimental procedures were carried out under approval from Yale University Institutional Animal Care and Use Committee (IACUC #2021-20218). All the animals were housed in specific-pathogen free (SPF) conditions and automatically supplied rodent chow (Teklad #2018S, Envigo, Indianapolis, IN, USA) and water ad libitum.
Once tumorigenicity was confirmed, 40 R2G2 mice (n = 20 female, n = 20 male) were divided into four groups for a tumor-specific survival experiment (Study 2); of note the tumor metabolomics analyses were performed in this mice cohort. In the survival study the following groups were constructed; group I included R2G2 male mice that were injected with HCT116 ASNS+/+ cell lines; group II included R2G2 male mice that were injected with HCT116 ASNS−/− cell lines; group III, included R2G2 female mice that were injected with HCT116 ASNS+/+ cell lines; group IV included R2G2 female mice that were injected with HCT116 ASNS−/− cell lines. For studies 1–2, each mouse received 1 × 10⁷ cells that were implanted subcutaneously (s.c) into the flank.
For study 1, mice were euthanized at day 20 as tumors in the HCT116 ASNS+/+ group reached 1000 mm3 which is the maximum tumor volume allowed by our protocol. At the time of euthanasia for both studies, a small section of tumor mass was examined grossly, fixed in 10% neutral buffered formalin and was used in making formalin-fixed paraffin-embedded (FFPE) blocks; while a second section of tumor mass was flashed frozen in liquid nitrogen (LN2).
Histopathology
FFPE tissues from the tumorigenicity and survival studies were sectioned at 5 µm, stained with hematoxylin and eosin for histologic examination as previously described [23]. Unstained slides were subjected to immunohistochemical analysis. Briefly tissue sections were deparaffinized, antigen retrieved in 10 mM sodium citrate and incubated with 3% hydrogen peroxide for 20 min at room temperature (RT). Sections were blocked with 10% goat serum and incubated overnight at 4 °C with primary antibodies: cyclin D1 (CME432, Biocare Medical, Pacheco, CA, USA), phospho-histone H3 (#9701, Cell Signaling Technology, Danvers, MA, USA), F4/80 (#70,076, Cell Signaling Technology, Danvers, MA, USA) and Ki67 (CRM325, Biocare Medical, Pacheco, CA, US). Sections were then incubated with secondary antibody for 30 min at room temperature, followed by signal detection using 3,3’-diaminobenzidine (DAB) solution (#SK-4105, Vector Laboratories Inc., Newark, CA, USA). Tissues were counterstained with hematoxylin. A pathologist with expertise in gastrointestinal pathology examined representative sections.
Mitotic activity index
The mitotic activity index of the tumor cells was defined as either the number of tumor cells with mitotic figures (representing dividing cells) or Ki67-positive tumor cells, divided by total number of tumor cells. For quantitative evaluations, a minimum of ten fields (40x) was selected and mitotic activity index was calculated as the average number of pHH3+ cells per field. At least 3 representative samples were randomly selected from each group in study 1 and 2.
Drugs and chemicals
G1(1-((3aR,4S,9bS)-rel-4-(6-Bromobenzo[d][1,3]dioxol-5-yl)-3a,4,5,9b-tetrahydro-3H-cyclopenta[c] quinolin-8-yl)ethanone, 98%, a GPER1 agonist, was purchased from Ambeed, #A287698 (CAS: 881,639–98-1, Arlington Heights, IL, USA). L-asparaginase (#ENZ-287-500 IU) was purchased from Peptide International Inc (Louisville, KY, USA).
Immunoblot
To confirm the efficiency of the CRISPR-Cas9 Knock out system, we assessed the relative protein expression of ASNS in the HCT116 ASNS+/+ and ASNS−/− mutant cell lines using western blot. We also confirmed the expression of GPER1 in HCT116 ASNS+/+ cells after pharmacological modulation with estradiol and G1 (a known GPER1 agonist). Proteins were extracted by homogenization using 1 × RIPA buffer with protease inhibitor (#5,892,970,001, Roche, Basel, Switzerland). The homogenates were centrifuged at ≥ 10,000 g at 4 °C, and the supernatants were heated for 10 min in 1 × sodium dodecyl sulfate (SDS) sample buffer for protein denaturation. After a brief centrifugation, 30 μg of protein was resolved on SDS–polyacrylamide gels and transferred to nitrocellulose membranes by voltage gradient transfer. The membranes were incubated in 3% bovine serum albumin in TBST buffer for one hour to block non-specific binding; then incubated with primary antibodies (anti-ASNS: #sc-365809, Santa Cruz biotechnology, Dallas, TX, USA; anti-GPER1: #ab260033, Abcam Biotechnology, Cambridge, UK; anti-GAPDH #ab181602, Abcam Biotechnology, Cambridge, UK) containing 3% bovine serum albumin in TBST at 4 °C overnight. Membranes were then washed and incubated with secondary antibodies coupled to horseradish peroxidase for 1 h. The bands were detected using a chemiluminescence reagent kit (#PI32106, Thermofisher Scientific, Waltham, MA, USA). Quantification of band intensity was performed on all stained blots using Image J processing software. For GPER1 antibody which detect an additional band of GPER heterodimers (above the 50 kDa ladder), the lower band was selected and normalized to house keeping protein (GAPDH). Inverted background value was subtracted from all membranes and expression is reported as the net ratio of either ASNS or GPER1 protein to GAPDH.
Tissue microarray
Corresponding paraffin tissue blocks of R2G2 mice tumors (HCT116 ASNS+/+ female, HCT116 ASNS−/− female, HCT116 ASNS+/+ male and HCT116 ASNS−/− male; n = 5 mice tumors/group) were retrieved and transferred into a recipient block or tissue microarray (TMA). TMA cores were punched out using a 0.6 mm diameter tool for up to 2 punches per tumor block and transferred onto digital slides. H&E slides from selected mouse tumors were also retrieved. Blocks and slides were compared in an identical manner using an annotated grid. Immunohistochemistry of Ki67, cyclin D1 and pHH3 were conducted on TMA slides. Ki67, cyclin D1 and pHH3-positive cells were counted using Image J processing software.
RNA-sequencing
RNA-seq was performed on female mice tumors from the tumorigenicity study (n = 4 HCT116 ASNS+/+ and n = 4 HCT116 ASNS−/−). Libraries were prepared with total RNA using the Total RNA TruSeq mRNA Stranded Library Prep Kit (Illumina, San Diego, CA, USA). Briefly, mRNA pulldown was performed using an oligodT primer attached to magnetic beads. The libraries were quantified using the Qubit dsDNA HS assay kit (Thermofisher Scientific, Waltham, MA, USA) and an Agilent 2100 Bioanalyzer. Pooled library was sequenced on an efficient ultra-high-throughput sequencer using the NovaSeq 6000, an instrument with a patterned flow cell technology which provides the highest throughput across multiple applications (Illumina) according to the manufacturer’s protocol. A detailed sequencing procedure is described in the supplementary material and method section.
Quantitative real-time PCR
Total RNA was isolated from tumors of HCT116 xenografts using the RNA isolation kit (Rneasy Mini Kit, QIAGEN, Hilden, Germany). RNA quality control was determined as described above for RNA sequencing. Extracted RNA was reversed transcribed to generate complementary DNA (cDNA) using the iScript cDNA synthesis kit (Bio-Rad, Hercules, CA, USA) following the manufacturer’s instructions. cDNA was diluted in nuclease-free water before it was utilized for gene expression by qRT-PCR. Quantitative real-time PCR analysis was performed on technical duplicates of cDNA derived from Study 1: HCT116 ASNS+/+ female group (n = 4) and ASNS−/− female group (n = 3) and Study 2: HCT116 ASNS+/+ male (n = 8), HCT116 ASNS−/− male (n = 8), HCT116 ASNS+/+ female (n = 10) and HCT116 ASNS−/− female (n = 8–9) groups, using iTaq SYBR Green (Bio-Rad, Hercules, CA, USA), and predesigned validated primers on CFX96 Touch Real-Time PCR Detection System (Bio-Rad, Hercules, CA, USA). Primer sequences for qRT-PCR are reported below:
hGPER1 fw 5′-ACAAACCCAACCCAAACCAC-3′
hGPER1 rev 5′-CACCGTGCAGCTTTCAAGAT-3′
hASNS fw 5′- GACTTCACCTGATAAAAGGCAGC-3′
hASNS rev 5′- TTGAAGCACTCCGCGACTCC-3′
hGAPDH fw 5′- GCAGGGGGGAGCCAAAAGGG-3′
hGAPDH rev 5′- TGCCAGCCCCAGCGTCAAAG-3′
Untargeted mass spectrometryTumor metabolite extraction
Tumor metabolomics was performed on tumors from the survival study. 40 tumors, at 50 mg tumor tissue was homogenized in 500 μL UPLC-grade H2O using a Precellys Evolution cryo-homogenizer (Bertin Corp. Rockville, MD, USA). 2 mL lysis tubes containing 1.4 mm ceramic (zirconium oxide) beads were utilized for the homogenization step. Prior to homogenization, tissue samples were cut on a pre-chilled cutting board kept on dry ice. During homogenization, samples were kept on ice and each sample was processed at 6,000 rpm for 20 s at 6 cycles with 5 s intervals. Cryo-homogenizer was kept chilled using dry ice. 100 μL of homogenized solution was added to 1.5 mL microcentrifuge tubes (Eppendorf, Framingham, MA, USA) for subsequent metabolite extraction. A volume of ice cold 400 μL methanol:acetonitrile (1:1, v/v) was added to each sample as the extraction solvent before sonication for 10 min. Samples were incubated for 2 h at − 20 °C, followed by centrifugation at 13,000 rpm (15,000 g) and 4 °C for 15 min. To precipitate proteins and particulates, the resulting supernatant was removed and evaporated to dryness for 12 h using a vacuum concentrator (Thermo Fisher Scientific, Waltham, MA, USA). The dry extracts were then reconstituted in 100 µL of ACN:H2O (1:1, v/v), sonicated for 10 min, and centrifuged at 13,000 rpm (15,000 g) and 4 °C for 15 min to remove insoluble debris. The supernatant was transferred to UPLC autosampler vials (Thermo Fisher Scientific, Waltham, MA, USA). A pooled quality control sample was prepared by mixing 2 μL of extracted solution from each sample into a UPLC autosampler vial. All the vials were capped and stored at − 80 °C prior to UPLC-MS analysis.
UPLC-MS-based metabolomics analysis
Hydrophilic interaction chromatography (HILIC) and reverse-phase liquid chromatography (RPLC)-mass spectrometry (MS) approaches were used for comprehensive analysis of the tissue metabolome and have been described previously [14]. Briefly a UPLC system (H-Class ACQUITY, Waters Corporation, MA, United States) coupled to a quadrupole time-of flight (QTOF) mass spectrometer (Xevo G2-XS QTOF, Waters Corporation, Milford, MA, United States) was used for MS data acquisition. A Waters ACQUITY UPLC BEH Amide column and Waters ACQUITY UPLC BEH C18 column were used for the UPLC-based separation of metabolites. Column temperature was kept at 25 °C for HILIC-MS analysis and 30 °C for RPLC-MS analysis. Sample injection volume was 1 μL. The solvent flow rate was 0.5 mL/min. For HILIC-MS analysis, mobile phase A was 25 mM NH4OH and 25 mM NH4OAc in water, while the mobile phase B was ACN for both electrospray ionization (ESI) positive and negative mode, respectively. The linear gradient was set as follows: 0–0.5 min: 95% B; 0.5–7 min: 95% B to 65% B; 7–8 min: 65% B to 40% B; 8–9 min: 40% B; 9–9.1 min: 40% B to 95% B; 9.1–12 min: 95% B. For RPLC-MS analysis, the mobile phases A was 0.1% formic acid in H2O, while the mobile phases B was 0.1% formic acid in ACN, respectively for both ESI+ and ESI− . The linear gradient was set as follows: 0–1 min: 1% B; 1–8 min: 1% B to 100% B; 8–10 min: 100% B; 10–10.1 min: 100% B to 1% B; 10.1–12 min: 1% B. Pooled samples were analyzed at specified injections interval during the UPLC-MS analysis to monitor the stability of the data acquisition and used for subsequent data normalization. QTOF-MS scan data (300 ms/scan; mass scan range 50–1000 Da) was initially acquired for each biological sample for metabolite quantification. Then, both DDA (data-dependent acquisition) data (QTOF MS scan time: 50 ms/scan, MSMS scan time 50 ms/scan, collision energy 20 eV, top 5 most intense ions were selected for fragmentation, exclude former target ions (4 s after 2 occurrences)) and MS2 data (low energy scan: 200 ms/scan, collision energy 6 eV; high energy scan: 100 ms/scan, collision energy 20 eV, mass scan range 25–1000 Da) were acquired for QC samples to enable metabolite identification. ESI source parameters on the Xevo GS-XS QTOF were set as following: capillary voltage 1.8 kV, sampling cone 40 V, source temperature 50 °C, desolvation temperature 550 °C, cone gas flow 40 L/Hr, desolvation gas flow 900 L/Hr.
UPLS-MS data processing
Raw MS data (.raw) were converted to mzML files using ProteoWizard MSConvert (http://proteowizard.sourceforge.net/). The files were then processed in R (version 4.2.1) using the XCMS package for feature detection, retention time correction and alignment. The XCMS processing parameters were optimized and set as follows: mass accuracy for peak detection = 25 ppm; peak width c = (2, 30) ; snthresh = 6; bw = 10; mzwid = 0.015; minfrac = 0.5. The CAMERA package was used for subsequent peak annotation. The resulting data were normalized using the support vector regression algorithm in R to remove unwanted system error that occurred among intra- and inter- batches. Initial metabolite identification was performed using the MetID (metabolomics standard initiative level 1). Metabolites were further identified by matching retention time with an in-house metabolite standard library.
Quantification and statistical analysis
Kaplan–Meier survival curves were compared by log-rank test. Mantel-Cox Chi square test of association was used to determine significance. For the tumor kinetics in study 2, two-way ANOVA with mixed-effects model was used to accommodate the maximum tumor volume reached in several of the HCT116 ASNS+/+ male mice starting day 9 post tumor implantation. Multiple comparisons were adjusted using Benjamini and Hochberg’s FDR method. Tumor volume for each time point was considered significant difference if q value is less than 0.05. For differential gene expression (DEG), comparison was determined using a negative binomial distribution test. Individual dot plots of RPKM are represented as the mean ± standard error of mean (SEM) with at least n = 4 per group and p values determined by unpaired student’s t test. For gene expression assay in study 2, statistical significance was determined using, two-way ANOVA. For all the qRT-PCR reactions, relative quantification of mRNA levels by the ΔΔCT method was performed after normalization of total cDNA to endogenous GAPDH. For metabolomics analysis, normalized metabolite abundances were uploaded in Metaboanalyst and Welches t-test was applied to compare metabolite abundances between sample groups. p values were adjusted for multiple testing with Benjamini-Hochberg-based FDR. For the immunohistochemistry analysis, individual dot plots represent mean ± SEM of at least 3 representative samples from each group of HCT116 ASNS xenografts.
Bioinformatics analysis
Functional enrichment analysis of differentially expressed genes by hierarchical clusters was performed using the Gene Set Enrichment Analysis (GSEA), a tool that offers a robust analytic technique for molecular profiling data [24]. Top canonical pathways and cellular functions involving differentially expressed transcripts (gene set > 15) using normalized expression count and weighted enrichment statistic. DEGs used in pathway analysis were determined between HCT116 ASNS−/− and HCT116 ASNS+/+ by using a filtering criterion: fold change (FC) > 2.0 and q < 0.05. Ingenuity Pathway Analysis (IPA) (QIAGEN Redwood City, USA) was used to identify specific pathways and functions across sample groups. An unadjusted p-value was used to determine gene set enrichment as our hypothesis is that a coordinated change to a broad number of genes can aid in the prediction of changes to the greater signaling network. Top canonical pathways involving differentially altered metabolites (using metabolites with adjusted p-value < 0.05) were calculated based on the Fisher’s right-tailed exact test. Metabolomics profiling was conducted using IPA and violin plots were generated on Graphpad Prism Software (version 10).

留言 (0)