
記住我
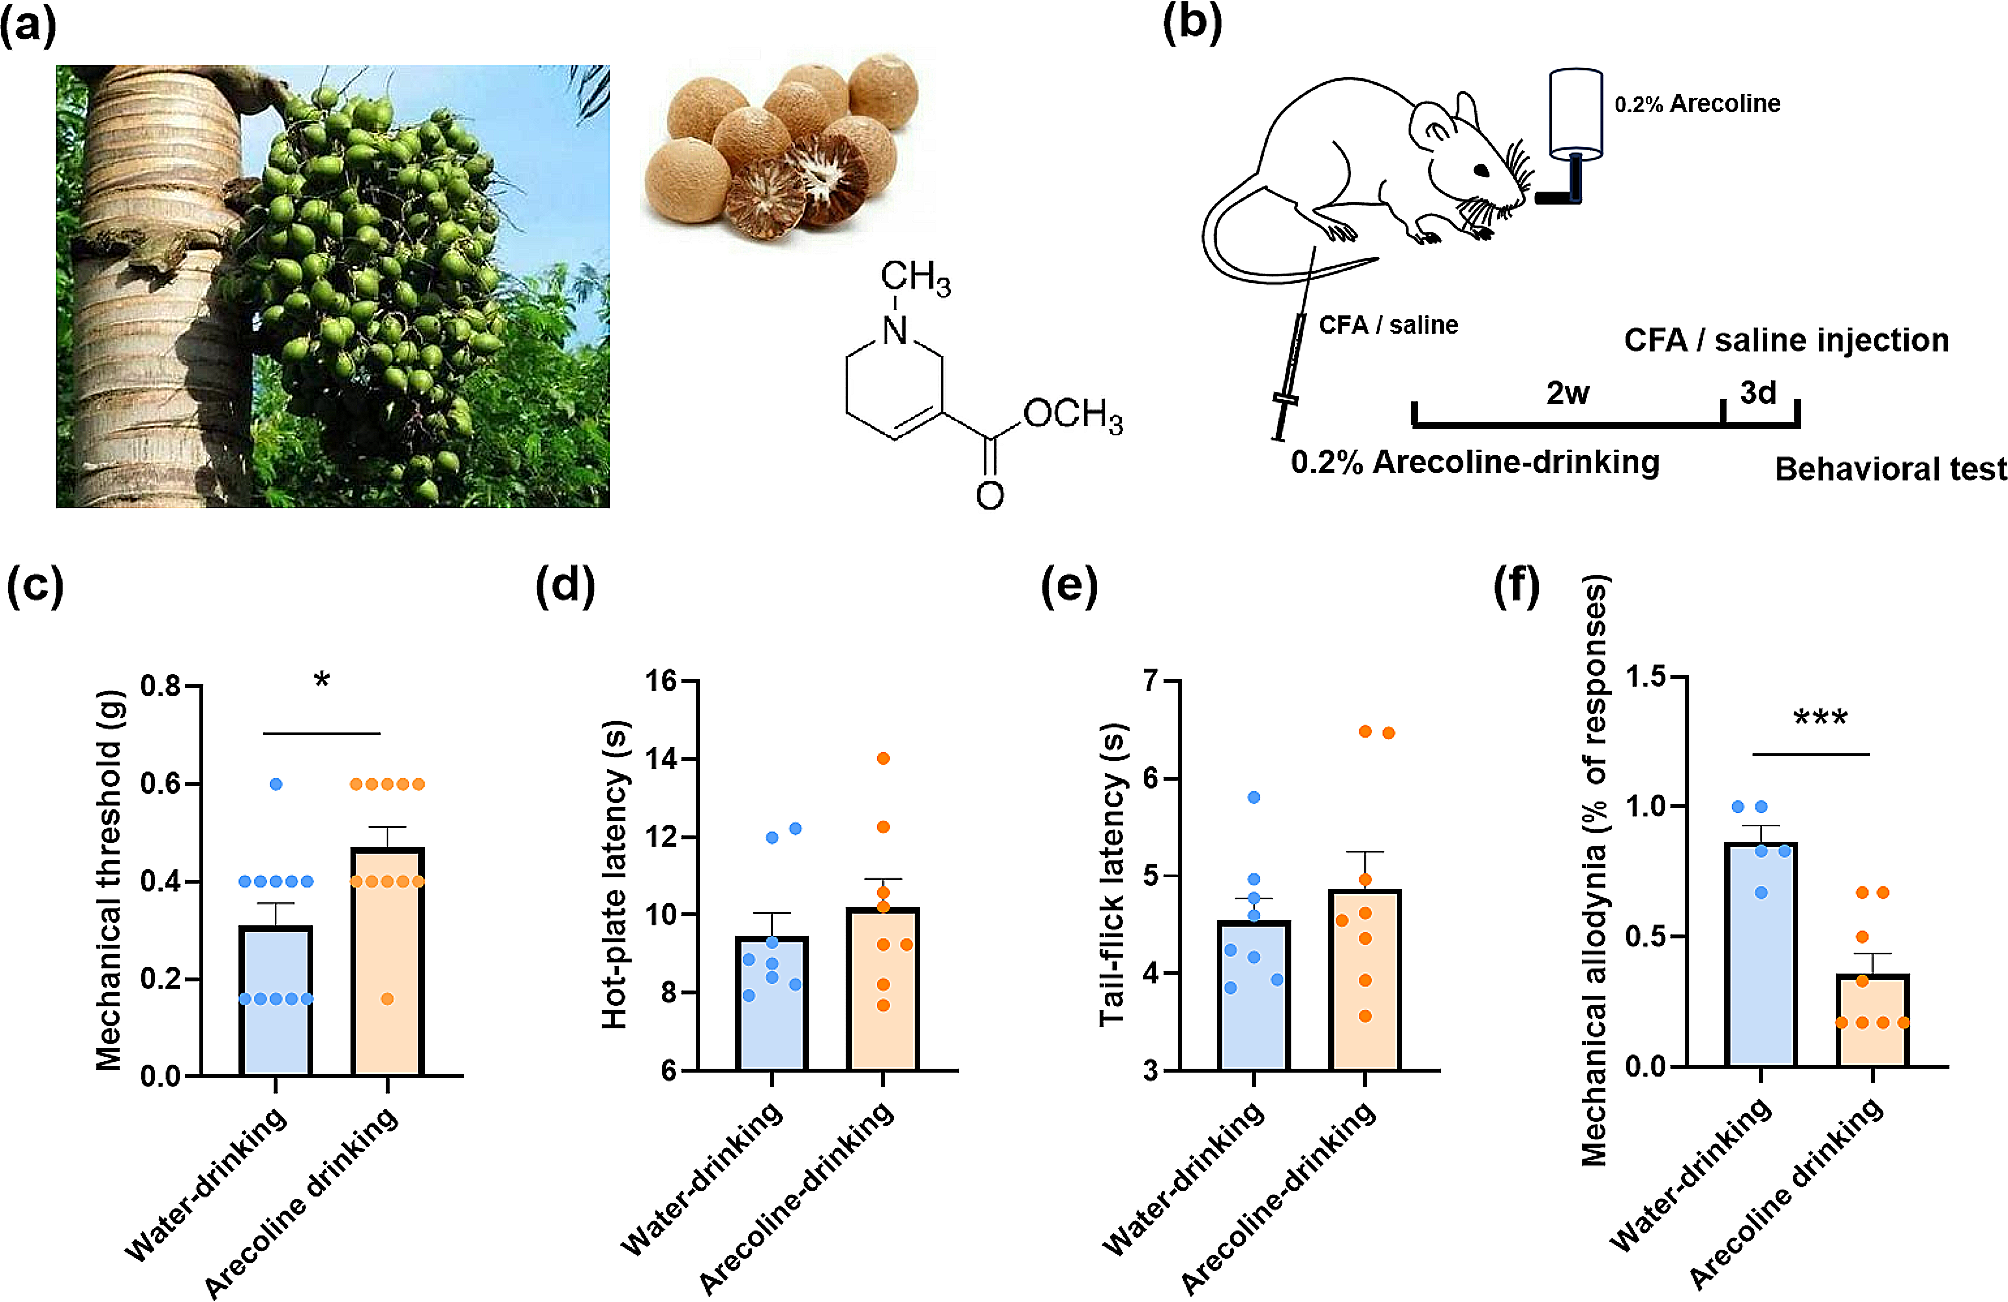

The arecoline is subtracted from the areca nuts (Fig. 1a). To investigate the effect of arecoline on pain behavior, we added the arecoline (0.2%) into the drinking water of the mice and let them drink ad libtum for 2 weeks (Fig. 1b). Drinking arecoline increased the mechanical nociceptive threshold (Water-drinking: 0.31 ± 0.05 g vs. arecoline-drinking 0.47 ± 0.04 g, unpaired t-test, t(20) = 2.5, p = 0.02, n = 11 for arecoline-drinking group, n = 11 for the water-drinking group, Fig. 1c) without affecting the thermal pain (For the hot-plate test, water-drinking 9.5 ± 0.6 s vs. arecoline-drinking 10.2 ± 0.8 s, unpaired t-test, t(14) = 0.76, p = 0.46, n = 8 for arecoline-drinking group, n = 8 for the water-drinking group, Fig. 1d; For the tail-flick test, water-drinking: 4.5 ± 0.2 s vs. arecoline-drinking 4.9 ± 0.4 s, unpaired t-test, t(14) = 0.73, p = 0.48, n = 8 for arecoline-drinking group, n = 8 for the water-drinking group, Fig. 1e). On the 3rd day after the intraplantar injection of CFA, the allodynia was alleviated (water-drinking 0.87 ± 0.05 vs. arecoline-drinking 0.36 ± 0.09, unpaired t-test, t(11) = 4.5, p = 0.0009, n = 8 for arecoline-drinking group, n = 5 for the water-drinking group, Fig. 1f) These results indicate that the arecoline reversed the mechanical hypersensitization in mice.
Fig. 1
The analgesic effect of drinking arecoline on acute and inflammatory pain in mice. (a) Photographs of the fresh and dry betel nuts and the structural formula of the arecoline. (b) Schematic showing the arecoline (0.2%) was added into the water bottle of the mice and let them drink for 2 weeks. CFA was injected three days before the behavioral test. (c) The mechanical threshold of the naive mice drinking water (blue) or arecoline (orange). *p < 0.05, compared to the water-drinking group. n = 11 for arecoline-drinking group, n = 11 for the water-drinking group. (d) Latency on the 55℃ hot plate of naive mice drinking water or arecoline. n = 8 for arecoline-drinking group, n = 8 for the water-drinking group. (e) Tail-flick latency of naive mice drinking water or arecoline. (f) The mechanical allodynia of the CFA model drinking water or arecoline. ***p < 0.001, compared to the water-drinking group. n = 8 for arecoline-drinking group, n = 5 for the water-drinking group
Arecoline alleviates the anxiety and depression induced by CFA injectionTo further investigate the effect of the arecoline on the emotional component of the CFA-induced pain, we measured the anxiodepressive behavior after the animals drank the 0.2% arecoline for 2 weeks. The CFA-injected mice showed decreased exploration in the open arms compared to the sham group (for the water-drinking group, CFA 10.8 ± 2.9% vs. Sham 28.4 ± 5.4%, two-way ANOVA, F (1, 34) = 7.752, Sidak’s multiple comparisons test, p = 0.02, n = 9 for CFA group, n = 10 for the sham group). Arecoline reversed this anxiety-like phenomenon (for the arecoline-drinking group, CFA 20.6 ± 3.1% vs. Sham 28.9 ± 5.8%, Sidak’s multiple comparisons test, p = 0.40, n = 9 for CFA group, n = 10 for the sham group, Fig. 2a to c). However, in the open-field test, arecoline did not show a significant difference in the time in the center area (for the water-drinking group, CFA 8.4 ± 1.9% vs. Sham 8.0 ± 0.6%, two-way ANOVA, F (1, 36) = 0.94, Sidak’s multiple comparisons test, p = 0.98, n = 10 for CFA group, n = 10 for the sham group; for the arecoline-drinking group, CFA 12.1 ± 2.1% vs. Sham 9.3 ± 1.6%, Sidak’s multiple comparisons test, p = 0.42, n = 10 for CFA group, n = 10 for the sham group, Fig. 2d to f). These data indicate that the arecoline has an anxiolytic effect on the CFA mice.
To observe the effect of arecoline on depression-like behavior, we did the forced-swim test (FST) and the tail-suspension test (TST). Arecoline decreased the immobility time in both the CFA and sham mice in the FST (for the CFA group, water-drinking 64.4 ± 1.6% vs. arecoline-drinking 35.6 ± 5.9%; for the sham group, water-drinking 66.6 ± 6.5% vs. arecoline-drinking 17.5 ± 4.4%, two-way ANOVA, F (1, 16) = 61.06, in CFA group, Sidak’s multiple comparisons test, p = 0.0017, n = 5 for the water-drinking group, n = 5 for the arecoline-drinking group; in the sham group, Sidak’s multiple comparisons test, p < 0.0001, n = 5 for water-drinking group, n = 5 for the arecoline-drinking group, Fig. 2g). In the TST, only mice in the sham group showed decreased immobility after drinking the arecoline (for the CFA group, water-drinking 52.8 ± 3.5% vs. arecoline-drinking 45.0 ± 4.4%; for the sham group, water-drinking 47.9 ± 4.4% vs. arecoline-drinking 28.8 ± 3.8%, two-way ANOVA, F (1, 22) = 9.70, in CFA group, Sidak’s multiple comparisons test, p = 0.38, n = 5 for the water-drinking group, n = 8 for the arecoline-drinking group; in sham group, Sidak’s multiple comparisons test, p = 0.0098, n = 5 for water-drinking group, n = 8 for the arecoline-drinking group, Fig. 2h). These data indicate that arecoline causes anti-depressive effects.
Fig. 2
The anxiolytic and anti-depressive effect of drinking arecoline in the CFA-injected mice. (a) Representative traces of mice in CFA or sham group drinking water or arecoline in the EPM (open arms in pink, closed arms in green). (b) The percentage of time in the open arms for CFA + water-drinking, CFA + arecoline-drinking group, sham + water-drinking group, and sham + arecoline-drinking group. n = 9 for the CFA group, n = 10 for the sham group, *p < 0.05, compared to the water-drinking mice in the CFA group. (c) The number of total entries in the EPM for the four groups. (d) Representative traces of mice in CFA or sham group drinking water or arecoline in the OF (center area in pink, peripheral area in green). (e) The percentage of time in the center area of the OF for the four groups. n = 10 for CFA group, n = 10 for the sham group. (f) The number of total travel distances in the OF for the four groups. (g) The percentage of time of immobility in the FST for the four groups. n = 5 for CFA group, n = 5 for the sham group. **p < 0.01, ***p < 0.001, compared to water-drinking group. (h)The percentage of time of immobility in the TST for the four groups. n = 5 for CFA group, n = 5 for the sham group. **p < 0.01, compared to water-drinking group
Arecoline inhibits the excitatory field potentials in the anterior cingulate cortexSince the ACC plays an important role in pain-related anxiety, we observed the effect of arecoline on the coronal slices of the ACC by using the 64-electrode recording system. As shown in Fig. 3a and b, one channel in the superficial layer of the ACC (layer II/III) was chosen as the stimulation site, and the other 63 channels were used for measuring evoked responses. We found that local stimulation induced widespread fEPSPs within the ACC. After bath application of the arecoline (1 µM), the fEPSPs were temporarily inhibited (80.0 ± 5.0% of baseline, 25 channels/3 slice/3 mice, Fig. 3c and d). After increasing the dose of arecoline to 10 µM and 100 µM, the duration and the percentage of inhibition increased (10 µM arecoline: 79.3 ± 3.6% of baseline, n = 25 channels /3 slice/3 mice; 100 µM arecoline: 53.8 ± 6.3% of baseline, n = 60 channels /5 slice/3 mice, Fig. 3c to f). Application of 100 µM arecoline decreased the number of active channels (40.3 ± 6.7% of baseline, n = 5 slice/3 mice, Fig. 3g, 3 h). According to previous studies, the arecoline is an agonist of cholinergic receptors. Therefore, by applying the selective antagonists of muscarinic and nicotinic receptors, we investigated their effect on the inhibition effect of arecoline. After perfusing the antagonist of muscarinic receptor atropine (100 µM), the inhibition effect of the arecoline was blocked (100.4 ± 2.2% of baseline, n = 41 channels /5 slice/3 mice, Fig. 3i). However, the antagonist of nicotinic receptor mecamylamine (100 µM) did not block the inhibition of arecoline (74.8 ± 1.7% of baseline, n = 33 channels /5 slice/3 mice, Fig. 3j). These data indicate that in the ACC, arecoline caused an inhibitory effect on excitatory transmission mainly via muscarinic receptors.
Fig. 3
The inhibition effect of arecoline on the excitatory field potentials in the ACC. (a) Microphotograph showed one example of ACC fEPSP recording by using the MED64 system. A cortex slice containing the ACC was placed on a probe with 64 electrodes (MED-P515A, 8 × 8 array). One channel of the probe (red circle) was selected as the stimulation site. (b) mapped figure showing the evoked potentials from all channels induced by one stimulation channel in the superficial layers (layer II/III) of the ACC. (c) The fEPSP slope of 7 channels from one slice of the ACC before, during, and after the application of 1 µM and 10 µM arecoline. The red line indicates the time when the arecoline was perfused. (d) Time course of the averaged fEPSP slope of 25 recorded channels in 3 slices/ 3 mice before, during, and after the application of 1 µM and 10 µM arecoline. (e) The fEPSP slope of 16 channels before, during, and after the application of 100 µM arecoline. The red line indicates the time when the arecoline was perfused. (f) Time course of the averaged fEPSP slope of 60 recorded channels in 5 slices/ 3 mice before, during, and after the application of 100 µM arecoline. (g) The polygonal diagram shows the baseline area of the activated channels with fEPSP (blue) and the decreased area after 100 µM arecoline application (red). The silenced channels are shown as green dots. In some sites, more than one green dot is shown. It means the silenced fEPSPs could be observed in the same channel in different slices. (h) Bar histogram of grouped data (n = 5 slices/3 mice) showing the percentage of silenced channels in the superficial layer of the ACC. (i) The averaged fEPSP slope of 41 recorded channels in 5 slices/ 3 mice before, during, and after the application of 100 µM atropine and arecoline. The arecoline (short red line) was perfused 15 min after the 100 µM atropine (short blue line) was perfused. (j) The averaged fEPSP slope of 33 recorded channels in 5 slices/ 3 mice before, during, and after the application of 100 µM mecamylamine and arecoline. The arecoline (short red line) was perfused 15 min after the 100 µM mecamylamine (short green line) was perfused
The inhibition effect of arecoline in the ACC is postsynapticTo further investigate the effect of arecoline on the neurons in the ACC, we performed whole-cell patch-clamp recording, we recorded the excitatory postsynaptic currents (EPSCs) and the inhibitory postsynaptic currents (IPSCs) in pyramidal neurons in the layer II/III of the ACC in mice. We found that the input (stimulation intensity)-output (EPSC or IPSC amplitude) curve was significantly shifted to the right after applying the arecoline (100 µM) compared with that in control group (n = 9 neurons/6 mice, two-way ANOVA, F (1, 81) = 22.5, p < 0.0001, Fig. 4a; n = 10 neurons/5 mice, two-way ANOVA, F (1, 102) = 50.7, p < 0.0001, Fig. 4b). We then investigate whether the arecoline changes the ratio of excitatory/inhibitory (E/I ratio). The evoked EPSCs were recorded with the holding potential of -60 mV and evoked IPSCs were recorded with the holding potential of 0 mV. We found that both the excitatory and inhibitory evoked responses were inhibited after the application of arecoline, while the evoked E-I ratio increased after applying the arecoline in comparison with baseline in the ACC (control 0.6 ± 0.1 vs. arecoline: 1.1 ± 0.2, paired t-test, t (24) = 3.598, p = 0.0014, n = 25 cells/ 11 mice, Fig. 4c). These data indicate that the arecoline inhibits the synaptic transmission in the ACC, and the inhibitory effect on the inhibitory synaptic transmission seems stronger.
To examine whether presynaptic or postsynaptic mechanisms mediate the decreased excitatory synaptic transmission in the ACC, we examined the paired-pulse ratio (PPR) was examined in ACC neurons. PPR was observed at different stimulus intervals of 35, 50, 75, 100, and 150 ms. After the application of arecoline, there was no significant change in PPR in ACC neurons compared with baseline (n = 9 neurons/6 mice, two-way ANOVA, F (1, 75) = 0.45, p = 0.50, Fig. 4d). We also recorded the PPR with fixed interval (50 ms) before and during the application of arecoline. We found that the amplitude of EPSC decreased to 50.9 ± 6.7% of baseline (n = 10 cells/4 mice, Fig. 4e), while the PPR had no significant change (Fig. 4f). These results suggest that the arecoline mainly inhibits the postsynaptic transmission in the ACC neurons.
Fig. 4
Decreased evoked synaptic transmission in layer II/III of the ACC after the application of arecoline (a) Representative traces (top) and input-output curves (bottom) of evoked EPSC in ACC slices before and after the arecoline application. n = 9 neurons/6 mice. *p < 0.05 and **p < 0.01 compared with baseline control. (b) Representative traces (top) and input-output curves (bottom) of evoked IPSC in ACC slices before and after the arecoline application. n = 10 neurons/5 mice. *p < 0.05 and ***p < 0.001, ****p < 0.0001 compared with baseline control. (c) Top: representative traces of evoked excitatory and inhibitory responses recorded before and after the application of arecoline in the ACC. Bottom: the evoked E-I ratio before and after the application of arecoline. n = 25 neurons/11 mice. (d) Representative traces (top) and PPR before and after the arecoline application. n = 9 neurons/6 mice. (e) Representative traces (top) and plot of the time course of arecoline inhibiting the amplitude of paired pulse-induced EPSCs (bottom). The red line indicates the time when the arecoline was perfused. (f) Time course of the PPR before, during, and after the application of arecoline. n = 14 cells/ 7 mice
We further investigated the effect of arecoline on spontaneous synaptic transmission, we recorded the miniature EPSCs and IPSCs (mEPSCs and mIPSCs) in the ACC. However, we found neither the frequency nor the amplitude of the mEPSC changed after the arecoline perfusion (frequency: control 1.6 ± 0.3 Hz vs. arecoline 1.7 ± 0.4 Hz, paired t-test, t (17) = 0.17, p = 0.87; amplitude: control 7.8 ± 0.8 pA vs. arecoline 7.7 ± 0.6 pA, paired t-test, t (17) = 0.078, p = 0.94, n = 18 cells/ 7 mice; Fig. 5a and b). In addition, the arecoline had no significant effect on the mIPSC (frequency: control 3.2 ± 0.7 Hz vs. arecoline 3.0 ± 0.75 Hz, paired t-test, t (19) = 0.4427, p = 0.66; amplitude: control 13.5 ± 1.2 pA vs. arecoline 13.2 ± 1.5 pA, paired t-test, t (19) = 0.23, p = 0.82, n = 20 cells/ 7 mice; Fig. 5c and d). These results indicate that the arecoline had no significant effect on the spontaneous synaptic transmission.
Fig. 5
Changes of mEPSCs and mIPSCs in layer II/III of the ACC after the application of arecoline (a) Representative mEPSCs recorded in the ACC neuron in slices before (upper left) and after (upper right) the arecoline perfusion. Cumulative interevent interval (lower left) and amplitude (lower right) histograms of mEPSCs before (black square) and after (red circle) the arecoline perfusion. (b) Summary plots of mEPSC data. Averaged values of mEPSC parameters: mean peak frequency (left) and amplitude (right). n = 18 cells/ 7 mice (c) Representative mIPSCs recorded in the ACC neuron in slices before (upper left) and after (upper right) the arecoline perfusion. Cumulative interevent interval (lower left) and amplitude (lower right) histograms of mIPSCs before (black square) and after (red circle) the arecoline perfusion. (d) Summary plots of mIPSC data. Averaged values of mIPSC parameters: mean peak frequency (left) and amplitude (right). n = 20 cells/ 7 mice
The selective agonist inhibits both the evoked and spontaneous synaptic transmission in the ACCPrevious studies have reported that the arecoline is the agonist of the cholinergic receptor. We also found that the inhibitory effect of the arecoline in the ACC is dependent on the muscarinic receptors. Therefore, we applied another selective agonist of the muscarinic receptor, carbachol, to observe its effect on synaptic transmission. Similarly, the input-output curve was significantly shifted to the right after applying the carbachol (10 µM) compared with that in control group (n = 6 neurons/3 mice, two-way ANOVA, F (1, 47) = 61.9 p < 0.0001, Fig. 6a). We found that both the excitatory and inhibitory evoked responses were inhibited after the application of carbachol, but the evoked E-I ratio had no significant change (control 0.24 ± 0.03 vs. carbachol: 0.18 ± 0.03, paired t-test, t (5) = 2.3, p = 0.22, n = 6 cells/ 3 mice, Fig. 6b). Next, we recorded the PPR before and during the perfusion of carbachol. We found there was no significant change in PPR in ACC neurons compared with baseline (n = 8 neurons/3 mice, two-way ANOVA, F (1, 70) = 2.932, p = 0.09, Fig. 6c). During the application of carbachol, the amplitude of EPSC decreased to 39.1 ± 3.8% of baseline (n = 16 cells/5 mice, Fig. 6d), while the PPR with the 50 ms interval had no significant change (Fig. 6e). These results suggest that the carbachol also inhibits the postsynaptic transmission in the ACC neurons.
Fig. 6
Carbachol decreased evoked synaptic transmission in layer II/III of the ACC. (a) Representative traces (top) and input-output curves (bottom) in ACC slices before and after the carbachol application. n = 6 neurons/3 mice. ***p < 0.001 compared with baseline control. (b) Top: representative traces of evoked excitatory and inhibitory responses recorded before and after the application of carbachol in the ACC. Bottom: the evoked E-I ratio before and after the application of carbachol. n = 6 neurons/3 mice. (c) Representative traces (top) and PPR before and after the carbachol application. n = 8 neurons/3 mice. (d) Representative traces (top) and plot of the time course of carbachol inhibiting the amplitude of paired pulse-induced EPSCs (bottom). The orange line indicates the time when the carbachol was perfused. (e) Time course of the PPR before, during, and after the application of carbachol. n = 16 cells/5 mice
We also investigated the effect of carbachol on the mEPSCs and mIPSCs. Interestingly, the frequency of mEPSC decreased, while the amplitude did not change (frequency: control 1.7 ± 0.4 Hz vs. carbachol 0.9 ± 0.2 Hz, paired t-test, t (9) = 2.628, p = 0.03; amplitude: control 8.4 ± 0.8 pA vs. carbachol 7.5 ± 0.7 pA, paired t-test, t (9) = 1.291, p = 0.23, n = 10 cells/ 4 mice; Fig. 7a and b). The carbachol had no significant effect on the mIPSC (frequency: control 2.8 ± 0.7 Hz vs. carbachol 1.6 ± 0.4 Hz, paired t-test, t (6) = 2.02, p = 0.09; amplitude: control 12.0 ± 1.4 pA vs. carbachol 10.1 ± 1.0 pA, paired t-test, t (6) = 1.81, p = 0.12, n = 7 cells/ 3 mice; Fig. 7c and d). These results indicate that carbachol inhibits the spontaneous presynaptic release in neurons of the ACC.
Fig. 7
Changes of mEPSCs and mIPSCs in layer II/III of the ACC after the application of carbachol (a) Representative mEPSCs recorded in the ACC neuron in slices before (upper left) and after (upper right) the carbachol perfusion. Cumulative interevent interval (lower left) and amplitude (lower right) histograms of mEPSCs before (black square) and after (orange circle) the carbachol perfusion. (b) Summary plots of mEPSC data. Averaged values of mEPSC parameters: mean peak frequency (left) and amplitude (right). n = 10 cells/ 4 mice (c) Representative mIPSCs recorded in the ACC neuron in slices before (upper left) and after (upper right) the carbachol perfusion. Cumulative interevent interval (lower left) and amplitude (lower right) histograms of mIPSCs before (black square) and after (red circle) the carbachol perfusion. (d) Summary plots of mIPSC data. Averaged values of mIPSC parameters: mean peak frequency (left) and amplitude (right). n = 7 cells/ 3 mice
留言 (0)