Preparation of primary neuron cultures
Primary cortical neurons were prepared from M83 heterozygous mice (B6;C3-Tg(Prnp-SNCA*A53T)83Vle/J; JAX number 004479). All animal experimental procedures were reviewed and approved by the Abbvie Institutional Animal Care and Use Committee (IACUC). Day 15.5+/-0.5 days embryos were removed from pregnant female and placed into 10cm dish with Ca and Mg free HBSS. Individual embryos were placed in a well of a 6 well plate containing 2-3 mls of Hibernation media (2% B-27 Supplement; 48% Hibernate-E media; 20% L15 media 30%CO2 independent media) on ice. Using a dissection microscope, the hippocampus and whole cortex were isolated and placed in a 15 ml conical tube with 10 mls of HBSS. HBSS was then aspirated, and neuronal isolation enzyme diluted in Ca/Mg free HBSS was incubated in a 30°C for 30 mins with gentle inversions every 5 mins. Cells were triturated and washed with DMEM/10% FBS and gently passed through a 70uM cell strainer. Cells were then counted and plated using plating media (DMEM/10% FBS/1X Penstrep). 3-6hrs after plating, media was completely removed and replaced with culture media (2% B27 plus 1% Glutamax in Neurobasal Plus media).
Preparation of α-syn pre-formed fibrils (PFF)
Recombinant human α-syn PFFs were generated from monomeric starting material following an established protocol [57]. Briefly, recombinant human α-syn (1-140) at 6 mg/ml in 10 mM Tris, 50 mM NaCl, pH 7.6 was thawed on ice and then centrifuged at 15,000 x g for 10 min at 4°C to pellet out any preexisting higher molecular weight species. The supernatant was then collected, α-syn concentration measured, and conditions adjusted to 5 mg/ml α-syn in 10 mM Tris, 150 mM NaCl, pH 7.6. 0.5 ml α-syn was then aliquoted into individual, sealed, 1.7 ml Eppendorf tubes and placed in an Eppendorf thermomixer at 37°C, 1000 RPM for seven days. Successful fibrillization was confirmed by thioflavin t binding assay, sedimentation assay and imaging by negative staining transmission electron microscopy. α-syn fibrils were then aliquoted and stored at -80°C until use.
Primary neuron culture treatment with human α-syn pre-formed fibrils (PFF) or PBS
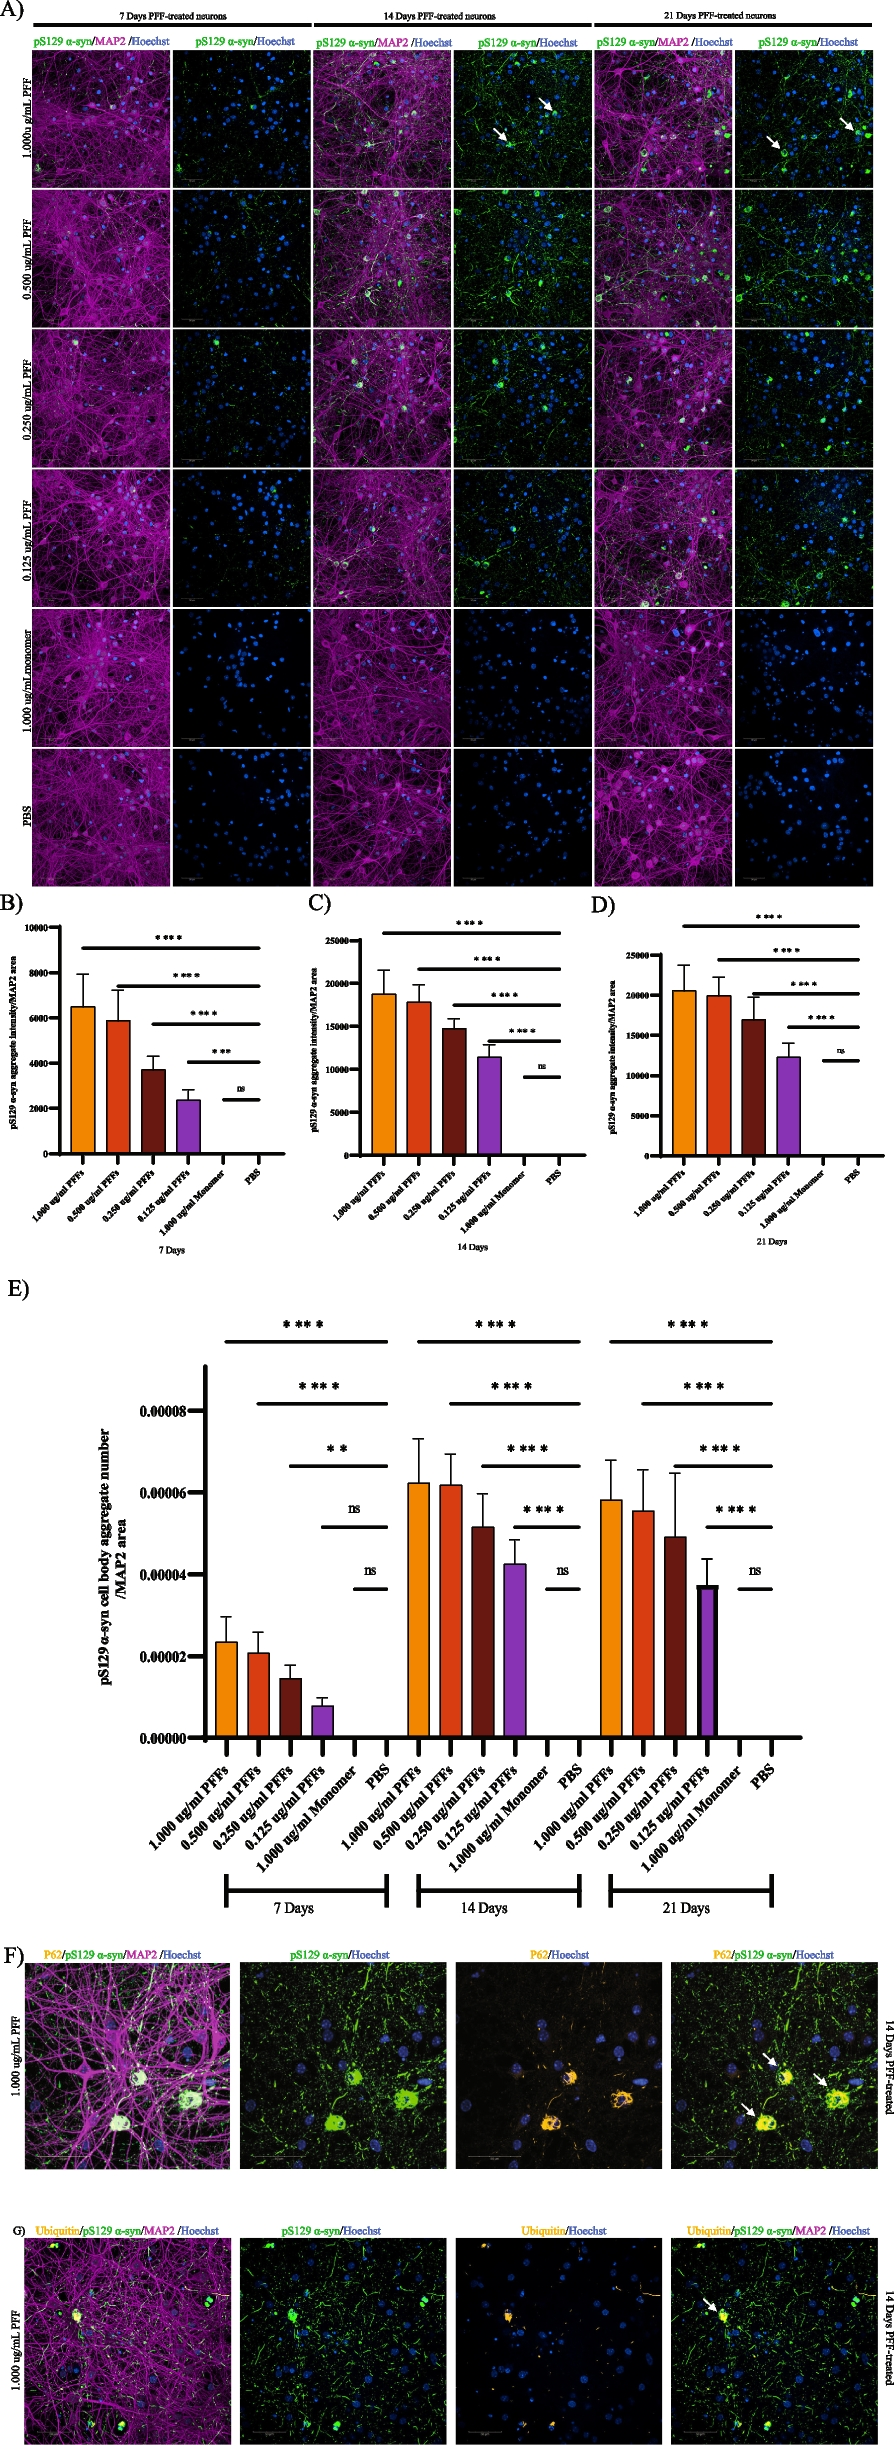
Primary neurons were treated with the indicated concentration of PFFs (.125 ug-1 ug/ml for dose response and 1 ug for all subsequent proteomic samples) one time on DIV 7. 5uL aliquots of 5 mg/ml samples were thawed at room temperature and 245uL of PBS was added and mixed by gentle pipetting to bring to a concentration of 100 ug/ml. PFFs and PBS were then sonicated using a water bath sonicator and diluted to 2x in culture media (2% B27 plus 1% Glutamax in Neurobasal Plus media). 50% of culture media was removed from each well and replenished with either the 2x PFF or PBS culture media and returned to the incubator. Media was replenished every 3-4 days until cells were collected. For the time course (see Fig.S1 A.) Cells treated for 7 days with PFF were collected at DIV 14, cells treated for 14 days were collected at DIV 21 and cells treated for 21days were collected at DIV 28. All cells received a one time addition of PFF(7 day, 14 day and 21 day treatment nomenclature corresponds to how many days after the one time PFF treatment cells were collected)
Primary mouse M83 neurons were treated with 1uM accell Larp1 siRNA Smartpool or accell non-targeting siRNA pool, from dharmacon at DIV 5. α-syn PFFs were added at DIV 8 for 2 weeks at 0.5 ug/ml. For endpoints, one plate was fixed with methanol and stained for pS129 α-syn aggregates, MAP2 and nuclei number and the second plate was used for qPCR analysis to measure gene knockdown efficiency.
Immunofluorescence protocol
After treatment, neuronal media was gently removed and cells were incubated with ice cold methanol for 20 mins at -20°C. Cells were washed 3x with dPBS (Thermofisher Scientific cat#14190144) and blocking buffer (4% Albumin Bovine Fraction V (BSA) Research Products International, 0.2% Triton in dPBS) was added to each well for 1 hr at room temperature. After sufficient blocking, blocking buffer was removed and primary antibodies (α-syn pS129 Cell Signaling Technology 23706 (1:3000); MAP2 Abcam ab5392 (1:2500) were diluted in blocking buffer and incubated overnight on an orbital shaker at 4°C. After primary antibody incubation, cells were washed 3x with dPBS. Alexa-flourophore-conjugated secondary antibodies were added to blocking buffer and filtered through Spin-X column centrifuged at 5000 RPM for 5 mins. Filtered secondary antibodies diluted in blocking buffer were added to each well. Cells were incubated at room temperature in the dark in secondary antibody on an orbital shaker for two hours. Cells were washed with dPBS 3x and nuclear stain was diluted in dPBS and added for 15 mins at room temperature. Cells were then washed with dPBS 3x and stored in dPBS at 4°C until imaging.
Isolation of insoluble fraction
This protocol was originally published by Volpicelli-Daley [12]. Briefly, primary neurons plated at a density of 1,000,000 cells/ well in 6 well dishes were washed twice with dPBS. Cells were lysed in 250uL 1% Triton in TBS (1%Triton-X, 50mM Tris, 150mM NaCl pH 7.4) with 1X Halt Protease and phosphatase inhibitor. Using a cell scraper, cells were collected and placed in tubes on ice. Cells were sonicated on ice ten times at a pulse of 0.5 second on 0.1 second off with 20% amplitude. After sonication tubes remained on ice for 30 min. Cells were centrifuged at 100,000 x g for 30 mins at 4°C. The supernatant was collected from each sample and saved as the soluble fraction. A total of 250uL of 1% Triton in TBS was added to each pellet and subsequently sonicated ten times at a pulse of 0.5s on 0.1s off with 20% amplitude on ice. The sonicated pellets were then centrifuged down at 100,000 x g for 30 mins at 4°C. The supernatant was discarded and 80uL of 2% SDS buffer (2% SDS 50mM Tris, 150mM NaCl pH 7.4) was added and each pellet was resuspended. Samples were sonicated 15 times at 0.5s on 0.1s off pulse with 30% amplitude in a water bath sonicator. Samples were then immediately frozen at -80°C until further processing.
Western blot
Protein concentrations were measured by micro-BCA assay (ThermoFisher Scientific 23235) and samples were normalized. Samples were run on the Protein Simple Wes instrument according to the manufacturer’s instructions. Depending on the size of the protein either the 2-40kDa, 12-230kDa or the 66-440kDa Separation Module was used along with either the Anti-Rabbit or Anti-Mouse Detection Modules. Primary antibodies used were pS129 α-syn (CST 23706) and Larp1 (CST 14763S). Briefly, Fluorescent Master Mix was added to diluted samples and samples were then heated at 95°C for 5 mins before loading into the cassette along with the antibodies, chemiluminescent substrate, and blocking reagent. The Wes instrument was run on default settings. Area under the curve (AUC) was quantitated from the resulting electropherograms. Samples were normalized to loading controls cofilin (CST 5175S), beta-actin (Licor 926-42210) or vinculin (abcam ab129002) and data graphed as protein/loading control.
M83 total and phospho-proteomic sample prep
M83 mouse neurons were lysed in a buffer of 8M urea, 10 mM TCEP, 40 mM chloroacetamide, and 50 mM Tris supplemented with protease/phosphatase inhibitors. Protein concentrations for all treatments and timepoints were determined by protein BCA (Thermo Fisher Scientific, #23225), and equimolar protein concentrations were aliquoted, diluted to 1.5 M urea with 100 mM Tris, and digested with a trypsin/Lys-C combination enzyme mixture (Promega, V5071) in a 1:50 enzyme/substrate ratio overnight. Each sample was acidified to 0.1% TFA, desalted with 100 mg Strata-X polymeric reversed phase desalting columns (Phenomenex, #8B-S100-ECH), and dried down via a centrivap. Each timepoint’s 10 sample treatments were labeled with their own TMT 11-plex isobaric chemical tag set (Thermo Fisher Scientific, #A34808), reserving the 11th channel for a “pooled” channel. This pooled channel consisted of a mix of small aliquots from the study’s 30 total samples, which served as a reference for normalization and cross-comparison of relative differences across the three TMT 11-plex sets. Once each set of TMT 11-plex peptides was mixed, quenched, and desalted a second time with Strata-X columns, each set was individually resuspended in 80% ACN 0.1% TFA and enriched for phosphopeptides using Qiagen Ni-NTA beads as described below. The flowthrough from Fe-IMAC enrichment contained non-phosphopeptides for proteome quantification. The three enriched phosphopeptide sets and three flowthrough proteome samples were each fractionated using a Waters Acquity UPLC. Peptides were separated using a linear gradient starting with aqueous 20 mM ammonium formate and increasing up to 20 mM ammonium formate in 80% ACN using a 2.1 x 100 mM UPLC column packed with 1.7 uM BEH C18 material (#186002352). Both phosphopeptide and proteome samples were collected into 15 total fractions, dried down via a centrivap, and resuspended in 0.1% formic acid.
Phosphopeptide enrichment
Iron immobilized metal affinity chromatography (FeIMAC) was used to enrich phosphoserine, threonine, and tyrosine residues in the samples. First, samples were dried down and resuspended in 80% ACN and 0.15% TFA to prepare them for phospho-enrichment. Meanwhile, Ni-NTA magnetic agarose beads (Qiagen #36113) were cleaned with 40 mM EDTA and washed with water. Fe3+ was then chelated onto the NTA magnetic agarose beads for 30 mins at room temperature (RT) and 1350 RPM in a ThermoMixer. Beads were then washed in the same buffer that the samples were resuspended in (80% ACN and 0.15% TFA) and aliquoted evenly across all samples (500ul beads per mg of sample). FeIMAC beads were incubated with samples for 30 mins in a ThermoMixer at RT and 1350 RPM. Phosphopeptides were eluted thereafter with 50% ACN 0.7% NH4OH solution and immediately acidified with 4% FA. The eluate was dried down and resuspended in 0.1% formic acid and injected for MS analysis.
M83 insoluble aggregate sample preparation
18 insoluble aggregate samples from PFF treated neurons and 18 samples from PBS treated neurons were processed for proteomics. Detergent clean-up and sample digestion was done with single-pot, solid-phase enhanced sample prep (SP3) and 96 well plate format robot assisted sample handling (Integra Assist Plus). First, 0.5M TCEP (Tris(2-carboxyethyl)phosphine), 0.5M CAA(Chloroacetamide) were added to each sample. Samples were reduced and alkylated in a covered shaker (Eppendorf ThermoMixer) at 1000 RPM for 30 mins at 37 °C. Meanwhile, equal amounts of Sera-Mag SpeedBeads (GE Healthcare, #45152105050250) and Sera-Mag carboxylate modified magnetic particles (GE Healthcare, #65152105050250) were combined, washed with water, and reconstituted with water in equal volume (SP3 beads). The SP3 beads (10ul), 0.5M DTT(Dithiothreitol), and 80% ethanol were added to each sample and mixed on the ThermoMixer at 1200RPM for 10 mins at room temperature to facilitate binding. The sample-bead mix was then washed three times with 80% ethanol. Trypsin/Lys-C combination enzyme mixture was added at a 1:50 enzyme/substrate ratio for an overnight digestion (1000 RPM, 37 °C, ThermoMixer). The next day, samples were acidified to pH 2 for C18 column-based sample clean up. Thereafter, samples were dried down and resuspended in 0.1% formic acid. 500 ng of sample was injected for MS analysis and the remaining used for phospho-enrichment. Insoluble aggregate samples were enriched for phosphopeptides as described above, and both insoluble proteome peptides and phosphopeptides were injected for MS analysis and quantified in label-free fashion.
LCMS methods (total, phospho, and insoluble proteome)
Each TMT 11-plex’s 15 phosphopeptide and 15 proteome fractions were analyzed using a 120 min nano-LC MS data dependent acquisition (DDA) method. Peptides were separated using a Thermo Fisher Scientific Easy nanoLC 1200 with solvents 0.1% formic acid in water and 0.1% formic acid in 80% ACN. Peptides were separated linearly from 4% ACN to 45% ACN using an Easy Spray ES902 analytical column. Phosphopeptide or proteome fractions were analyzed using a Thermo Fisher Scientific Orbitrap Exploris 480 mass spectrometer, with survey MS scans collected at 120,000 resolving power and 350-1800 m/z scan range. A MS1 standard (100%) AGC target was selected with maximum injection times automatically calculated within a 2 second MS cycle time. Charge states 2-8 were considered for fragmentation with a 25 second exclusion duration. Peptides were selected with a 0.8 m/z quadrupole isolation window and fragmented with a 36% normalized collision energy. Orbitrap MS/MS resolving power was set to 45,000, with standard (100%) AGC targets. Phosphopeptide fractions were analyzed with a maximum injection time of 120 msec, while maximum injection times for proteome fractions were automatically calculated based on available cycle time. Insoluble aggregate proteomics and phospho-proteomics data was collected using an Evosep nano-LC running 44 min 30 SPD standard gradient methods and connected to a Thermo Fisher Scientific Lumos MS. The Lumos was run at 120,000 resolving power with a 350-1800 m/z scan range. A MS1 standard (100%) AGC target was selected with maximum injection times automatically calculated within a 3 second MS cycle time. Charge states 2-8 were considered for fragmentation with a 30 second exclusion duration. Peptides were selected with a 0.8 m/z quadrupole isolation window and fragmented with a 30% normalized collision energy. Orbitrap MS/MS resolving power was set to 7,500, with standard (100%) AGC targets. Phosphopeptide fractions were analyzed with a maximum injection time of 120 msec, while maximum injection times for proteome fractions were automatically calculated based on available cycle time.
Proteomics data analysis
All TMT data and insoluble aggregate proteomics data were searched using MaxQuant, set with either TMT 11-plex chemical modifications or no modifications (insoluble aggregate phospho/proteomics). Enzyme digestion was specified as tryptic with a maximum of 2 missed cleavages. Chemical modifications considered for data searching included a fixed modification of carbamidomethylation of cysteines and variable modifications of methionine oxidation, acetylation of protein N-termini, and phosphorylation of serine, threonine, and tyrosine residues (for phospho-proteome MS data searches). All data was searched against a target-decoy Uniprot mouse proteome database containing both canonical sequences and protein isoform sequences, downloaded on September 20, 2020. Reporter ion MS2 spectra were used for TMT quantification with a precursor ion mass tolerance of 4.5 ppm and a fragment ion mass tolerance of 20 ppm. Whether for TMT or label-free quantification studies, protein groups and phosphosite quantitation MaxQuant tables were exported and filtered to consider quantifiable protein groups or phosphosites for >50% measurements were observed across all samples. Of those protein groups or phosphorylation sites that remained, missing values were imputed from the normal distribution of each samples’ protein or phosphosite quantitation. Protein group or phosphosite intensities from TMT studies were summed and median normalized to account for TMT mixing differences across the samples. Insoluble aggregate protein group LFQ and phosphosite intensities were also normalized by peptide amount loaded for LCMS.
Proteomics differential abundance
From the quantile-normalized intensities for PFF- vs. PBS-treated samples within each timepoint/TMT run, additional downstream quality checks and analyses were performed on each of the TMT runs separately (each TMT run contained samples from a single timepoint: 7- or 14-days treatment). For each, we removed proteins only identified by site, potential contaminants, and reverse proteins. Of the remaining proteins, we kept proteins with at least one unique peptide and more than one peptide. We removed the pooled sample from each dataset and replaced all the zero normalized intensity values with ‘NA’ values. We excluded proteins if they contained missing values in > 20% of a timepoint’s conditions. For subsequent differential expression analyses, we used the Limma package in R. No covariates were used in the model. Within the differential expression results, we considered proteins with an adjusted p-value < 0.05 statistically significant.
Phospho-proteomics analysis methods
From the quantile-normalized intensities for PFF- vs. PBS-treated samples within each timepoint/TMT run, additional downstream quality checks and analyses were performed on each of the TMT runs separately (each TMT run contained samples from a single timepoint: 7- or 14-days treatment). For each, we removed the pooled sample from each dataset. We removed phosphopeptides whose leading proteins were potential contaminants. We then replaced all the zero quantile-normalized intensity values with ‘NA’ values and excluded proteins if they contained missing values in > 20% of a timepoint’s conditions. Based on a PCAs excluding proteins with missing values, we detected and removed one outlier (M83_PFF_Day07_2) from downstream analyses. For subsequent differential expression analyses, we used the Limma package in R. No covariates were used in the model. No covariates were used in the model. Within the limma results, we considered phosphopeptides with an adjusted p-value < 0.05 statistically significant.


留言 (0)