
記住我


Persistent pain following nerve trauma is a relatively common phenomenon that affects, to some degree, a portion of the population that undergoes surgical procedures or experiences traumatic lesion of sensory nerves.20,25 Following surgical repair of traumatic lesions of sensory nerves in the hand, as many as 50% of the patients report a clinically relevant chronic pain state at longtime follow-up,35 while the remaining half only report numbness but no pain, even if the nerve lesions are virtually the same in both groups. Of interest, earlier studies could not detect any differences between sensory profiles of patients with neuropathic pain and neuropathy without pain22,24,26,29,52 or in the function of conditioned pain modulation.19,34
Differences in the degree of systemic inflammation biomarkers have been suggested as an important pathophysiological factor in neuropathic pain.11,47 An increase in proinflammatory cytokines in the blood or cerebrospinal fluid (CSF) is found in patients experiencing severe neuropathic pain for many years,30,32,46 but in cohorts having lower levels of reported pain, and a low burden of psychosocial problems, no such difference could be detected.37 Thus, our understanding to explain this puzzling of why some patients develop neuropathic pain and others do not after similar traumatic nerve injuries remains inadequate. However, both clinical and preclinical studies indicate that some of these individual differences in outcome are mediated by genetic heterogeneity.39,41,55,58 A growing number of studies aiming to identify genetic factors in neuropathic pain have been published over the past decade.58 The latest developments in genome-wide association studies (GWAS)56 and studies of single-nucleotide polymorphisms (SNP)39,41 have revealed an important role of genetics in neuropathic pain.
According to previous research, the rat major histocompatibility complex (MHC) regulates the degree of neuropathic pain–like behaviour after nerve injury induced by an ischemic sciatic nerve lesion.10 The MHC comprises more than 200 genes, many of which are related to important immune functions such as antigen presentation.44 Activation of the immune system may be involved in the development and maintenance of pain through activation of glial cells and by the release of proinflammatory mediators.18
Earlier we demonstrated that individuals carrying the human leukocyte antigen (HLA) subhaplotype DRB1∗04 − DQB1∗03:02 have increased risk of developing persistent postoperative pain after inguinal surgery9 and to increase the incidence of chronic neuropathic pain after lumbar disc herniation.9 Thus, there is some strong evidence supporting the notion of an HLA-dependent effect on the risk for developing chronic pain after peripheral nerve injury. In addition, other prior studies by different investigators have also found an association between the HLA and certain chronic pain conditions, eg, complex regional pain syndrome (CRPS)8,53,54 or fibromyalgia.3
To find out whether the relevance of HLA-genetics for chronic pain outcome could be corroborated, as a follow-up of earlier results from our group, we investigated a new cohort of hand surgery patients: one group with definitive neuropathic pain and the other group with traumatic neuropathy but no pain, both exposed to similar injuries due to nerve trauma and surgery.
2. MethodThis study was conducted at the Multidisciplinary Pain Center, Uppsala University Hospital, UUH, Sweden. The study was performed in accordance with the ethical principles for medical research involving human subjects that have their origin in the updated Declaration of Helsinki and was approved by the Regional Ethics Committee (Approval no: Dnr: 2015/265; registered at www.ClinicalTrials.gov NCT03174665). Informed consent was obtained from all participants.
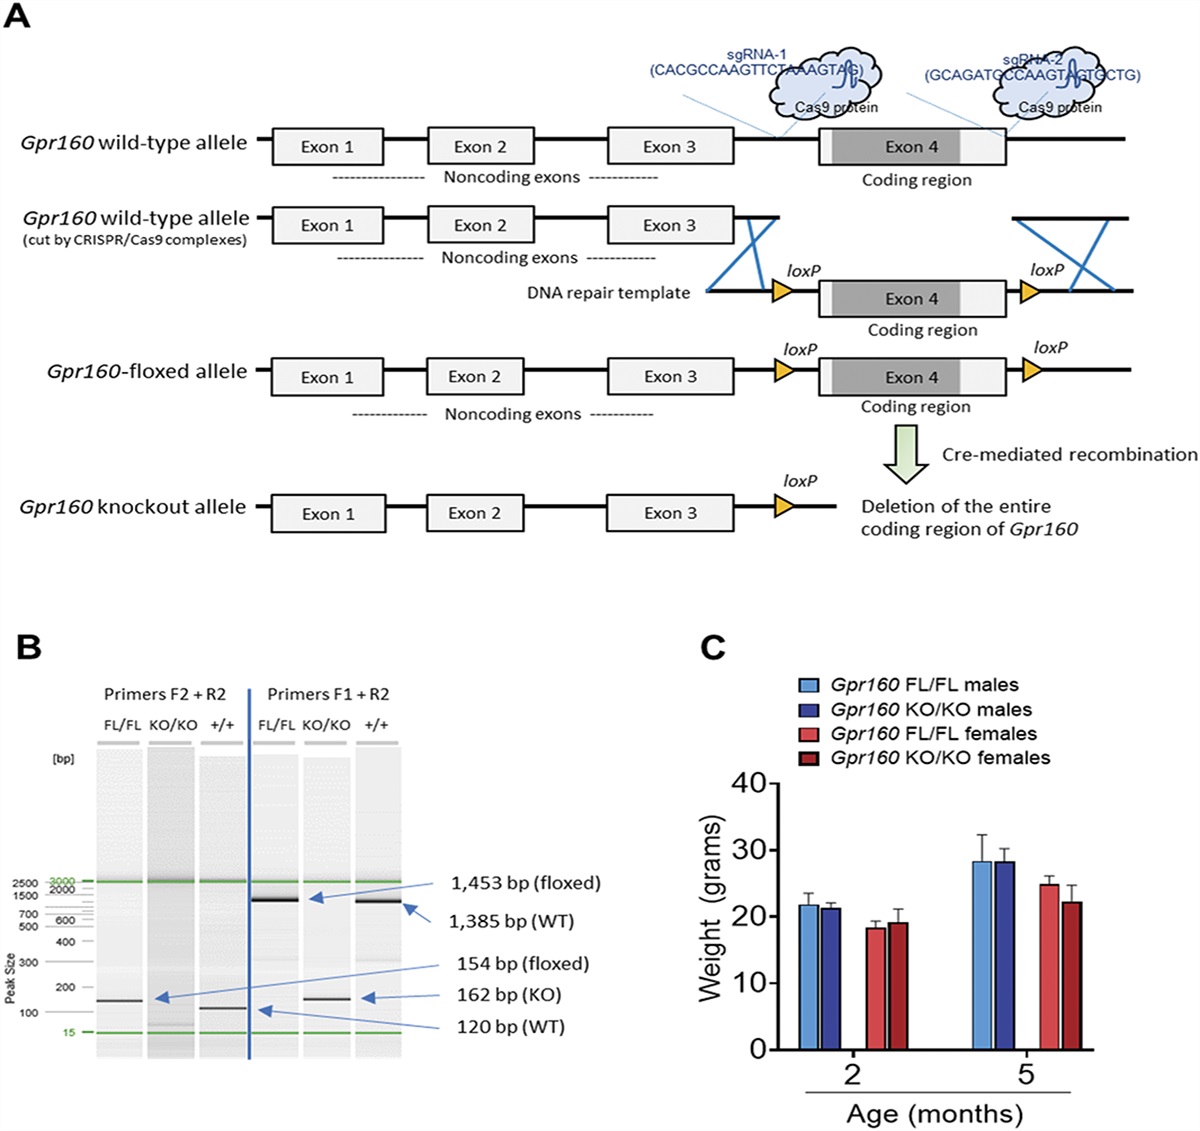
2.1. Subject recruitmentThe subjects in this case–control study were selected from a larger cohort of more than 1000 patients based on results from a pain questionnaire previously reported.35 Questionnaires about pain intensity, prior and concomitant medication, and the Self-Report Leeds Assessment of Neuropathic Signs and Symptoms (S-LANSS questionnaire) were sent to all the subjects with traumatic nerve lesion in the hand or lower arm region admitted (between 2010 and 2018) to the Hand Surgery Clinic, UUH. Thirty-seven subjects without nerve injury (n = 8) or with no indication for surgery (n = 29) were excluded from those 706 subjects who returned the questionnaire (response rate 67%). To eliminate surgery-specific factors known to be important in developing persistent postsurgical pain,6 only patients who underwent primary and secondary nerve suture surgery were recruited. A total of 138 subjects with injuries involving severely damaged nerves or injuries associated with significant loss of nerve tissue requiring nerve grafting or neurolysis were also excluded. The remaining 531 subjects consisting of 271 subjects with persistent pain (51%) and 260 (49%) without pain were invited to participate in a follow-up study (Fig. 1). The inclusion criteria for the participants were age 18 years or older, a surgical nerve repair after a traumatic nerve lesion in the hand and lower arm region, persistent postoperative neuropathic pain with a history of 6 months to 7 years before the screening visit, pain intensity more than 50 mm on a 100-mm visual analogue scale (VAS) for the group of participants with pain, and no pain or intensity of pain of less than 20 mm on the VAS for the group without pain. The exclusion criteria were as follows: evidence or history of any clinically significant neurological disease or other systemic disease, condition potentially interfering with study assessments (polyneuropathy, diabetes mellitus, peripheral vascular disease, history of malignant disease, or chronic alcohol consumption), or severely damaged nerves requiring other surgical interventions than neurorrhaphy. The participants with pain and S-LANSS ≥12 (indicating predominantly neuropathic pain) were recruited for the group with neuropathic pain and those with S-LANSS<12 and sensory impairment were recruited for the group with neuropathy without pain.2 According to the questionnaire responses, all patients who fulfilled the inclusion criteria were invited to participate in this study. Eligibility for participants was determined only after completion of a health history questionnaire, interview about pain intensity, and a routine clinical neurological examination that confirmed neuropathic pain or painless neuropathy. The confirming sensory impairment on examination of the somatosensory system in the innervation territory of a previous intraoperatively verified injured nerve strongly indicated the diagnosis “definite neuropathic pain” for all patients with pain13,51 and neuropathy for patients without pain. All subjects had a definite traumatic nerve lesion, seen by the surgeon intraoperatively.
 Figure 1.:
 Flowchart. Case subjects with neuropathic pain; control subjects with neuropathy without pain. F, female; M, male; S-LANSS, the self-administered leeds assessment of neuropathic symptoms and signs scale; VAS, visual analogue scale (0-100 mm).
2.2. ProceduresIn earlier studies,34,36,37 we outlined all the procedures performed. In brief, a standardized case report form was used to collect a detailed pain history that included type of pain, duration and its characteristics, and current and previous pharmacological and nonpharmacological pain management. Sociodemographic data included race and ethnicity, education level, work status, and medical history. Additional questionnaires regarding health (RAND-36), psychiatric evaluation (HADS), and function in the upper extremity (Quick-Dash) were completed.
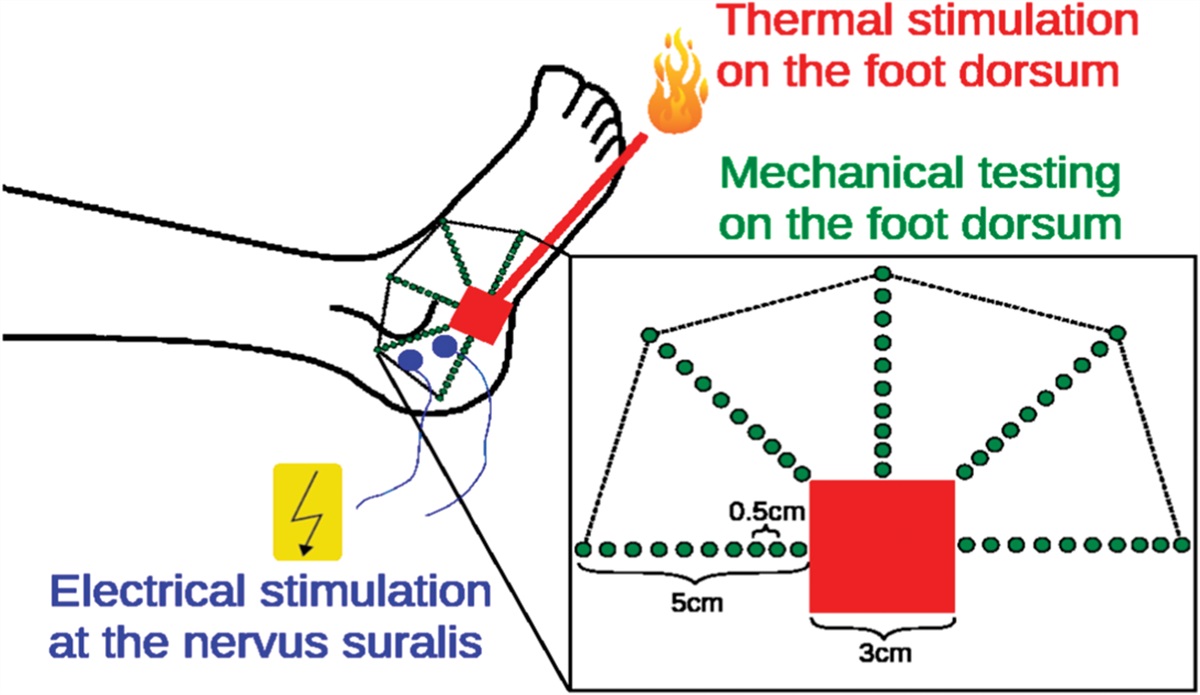
2.2.1. Pain assessment and clinical examinationAfter clinical evaluation and sensory neurologic examination, pain was classified as neuropathic. Sensory examination testing was as follows: for touch with a camel hair brush (0.5 Somedic, Sweden), for pain with a sharp tooth pick, and for temperature with warm (40°C) and cold (25°C) rollers (Senselab Rolltemp, Somedic). The contralateral uninjured limb served as within-subject control. Participants were asked to rate their mean clinical pain over the past week on VAS (0-100). Definite neuropathic pain was based on the presence of pain and bedside neurological examination indicating sensory signs in the neuroanatomically plausible distribution of the injured nerve. Confirmatory tests were not conducted because a nerve lesion seen intraoperatively was considered an accepted verification of nerve damage.13
2.2.2. Blood sampling and human leukocyte antigen typingBlood samples (20 mL) were collected from the antecubital vein of all participants in Li-heparin PST tubes (367886, Becton-Dickinson, Franklin Lakes, NJ) and frozen at −70°C in a registered Biobank until further analysis.
Genomic DNA was extracted from the whole blood with the EZ1 DNA Blood 200 μL kit (QIAGEN, Venlo, the Netherlands) and then amplified using NGSgoAmpX amplicon kit (GenDx, Utrecht, the Netherlands) using primers and reagents from a GenDx-LongRange PCR kit (GenDx). Human leukocyte antigen genotyping was performed using Miseq (Illumina, San Diego, CA), and the resulting data were analyzed using NGSengine (GenDX), as previously described.21
2.3. Statistical analysisAlleles of HLA-A, HLA-B, HLA-C, HLA-DRB1, HLA-DQB1, and HLA-DPB1 were determined by sequencing to the highest possible resolution. Further analysis was conducted with the components of the HLA alleles reduced to a 2-field resolution, equivalent to the amino acid sequence level. This was done to increase power because the number of alleles would otherwise increase the risk of a type II error. Assessment of Hardy-Weinberg equilibrium (HWE) was performed using the Arlequin package (v. 3.5.2.2).12 The same package was also used to calculate allele frequencies and estimate haplotype frequencies. The latter was performed using an expectation-maximization algorithm. Pairwise linkage disequilibrium (LD) between loci for all loci was estimated using a likelihood ratio test for all estimated haplotype frequencies.
Further data analysis was conducted with a custom R script (R v. 4.1.2). The package R Bridging ImmunoGenomic Data Analysis Workflow Gaps (BIGDAWG)40 was used to perform a case-control analysis, calculate allele frequencies, and estimate haplotype frequencies using an expectation-maximization algorithm. Individual frequencies were compared between case and control groups at allele and haplotype levels, and global association analysis was performed for each included HLA locus and at the haplotype level. The DPB1 locus was excluded from haplotype analysis because DPB1 has a low degree of LD with other loci.1
Any haplotype with a significant association to the primary dependent variable was analyzed further with sliding window analysis so as to further investigate whether any subhaplotypes might be responsible for the association. The BIGDAWG package includes some preselected known polymorphic amino acid positions, and analysis at the amino acid level was performed for these specific positions. Low sample size may cause type 1 errors, and to avoid this scenario, alleles with an expected frequency of <5 were binned, ie, placed in their own “binned” category.23
However, 20% of cells were allowed to have frequencies <5 without binning to avoid type 2 errors. P < 0.05 was used as cutoff value for measuring significance. Correction for multiple testing with the Bonferroni method was used for all alleles, haplotypes, subhaplotypes, and amino acid polymorphisms. For the purposes of Bonferroni correction, binned samples were excluded. Normally distributed data were analyzed using the Student t test, and skewed data were compared using the Mann-Whitney U test. Binomially distributed data were analyzed using the χ2 test and presented as frequency distributions with absolute numbers and relative distribution in percent. The Fischer exact test was used to calculate the distribution of low-resolution subhaplotype DRB1*04-DQB1*03:02.
3. Results 3.1. Sociodemographic and clinical characteristics of subjects included in the studyOof these initial 73 subjects examined in each group, the final group of subjects with neuropathic pain included 70 individuals (NP) (39 men and 31 women) and the group without pain consisted of 61 individuals (nP) (39 men and 22 women). All participants had nerve damage verified intraoperatively, and the group with pain had clinical findings consistent with neuropathic pain. No sociodemographic differences were found between the groups. Pain duration was significantly longer in the group with pain in comparison with the painless group (P < 0.0001). Subjects with neuropathic pain rated of course significantly higher pain intensities (P < 0.0001), had significant reductions in the physical component of RAND-36 scores (P < 0.0001), and had a higher degree of disability (Quick DASH, P < 0.0001) than nonpain controls. No difference in either anxiety or depression scores measured with the HADS questionnaire was observed between the groups. Participants with neuropathic pain had significantly higher prevalence of gain of function (P = 0.031) at bedside examination in comparison with the participants with pain-free neuropathy (Table 1). Details of all participants are summarized in Table 1, including demographic data, RAND-36, Quick-DASH, HADS, and S-LANSS assessment and clinical findings.
Table 1 - Sociodemographic and clinical characteristics of the subjects included in the study. Case (n = 70) Control (n = 61) Group diff Age, (y) Median [IQR] 47 (29-59) 49 (32-60) 0.517 Gender (n, %) MaleData presented as n (%), mean ± SD, or median [IQR 25th, 75th percentile]. P value < 0.05 was considered significant. Bold text indicates a statistically significant difference.
ASA, American Society of Anesthesiologist's Physical Status Classification System; BMI, body mass index; BP, body pain; case, patients with neuropathic pain; control, patients with neuropathy without pain; COX inhibitors, cyclooxygenase (COX) inhibitors; GH, general health; HADS, hospital anxiety and depression scale (0-21, worst = 21 for each subscale); MH, mental health; NS, nonsignificant; pain VAS, average weekly pain on a visual analogue scale (0-100, worst = 100); PF, physical function; Quick Dash, disabilities of the arm, shoulder, and hand score; RAND-36, 36-item health survey; RE, emotional role/function; RP, physical role/function; SF, social function; S-LANSS, self-report leeds assessment signs and symptoms scale; VT, vitality.
In a stable population, biallelic genes tend to adhere to Hardy-Weinberg equilibrium, and the population frequency for each combination of alleles can be easily calculated from the allele frequency for that population under the assumption that each allele associates randomly with each other allele. Many population genetic models and tests assume a rough adherence to the HWE. No significant deviation from the HWE in either the case or the control group was detected at any HLA loci, implying that the assumption that the sample for this study fit the expectations under the HWE cannot be rejected. Note that this might be due to a low sample size. HWE calculation was not performed in the BIGDAWG package due to the low sample size.
Alleles that are inherited together more often than would be predicted by chance are said to exist in a state of linkage disequilibrium (LD). Significant LD was discovered between multiple pairwise loci for both case and control groups (Supplementary Figure S1, available at https://links.lww.com/PAIN/B976). This is expected based on prior findings that many HLA alleles are in strong LD and confirms that our samples follows the general pattern.1 The DPB1 locus has a lower degree of LD than the other loci, which is also expected.1 For this reason, the HLA-DPB1 locus was excluded when performing the haplotype analysis because it is less likely to be part of a conserved haplotype.
3.3. Allele frequenciesAll allele frequencies for the observed loci are summarized in Supplementary Table S1, available at https://links.lww.com/PAIN/B976. No significant association at any of the tested loci (A, B, C, DRB1, DQB1, and DPB1) was found when performing global association tests and correcting for multiple testing. No significant associations were found when testing at the amino acid level, after correcting for multiple testing.
3.4. HaplotypesA significant case-control association was found when testing at the haplotype level (χ2 = 10.2, P value = 0.04). To follow-up this find, individual haplotypes were analysed; 4 estimated haplotypes were found to be present in sufficient frequencies to avoid binning when testing for case-control associations (Table 2). One of these haplotypes was identified as a significant risk haplotype in the group with neuropathic pain, A*02:01-B*15:01-C*03:04-DRB1*04:01-DQB1*03:02, (OR = 9.31 [95% CI 1.28-406.45], P = 0.01, Bonferroni-adjusted P value P = 0.04) (Fig. 2). Further analysis of this haplotype using sliding window analysis showed no significant association with any subhaplotype (A-B-C-DRB1, A-B-C, A-B, B-C, B-C-DRB1-DQB1, B-C-DRB1, C-DRB1-DQB1, C-DRB1, and DRB1-DQB1).
Table 2 - Estimations of odds ratio and P value of top 4 haplotypes. A B C DRB1 DQB1 DPB1 Case Control OR (95% CI) P 01:01 08:01 07:01 03:01 02:01 6 7 0.74 (0.2-2.64) 0.59 02:01 15:01 03:04 04:01 03:02 10 1 9.31 (1.28-406.45) 0.01 02:01 44:02 05:01 04:01 03:01 5 3 1.47 (0.28-9.64) 0.60 03:01 07:02 07:02 15:01 06:02 4 10 0.37 (0.09-1.37) 0.06 Binned 0.96 (0.48-1.9) 0.89DPB1 allele excluded. Bold text indicates the A*02:01-B*15:01-C*03:04-DRB1*04:01-DQB1*03:02 haplotype found to be statistically significant (P=0.01). The carriers of this haplotype have an odds ratio of 9.3 for developing clinically significant persistent neuropathic pain
OR, odds ratio.
 Figure 2.:
 Odds ratios for development of persistent neuropathic pain depending on haplotype. Dots indicate odds ratio while bars indicate 95% confidence interval.
Another haplotype, A*03:01-B*07:02-C*07:02-DRB1*15:01-DQB1*06:02, was found to have a tendency towards a protective association, but this was not significant (OR = 0.37 [95% CI 0.08-1.37], P value = 0.06, Bonferroni-adjusted P value = 0.24).
The subhaplotype DRB1*04-DQB1*03:02 implicated to be associated with a greater risk of pain in previous studies was not found to be significantly associated with neuropathic pain in this study. P value = 0.49 (Table 3).
Table 3 - The distribution of subhaplotypes associated with a greater risk of pain in previous studies. Case Control OR (95% CI) P DRB1*04:01-DQB1*03:02 17 11 1.39 (0.59-3.44) 0.40 DRB1*04:04-DQB1*03:02 6 5 1.05 (0.26-4.46) 0.94 DR4-DQ8 (low resolution) 23 16 1.30 (0.62-2.79)* 0.49*These subhaplotypes were not found to be significantly associated with neuropathic pain in this study. Bold text indicates statistically significant difference with a P valus<0.05.
*Calculated by the Fishers exact test.
OR, odds ratio.
This study found that carriers of A*02:01-B*15:01-C*03:04-DRB1*04:01-DQB1*03:02 haplotype have an odds ratio of 9.3 for developing clinically significant persistent neuropathic pain after nerve injury and surgery. This study was a follow-up of several studies trying to characterize the differences between posttraumatic, postsurgery subjects with neuropathic pain and neuropathy without pain previously published by our group.34–37
4.1. Differences between groupsThe results obtained in those previous studies demonstrated no differences between these 2 cohorts regarding conditioned pain modulation, quantitative sensory testing, or systemic inflammation. The predictors often associated with the risk of developing persistent pain after surgery are related to surgical procedure, younger age, and mental health.38 Even one could argue that the classification of pain and painless groups was somewhat arbitrary because self-reported pain scores are highly subjective and can be influenced by, eg, sociocultural factors; in this study, no significant differences in the psychosocial status between the pain group and the painless were found. Although the genetic studies related to neuropathic pain faced not having a clearly defined phenotype4 in this study, all the subjects had a definite traumatic nerve lesion, described by the surgeon in detail. Thus, many confounders that could affect the comparison between subjects with pain and no pain were eliminated. We reported that participants with neuropathic pain showed a significantly higher prevalence of gain of function (P = 0.03) during bedside examination compared with participants with pain-free neuropathy. Other studies using QST have observed a higher association of hyposensitivity (loss of function) rather than gain of function with neuropathic pain.50,52 Hyposensitivity is more frequently linked to neuropathic pain in QST protocol, but bedside examination has a higher detection rate for touch-evoked allodynia when compared with QST.14,45
4.2. Human leukocyte antigen haplotype and persistent pain after surgeryThe finding that HLA haplotype is associated with an increased risk of development of neuropathic pain is consistent with the findings of a previous report.9 Two polymorphisms DRB1*04 (OR 2.28, 95% CI 1.32-3.96, P = 0.004) and DQB1*03:02 (OR 3.16, 95% CI 1.61-6.22, P = 0.009) were significantly more frequent in patients developing chronic pain after inguinal hernia surgery. The same association between the HLA allele DQB1*03:02 and neuropathic pain was replicated in a cohort of patients with sciatic pain due to lumbar disc herniation.9 The carriers of DQB1*03:02 had increased pain and slower functional recovery after lumbar disc surgery.9 All subjects with pain after inguinal hernia surgery who had the DQB1*03:02 allele also had the DRB1*04 allele. This result is expected because these 2 alleles are strong in linkage disequilibrium (LD).9 Further analyses revealed that persistent pain was most likely dependent on the DQB1*03:02 allele and not the DRB1*04 allele. In the same study by Dominguez et al.,9 no other allele difference was found to be significant in any of the cohorts.
4.3. Human leukocyte antigen haplotype and complex regional pain syndromeOf interest, these results are also consistent with the results of another study that found an association between the alleles HLA-B62 (molecularly typed HLA-B*15:01) (OR = 2.05 [95% CI 1.41-2.99], P = 0.0005) and HLA-DQ8 (molecularly typed DQB1*03:02) (OR = 1.75 [95% CI 1.20-2.57], P = 0.005) and the development of CRPS type I with dystonia.8 These 2 serotypes typically correspond to B*15:01 and DQB1*03:02 alleles.16 In the same study, the authors also found that the DRB1 serotype DRB1*04 is associated with a higher risk of CRPS. However, this finding was not statistically significant after compensating for multiple testing. Of all the DRB1-serotypes analysed, DRB1*04 was the closest to achieving a statistically significant association with the development of CRPS. As previously stated, the DRB1*04 allele and the DQB1*03:02 allele are strong in LD9 and can be assumed to occur together.
The comparison between persistent pain after nerve injury and repair with CRPS is interesting because CRPS is usually preceded also by trauma or surgical intervention.5,53 Another study examined HLA in the context of CRPS without dystonia, comparing it with a cohort of healthy Dutch blood donors.54 They tested B*15:01 and DQB1*03:02 without compensating for multiple testing and found an association with CRPS without dystonia for the DQB1*03:02 allele (OR = 1.65 [95% CI 1.12-2.42], P = 0.014), whereas no association with B*15:01 was found (OR = 1.22 [95% CI 0.78-1.92], P = 0.458). Consequently, one could argue that these results are against a haplotype association. However, it is important to note that the DQB1*03:02 would not have remained significant if it had been corrected for multiple testing and that HLA-B*15:01 occurs in multiple haplotypes. This study can therefore not be used to dismiss the hypothesis of a haplotype association.54
In comparison with the studies previously mentioned, our results did not show any associations regarding the DQB1*03:02, DRB1*04, or the B*15:01 alleles specifically. Although the
留言 (0)