
記住我
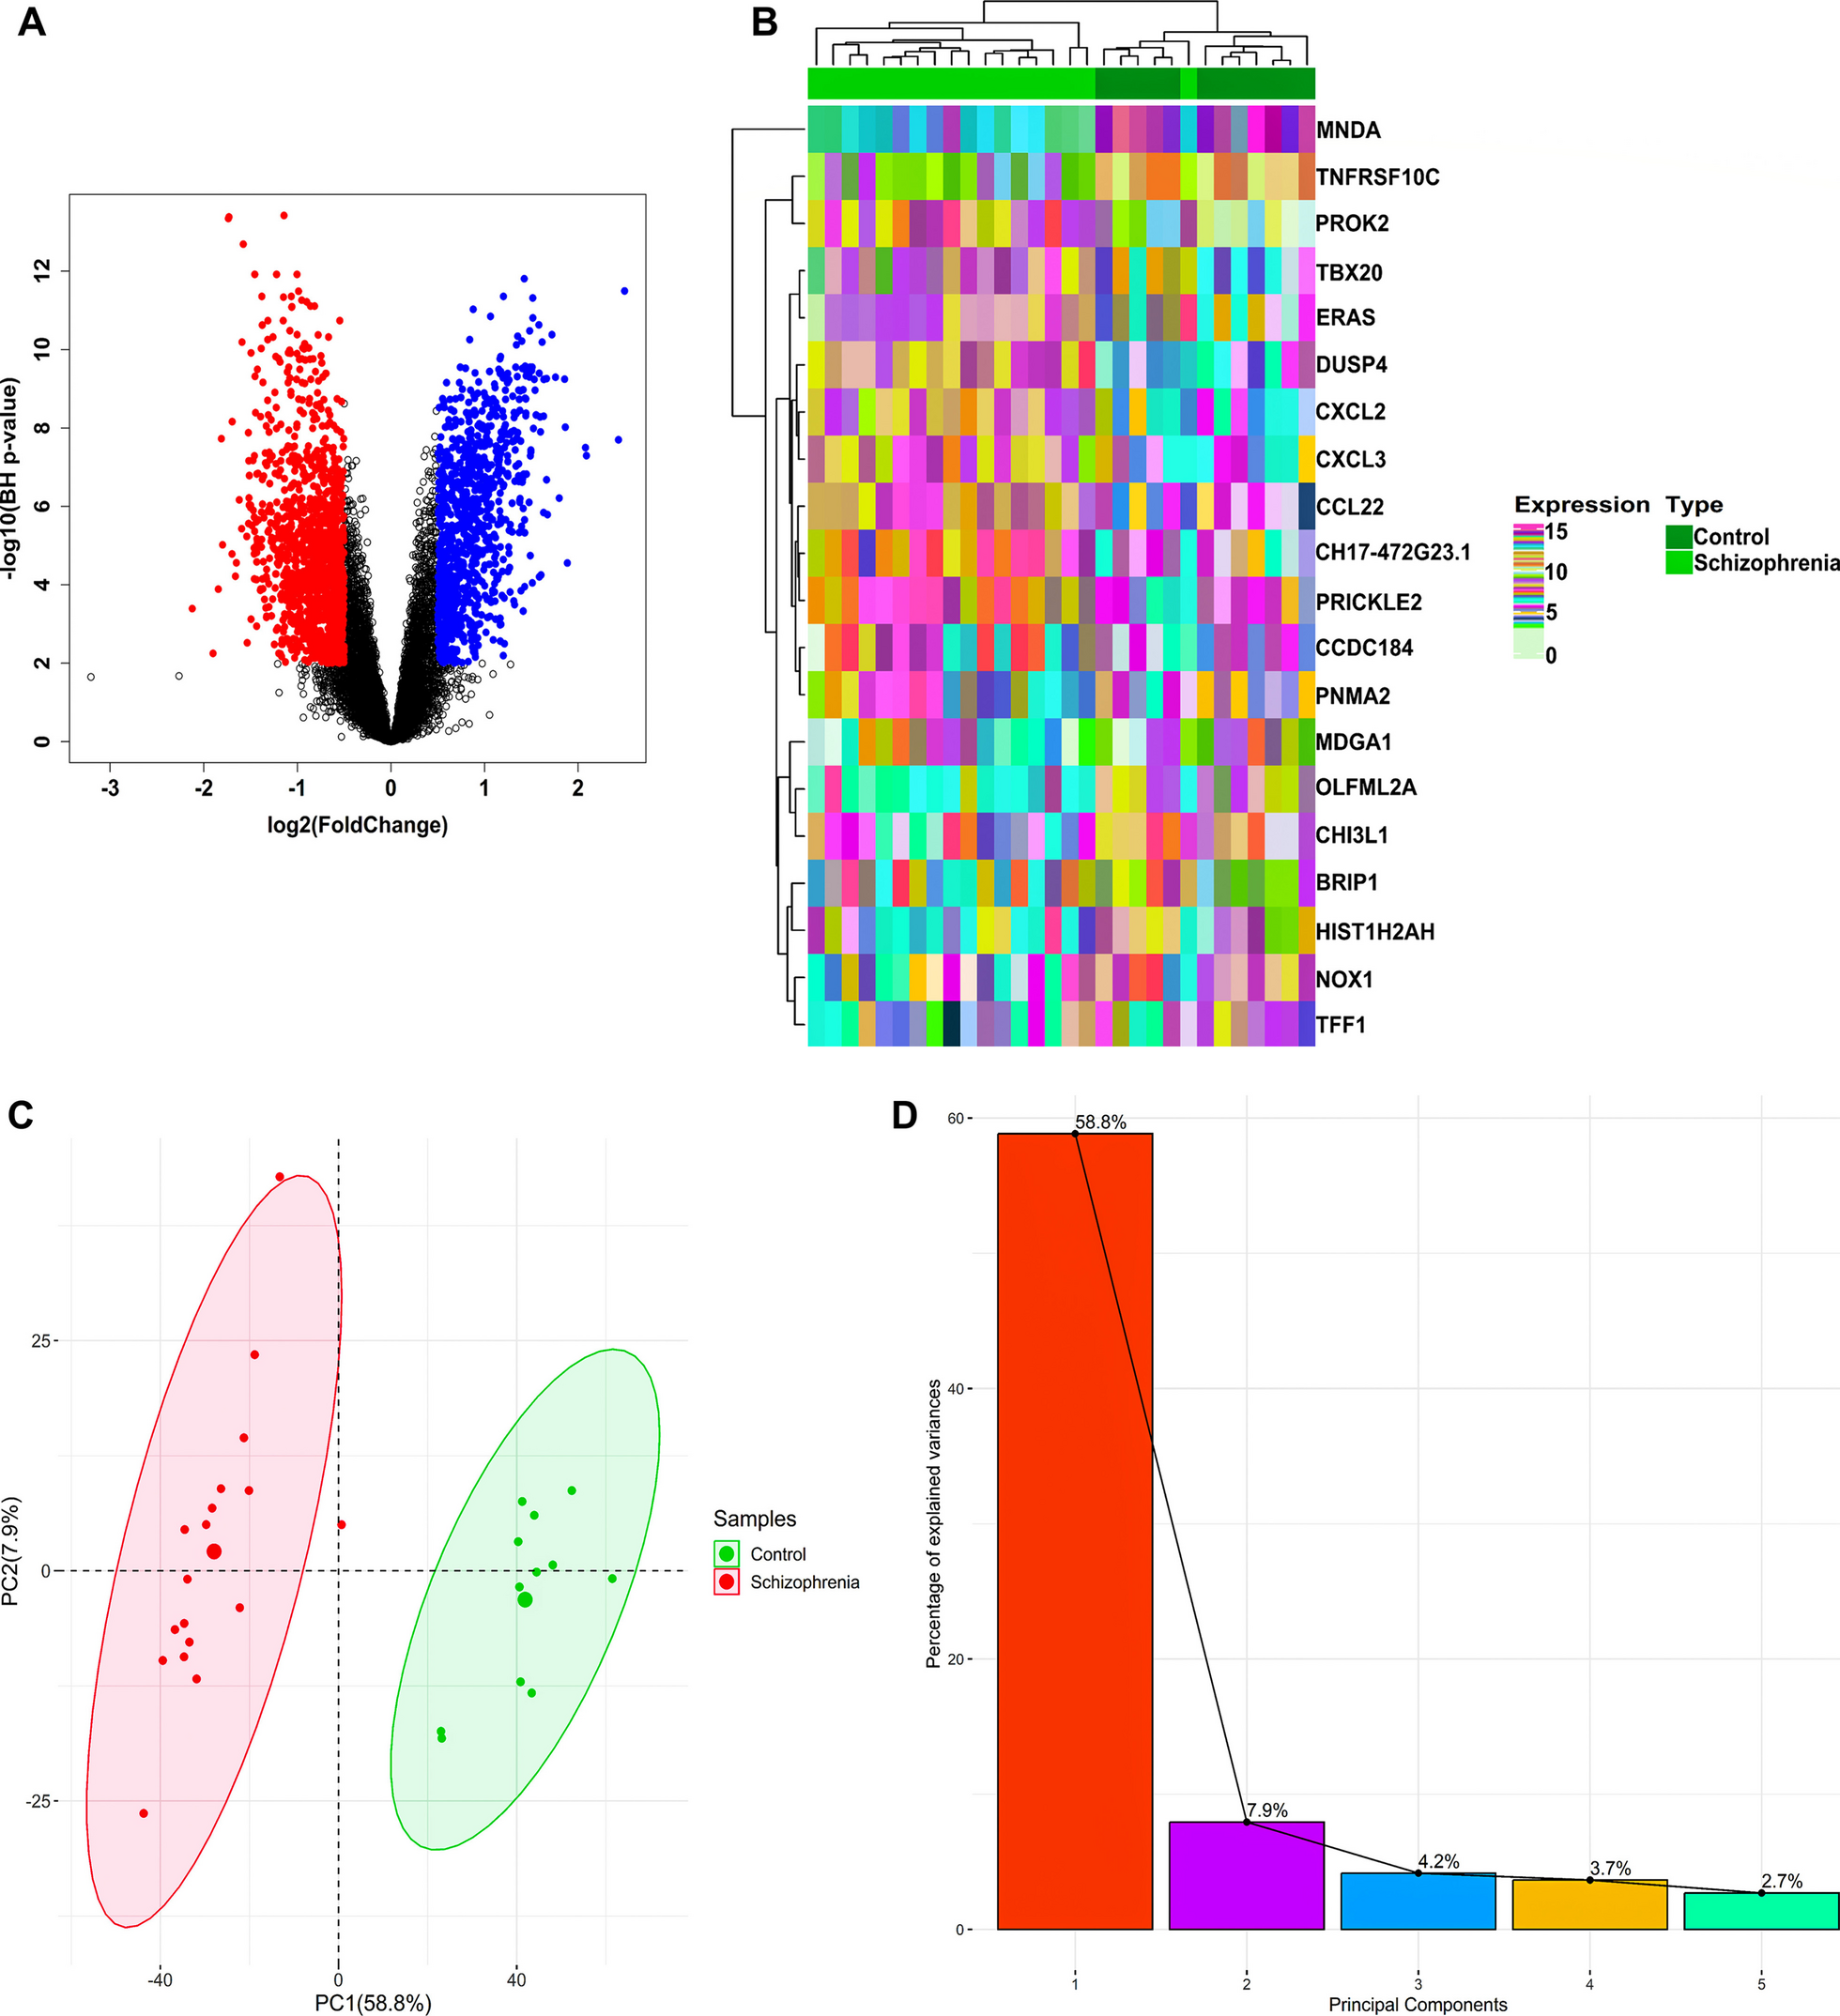
The three high-performance sequencing RNA datasets were retrieved from the NCBI (GEO) database. The GSE200197 dataset revealed 4432 significant circRNAs that included 3 upregulated (logFC > 2) and 8 downregulated (logFC < -2) DEcircRNA. Moreover, the GSE67979 dataset showed 36 (17 upregulated and 3 downregulated; |logFC|> 0.5) DEmiRNAs, and the GSE6575 dataset revealed 5019 significant genes that included 156 upregulated and 60 downregulated (|logFC|> 0.5) (Table 1). Results of circRNA, miRNA, and mRNA differential analysis are shown in the volcano plot (Fig. 2A–C). The Venn diagram tool was used to identify common differentially expressed miRNAs and the predicted MRE. Also, overlapped genes were identified between DEGs and miRNA targets. The basic characteristics of the 11 circRNAs are also presented in Table 2.
Table 1 Basic information of the microarray datasets from GEO. Differentially expressed DEcircRNAs and miRNAs/genes selected based on |logFC|> 2.0 and |logFC|> 0.5, respectivelyFig. 2
Results of differential analysis shown by volcano plot for gene, miRNA, and circRNA. A Volcano plot showing fold differences in circRNA expression and p value. B Fold differences in genes. And C for miRNAs. Red points represent dysregulated expression
Table 2 Information of the 11 DEcircRNAs in this study (|logFC|> 2)Identification of circRNA–miRNA interactionsCircRNA can play pivotal roles in many disorders by functioning as a “sponge” to miRNAs. Therefore, some affected miRNAs were predicted based on this ceRNA theory. The structures of the 11 circRNAs are shown in Fig. 3, all of which have MRE, RBP, and ORF. Two online databases, CSCD and CircInteractome, were used to predict potential miRNAs targeted. A total of 658 MREs were identified for DEcircRNAs, and 8 significant interacting miRNAs were obtained by overlapping 239 MREs with 20 DEmiRNAs.Then, 4 circRNA–miRNA interactions, including hsa_circ_0053004-miR-1276/miR-940, hsa_circ_0125982/miR-330, hsa_circ_0088217-miR-330, and hsa_circ_0129247-miR-564/miR-330/miR-142/miR144/miR-577/miR-921 were identified. Moreover, DIANA-miRPath was used to investigate the signaling pathways in which 14 miRNAs may be involved. According to Fig. 4, these miRNAs are involved in the GABAergic synapses, thyroid hormone signaling pathway, FoxO signaling pathway, and TGF-beta signaling pathway.
Fig. 3
structures of the 11 DEcircRNAs. The various colors in the outer and inner ring represent the diverse exons and the positions of MRE, RBP, and ORF
Fig. 4
Significant signaling pathways of the 8 miRNAs predicted by the DIANA-miRPath
Identification of overlapped genesThe target prediction was done for 8 miRNAs associated with 4 DEcircRNAs to investigate how miRNAs are involved in autism disorder. In total, 5930 target mRNAs were identified using TargetScan and miRDB databases. Then, 71 overlapping interacting genes were selected by the intersection of 216 DEGs from gene expression data and target genes.
Construction of the circRNA–miRNA–mRNA networkTwo separate circRNA–miRNA–mRNA networks were constructed based on 4 DEcircRNAs (including 1downregualate, 3 upregulated), 8 interacting DEmiRNAs, and 71 interacting DEGs identified through bioinformatics prediction. One including 1 downregulated circRNA nodes, 2 miRNA nodes, 36 mRNA nodes, and 30 edges (Fig. 5A). Another network consisting 3up-egulated circRNA nodes, 6 miRNA nodes, 35 mRNA nodes, and 87 edges (Fig. 5B).
Fig. 5
The circRNA–miRNA–mRNA network. A network with downregulated circRNA. B network with upregulated circRNAs. The oval nodes represent the circRNAs, the red nodes represent the interacting miRNAs, and the rectangular nodes represent the interaction genes
Functional and pathway enrichment analysesTo better explore the potential mechanisms of genes in the ceRNA regulatory network, KEGG pathway enrichment analysis and GO analysis were accomplished, which comprises biological process (BP), molecular function (MF), and cellular component (CC). The top 10 highly enriched GO and KEGG pathways by Metascape database are shown in Fig. 6A, and the top 20 highly enriched GO and KEGG terms analyzed by R software are presented in Fig. 6B. GO and KEGG analysis showed that the interacting genes were involved in transcriptional regulation by MECP2, hippocampal synaptogenesis and neurogenesis, cell junction assembly, neuron projection development, commissural neuron axon guidance, and axon guidance. GO analysis showed that, in the case of BP, these overlapped genes were mainly involved in peptidyl serine phosphorylation, regulation of metal ion transport, neuron projection development, sympathetic ganglion development, and brain development. For MF, overlapped genes were mainly enriched in transmembrane receptor protein tyrosine kinase activator activity, commissural neuron axon guidance, regulation of mitotic cell cycle, calmodulin-dependent protein kinase activity, and cell junction assembly. For CC, neuron projection, endocytic vesicle, intracellular membrane-bounded organelle, ciliary landscape, and axon were predicted.
Fig. 6
GO enrichment analysis and KEGG enrichment analysis of differential genes in ASD and control groups. A The top 20 GO and pathway enrichment analyses of biological processes, cellular components, and molecular functions by Metascape database. B KEGG and GO enrichment analysis of differential genes in the ASD conducted by clusterProfiler package R software
Construction of the protein–protein interaction and hub genes identificationThe NetworkAnalyst tool linked with the STRING database was used to construct a PPI network based on the 86 DEGs (Fig. 7A). The PPI network contained 984 nodes and 2607 edges. Then, the cytoHubba plugin in Cytoscape 3.9.1 was used to screen the hub genes. Ten genes (CAMK2A, CAMK2D, CAMK2G, MECP2, CAMK4, NRG1, DLG1, BDNF, MAPK1, and PRKCA) were identified as hub genes in this cluster, including ten nodes and 26 edges (Fig. 7B).
Fig. 7
A The PPI network of overlapped interacting genes. Interacting DEGs are shown by the nodes, and interactions between genes by the edges. B Top ten hub genes constructed thereby Cytohubba plugin. The network shows the degree of significance of hubs through a color scale ranging from red (the most important) to yellow (less important)
Candidate compounds from connectivity map analysisThe regulatory networks of circRNAs/miRNAs/mRNAs were constructed, and dysregulated genes in the network were uploaded to the CMap website. Then, compounds with potential influence on ASD were predicted. GSK3β inhibitor (SB216763), with the highest positive scores, was considered a potential drug for ASD treatment.
Pharmacogenomics analysis for hub genes to find potential drugThe DGIdb website was used to perform drug–gene interaction analysis for the ten hub genes identified in the PPI network. Finally, it was found that Haloperidol, nystatin, and paroxetine are potential drugs and might be effective in treating ASD since they were closely associated with the four hub genes (CAMK2G, BDNF, NRG, MAPK1).
留言 (0)