
記住我


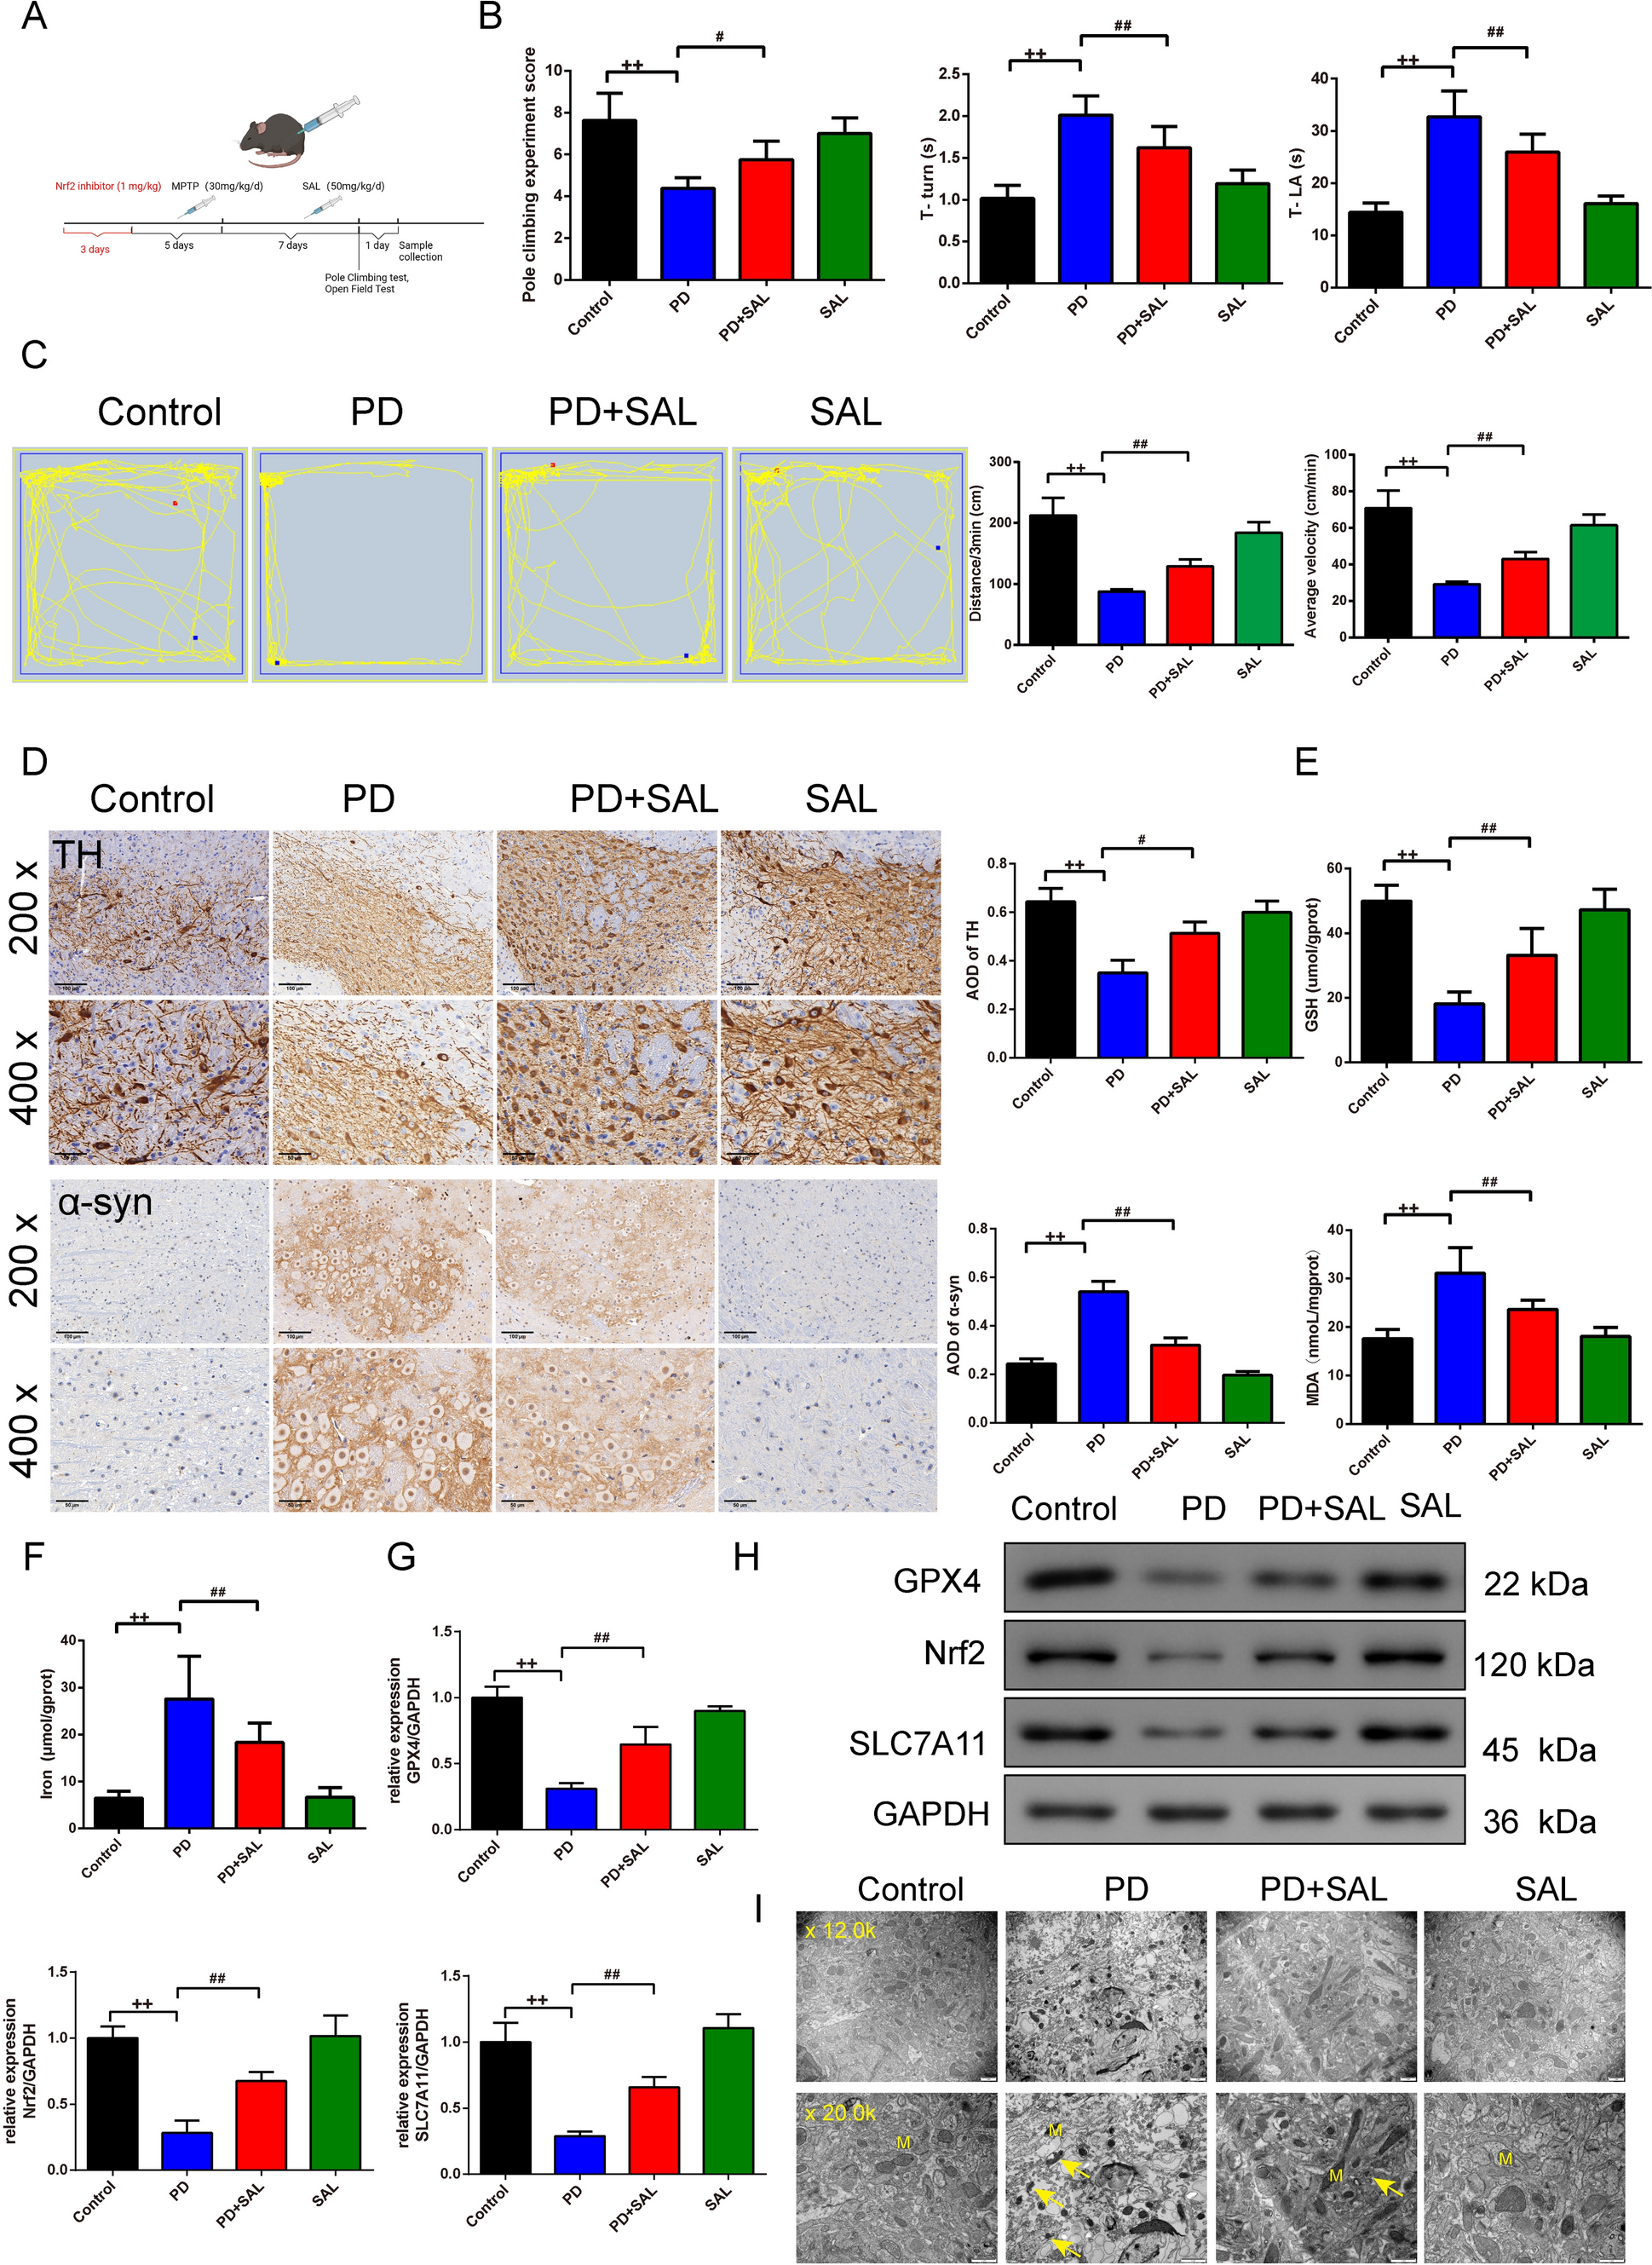

The score of the pole-climbing test and the time of the T-turn, T-LA comparison of the groups in mice were recorded, we found that PD mice had lower scores (Fig. 1B, P = 0.000; F = 19.921, df = 3) as well as the lower T-turn(Fig. 1B, P = 0.001; F = 37.887, df = 3), T-LA (Fig. 1B, P = 0.001; F = 56.700, df = 3) than control mice. The treatment of SAL successfully enhanced the score, T-turn, and T-LA (Fig. 1B, P < 0.01).
In Fig. 1C, the open field test showed that the track of mice 3 min total traveled distance (Distance/3 min) (Fig. 1C, F = 77.188, df = 3, P = 0.000) and average velocity (average velocity/3 min) (Fig. 1C, F = 77.199, df = 3, P = 0.000)in PD mice were lower than control mice (Fig. 1C, P = 0.000) whereas the addition of SAL offset the effect that PD mice led to (Fig. 1C, P = 0.000).
The positive expression of the TH and α-syn in the substantia nigra of the mice were stained by the IHC staining (Fig. 1D). We observed that PD mice led to less expression of the TH (Fig. 1D, F = 19.821, df = 3, P = 0.000) whereas the more expression of the α-syn (Fig. 1D, F = 80.064, df = 3, P = 0.000) than control mice (Fig. 1D, P = 0.000). SAL adverse the effect that PD mice caused [Fig. 1D, P = 0.004 (TH), P = 0.000 (α-syn)].
Using ELISA kits and Western blot, we found that the level of the GSH (Fig. 1E, F = 46.647, df = 3, P = 0.000), GPX4 (Fig. 1G, H, F = 40.517, df = 3, P = 0.000), Nrf2(Fig. 1G, H, F = 31.606, df = 3, P = 0.000), and SLC7A11(Fig. 1G, H, F = 43.310, df = 3, P = 0.000) was reduced while MDA (Fig. 1E, F = 32.646, df = 3, P = 0.000)and iron content (Fig. 1F, F = 31.147, df = 3, P = 0.000)was enhanced in substantia nigra of the PD mice than control mice(P = 0.000), and SAL treatment offset the effects that PD mice caused [Fig. 1E–H, P = 0.002 (Nrf2, SLC7A11), P = 0.001 (GPX4, iron content) P = 0.000 (MDA,GSH)].
Under the TEM assay (Fig. 1I), the mitochondrial structure in the substantia nigra of the control group and SAL group was complete, and the shape was mostly round or oval. Compared with the control group, mitochondria in the substantia nigra of PD mice were irregular, the outer membrane was broken, wrinkled, and mitochondria were deeply stained. Compared with the model group, mitochondrial structure in the PD + SAL group was improved, and wrinkling was relieved. In addition, in Figure S1, with the addition of Nrf2 inhibitor, it reduced the score of the pole-climbing test (Figure S1 A, F = 17.216, df = 2, P = 0.000), the expression of GPX4 (Figure S1 C-D, F = 20.654, df = 2, P = 0.002), Nrf2 (Figure S1 C-D, F = 64.891, df = 2, P = 0.000), SLC7A11 (Figure S1 C-D, F = 124.328, df = 2, P = 0.000) tested by western blot, and it successfully enhanced T-turn (Figure S1 B, F = 48.113, df = 2, P = 0.000) and T-LA (Figure S1 B, F = 33.668, df = 2, P = 0.000) (Figure S1, P = 0.000, 0.001, 0.0002, 0.008, 0.010).
SAL Protects Dopaminergic Neurons by Inhibiting Ferroptosis in SH-SY5Y CellsIn Fig. 2A, B, CCK8 was used to assess the cell viability of the SH-SY5Y cells under the various dosages (5, 10, 20 μM) of the SAL and under the ferroptosis in 24 and 48 h. The results demonstrated that the different dosages (5, 10, 20 μM) of SAL caused no side effects on the cell ability (Fig. 2A). Under the different treatments concerning erastin, SAL, and fer-1 in SH-SY5Y cells, the results showed that erastin induced lower cell viability than the control group in 24 h (Fig. 2B, F = 3.483, df = 4, P = 0.022) and 48 h (Fig. 2B, F = 13.281, df = 4, P = 0.000). Apart from that, after 48 h, erastin+SAL and erastin+Fer-1 groups had higher cell viability than the erastin group (Fig. 2B, P = 0.006, 0.001).
Fig. 2
SAL protects dopaminergic neurons through inhibiting ferroptosis in SH-SY5Y cells. CCK8 was used to assess the cell viability of the SH-SY5Y cells under the different dosages (5, 10, 20 μm) of the SAL (A) and under the ferroptosis (B) in 24 h and 48 h, n = 6; C, D The TH and α-syn fluorescence intensity of SH-SY5Y cells inhibited by SAL and ferroptosis were detected by immunofluorescence (magnification 200×, scale bar: 100 μm), n = 3; E, F The protein expression of the GPX4, Nrf2, SLC7A11 of the SH-SY5Y cells was observed by the western blot, n = 3; *P < 0.05 and **P < 0.01 vs. control group, $P < 0.05 and $$P < 0.01 vs. erastin group. SAL Salidroside, Fer-1 Ferrostatin-1, CCK8 Cell Counting Kit-8, TH Tyrosine Hydroxylase, GPX4 Glutathione Peroxidase 4, Nrf2 Nuclear Factor E2-Related Factor 2, SLC7A11 Solute Carrier Family 7 Member 11
In Fig. 2C-F, the TH and α-syn fluorescence intensity in SH-SY5Y cells were detected by immunofluorescence staining and the protein expression of the GPX4, Nrf2, SLC7A11 in SH-SY5Y cells. Results revealed that the fluorescence intensity of TH (Fig. 2C, D, F = 38.091, df = 4, P = 0.000) and the relative protein expression of the GPX4 (Fig. 2E, F, F = 34.425, df = 4, P = 0.000), Nrf2(Fig. 2E, F, F = 32.083, df = 4, P = 0.000), and SLC7A11 (Fig. 2E, F, F = 22.470, df = 4, P = 0.000) in SH-SY5Y cells in the erastin group was lower than the control group (Fig. 2C–F, P = 0.000). Moreover, the erastin+SAL and erastin+Fer-1 groups led to a higher expression of those than the erastin group [Fig. 2C–F, P = 0.000(GPX4, SLC7A11), P = 0.002, 0.003(Nrf2)]. The expression of the α-syn (Fig. 2C, D, F = 18.010, df = 4, P = 0.000) showed the opposite impact. In Fig. 3A, B, the level of the iron, 4-HNE (Fig. 3B, F = 58.470, df = 4, P = 0.000), and MDA (Fig. 3B, F = 12.584, df = 4, P = 0.000) tested by ELISA kits was observed and they were expressed higher in the erastin group than control group (Fig. 3B, P = 0.000).whereas the lower expression in erastin + SAL and erastin + Fer-1 groups than erastin group [Fig. 3B, P = 0.005, 0.001 (iron); P = 0.004, 0.000 (MDA); P = 0.000 (4-HNE)].
Fig. 3
SAL protects dopaminergic neurons through inhibiting ferroptosis in SH-SY5Y cells. A Iron level in SH-SY5Y cells was evaluated by the kit, n = 8; B ELISA kits were applied to assess the level of the 4-HNE and MDA in SH-SY5Y cells, n = 8; C TEM was used to observe the minor change in SH-SY5Y cells, “M” stands for mitochondria (magnification 10.0 k×, scale bar 2 μm; magnification 25.0 k×, scale bar 500 nm); D The changes of MMP in SH-SY5Y cells were detected by JC-1 fluorescent probe (magnification 400×, 50 μm), n = 3. **P < 0.01 vs. control group, $P < 0.05 and $$P < 0.01 vs. erastin group. SAL Salidroside, Fer-1 Ferrostatin-1, 4-HNE 4-Hydroxynonenal, TH Tyrosine Hydroxylase, ELISA Enzyme-Linked Immunosorbent Assay, MDA Malondialdehyde, TEM Transmission Electron Microscopy, MMP mitochondrial transmembrane potential
In Fig. 3C, under TEM, the mitochondria of SH-SY5Y in the control and SAL groups were intact. Compared with the control, most of the mitochondrial ridges of SH-SY5Y in the erastin group were reduced or disappeared, and the outer membrane was ruptured. Compared with the erastin group, the erastin+SAL and erastin+fer-1 groups had improved mitochondrial ridge reduction or disappearance, outer membrane rupture, and volume reduction.
With the JC-1 staining (Fig. 3D), the MMP (Fig. 3D, F = 102.434, df = 4, P = 0.000) of SH-SY5Y cells in the erastin group was significantly decreased than control group (Fig. 3D, P = 0.000), while the MMP of SH-SY5Y cells in erastin+SAL group and erastin+Fer-1 groups was significantly increased than in erastin group (Fig. 3D, P = 0.001).
SAL Alleviates Ferroptosis in SH-SY5Y Cells Through the Nrf2/GPX4 PathwayThe protein expression of the α-syn (Fig. 4A, F = 71.656, df = 3, P = 0.000) in SH-SY5Y cells observed by Western blot showed that WT-α-syn and A53T-α-syn groups had higher expression of the α-syn than the mock group (Fig. 4A, P = 0.000).
Fig. 4
SAL alleviates ferroptosis in SH-SY5Y cells through the Nrf2/GPX4 pathway. A The protein expression of the α-syn in SH-SY5Y cells was observed by the western blot, n = 3; B CCK8 was used to assess the cell viability of the SH-SY5Y cells in 24 and 48 h with the interfere of the Nrf2 inhibition, n = 6, C, D the protein expression of the Nrf2, GPX4, SLC7A1 in SH-SY5Y cells was observed by the western blot, n = 3; E, F The TH and α-syn fluorescence intensity of SH-SY5Y cells with SAL and Nrf2 inhibition were detected by immunofluorescence (magnification 200×, scale bar: 100 μm), n = 3; @P < 0.05 and @@P < 0.01 vs. mock group, #P < 0.05 and ##P < 0.01 vs. A53T-α-syn group, &P < 0.05 and &&P < 0.01 vs. A53T-α-syn + SAL group. SAL Salidroside, CCK8 Cell Counting Kit-8, TH Tyrosine Hydroxylase, GSH Glutathione, MDA Malondialdehyde, GPX4 Glutathione Peroxidase 4, Nrf2 Nuclear Factor E2-Related Factor 2, SLC7A11 Solute Carrier Family 7 Member 11
In Fig. 4B, CCK8 was used to assess the cell viability of the SH-SY5Y cells at 24 and 48 h with the interference of the Nrf2 inhibition. The results confirmed that the A53T-α-syn group had lower cell viability in 24 h (Fig. 4B, F = 8.885, df = 5, P = 0.000) than the mock group (Fig. 4B, P = 0.000). In 48 h (Fig. 4B, F = 20.239, df = 5, P = 0.000), the WT-α-syn and A53T-α-syn groups had lower cell viability than the mock group (Fig. 4B, P = 0.000). The addition of the SAL enhanced the cell viability of than A53T-α-syn group (Fig. 4B, P = 0.001). The addition of ML385 offset the effect that SAL addition caused (Fig. 4B, P = 0.003).
In Fig. 4C–F, the protein expression of the GPX4, Nrf2, SLC7A11, and the TH and α-syn fluorescence intensity in SH-SY5Y cells were detected by Western blot and immunofluorescence. The results revealed that the fluorescence intensity of TH (Fig. 4E, F, F = 33.267, df = 5, P = 0.000) and the relative protein expression of the GPX4 (Fig. 4C, D, F = 83.300, df = 5, P = 0.000), Nrf2 (Fig. 4C, D,F = 36.629, df = 5, P = 0.000), and SLC7A11 (Fig. 4C, D, F = 18.365, df = 5, P = 0.000) in SH-SY5Y cells in WT-α-syn and A53T-α-syn groups was lower than mock group (Fig. 4C, D, P = 0.000). Moreover, the addition of the SAL enhanced the expression of them than the A53T-α-syn group (Fig. 4C, D, P = 0.000, 0.001). The addition of ML385 offset the effect that A53T-α-syn + SAL caused (Fig. 4C, D, P = 0.000, 0.001). The expression of α-syn (Fig. 4E, F, F = 32.354, df = 5, P = 0.000) showed the opposite impact (P < 0.05 and P < 0.01). The trend of the MDA (Fig. 5A, F = 108.711, df = 5, P = 0.000), 4-HNE (Fig. 5A, F = 87.016, df = 5, P = 0.000), and iron content (Fig. 5B, F = 19.170, df = 5, P = 0.000) tested by the ELISA kits acted as α-syn expressed (Fig. 5A, B, P = 0.000, 0.002).
Fig. 5
SAL alleviates ferroptosis in SH-SY5Y cells through the Nrf2/GPX4 pathway. A ELISA kits were applied to assess the level of the MDA and 4-HNE in SH-SY5Y cells, n = 8; B Iron level in SH-SY5Y cells evaluated by the kit, n = 8; C TEM was used to observe the minor change in SH-SY5Y cells (magnification 10.0 k×, scale bar: 2 μm; magnification 25.0 k×, scale bar: 500 nm); D the changes of MMP in SH-SY5Y cells were detected by JC-1 fluorescent probe (magnification 400 × , 50 μm), n = 3; @@P < 0.01 vs. mock group, ##P < 0.01 vs. A53T-α-syn group, &P < 0.05 vs. A53T-α-syn + SAL group. SAL Salidroside, ELISA Enzyme-Linked Immunosorbent Assay, MDA Malondialdehyde, 4-HNE 4-Hydroxynonenal, TEM Transmission Electron Microscopy, MMP mitochondrial transmembrane potential
In Fig. 5C, under TEM, in SH-SY5Y cells of the Mock group, mitochondria were mostly intact. In comparison to the Mock group, in the WT-α-syn and A53T-α-syn groups, most mitochondria in SH-SY5Y dopaminergic neurons exhibited a reduction or loss of cristae and disruptions in the outer membrane. When comparing the A53T-α-syn group to the SAL group, mitochondria in SH-SY5Y dopaminergic neurons of the SAL group remained mostly intact, with only a slight reduction in cristae observed in the A53T-α-syn+SAL group. However, when comparing the A53T-α-syn+SAL group to the A53T-α-syn+SAL+ML385 group, there was an increased occurrence of reduced cristae in mitochondria.
With the JC-1 staining (Fig. 5D), the MMP (Fig. 5D, F = 136.018, df = 5, P = 0.000) of SH-SY5Y cells in WT-α-syn and A53T-α-syn groups was significantly decreased compared with the Mock group (Fig. 5D, P = 0.000); Compared with A53T-α-syn group, the MMP of SH-SY5Y cells in A53T-α-syn+SAL group was significantly increased (Fig. 5D, P = 0.000).Compared with the A53T-α-syn+SAL group, the MMP of SH-SY5Y cells in the A53T-α-syn+SAL+ML385 group was significantly increased (Fig. 5D, P = 0.005).
留言 (0)