
記住我
We included 591 individuals from the PLIC study, a population-based cohort representative of the general population of the northern area of Milan (“PLIC”, “Progressione delle Lesioni Intimali Carotidee”) [16]. PLIC study is an ongoing single-centre, observational, cross-sectional, and longitudinal study of subjects enrolled on a voluntary basis in 1998 to 2000 and followed up for about 20 years (to date a total of 6 visits, on average every 4 years [17]. The study is conducted by the Center for the Study of Atherosclerosis at the E. Bassini Hospital (Cinisello Balsamo, Milan, Italy) with the coordination of the Epidemiology and Preventive Pharmacology Centre (SEFAP) of the Università degli Studi di Milano (Milan, Italy).
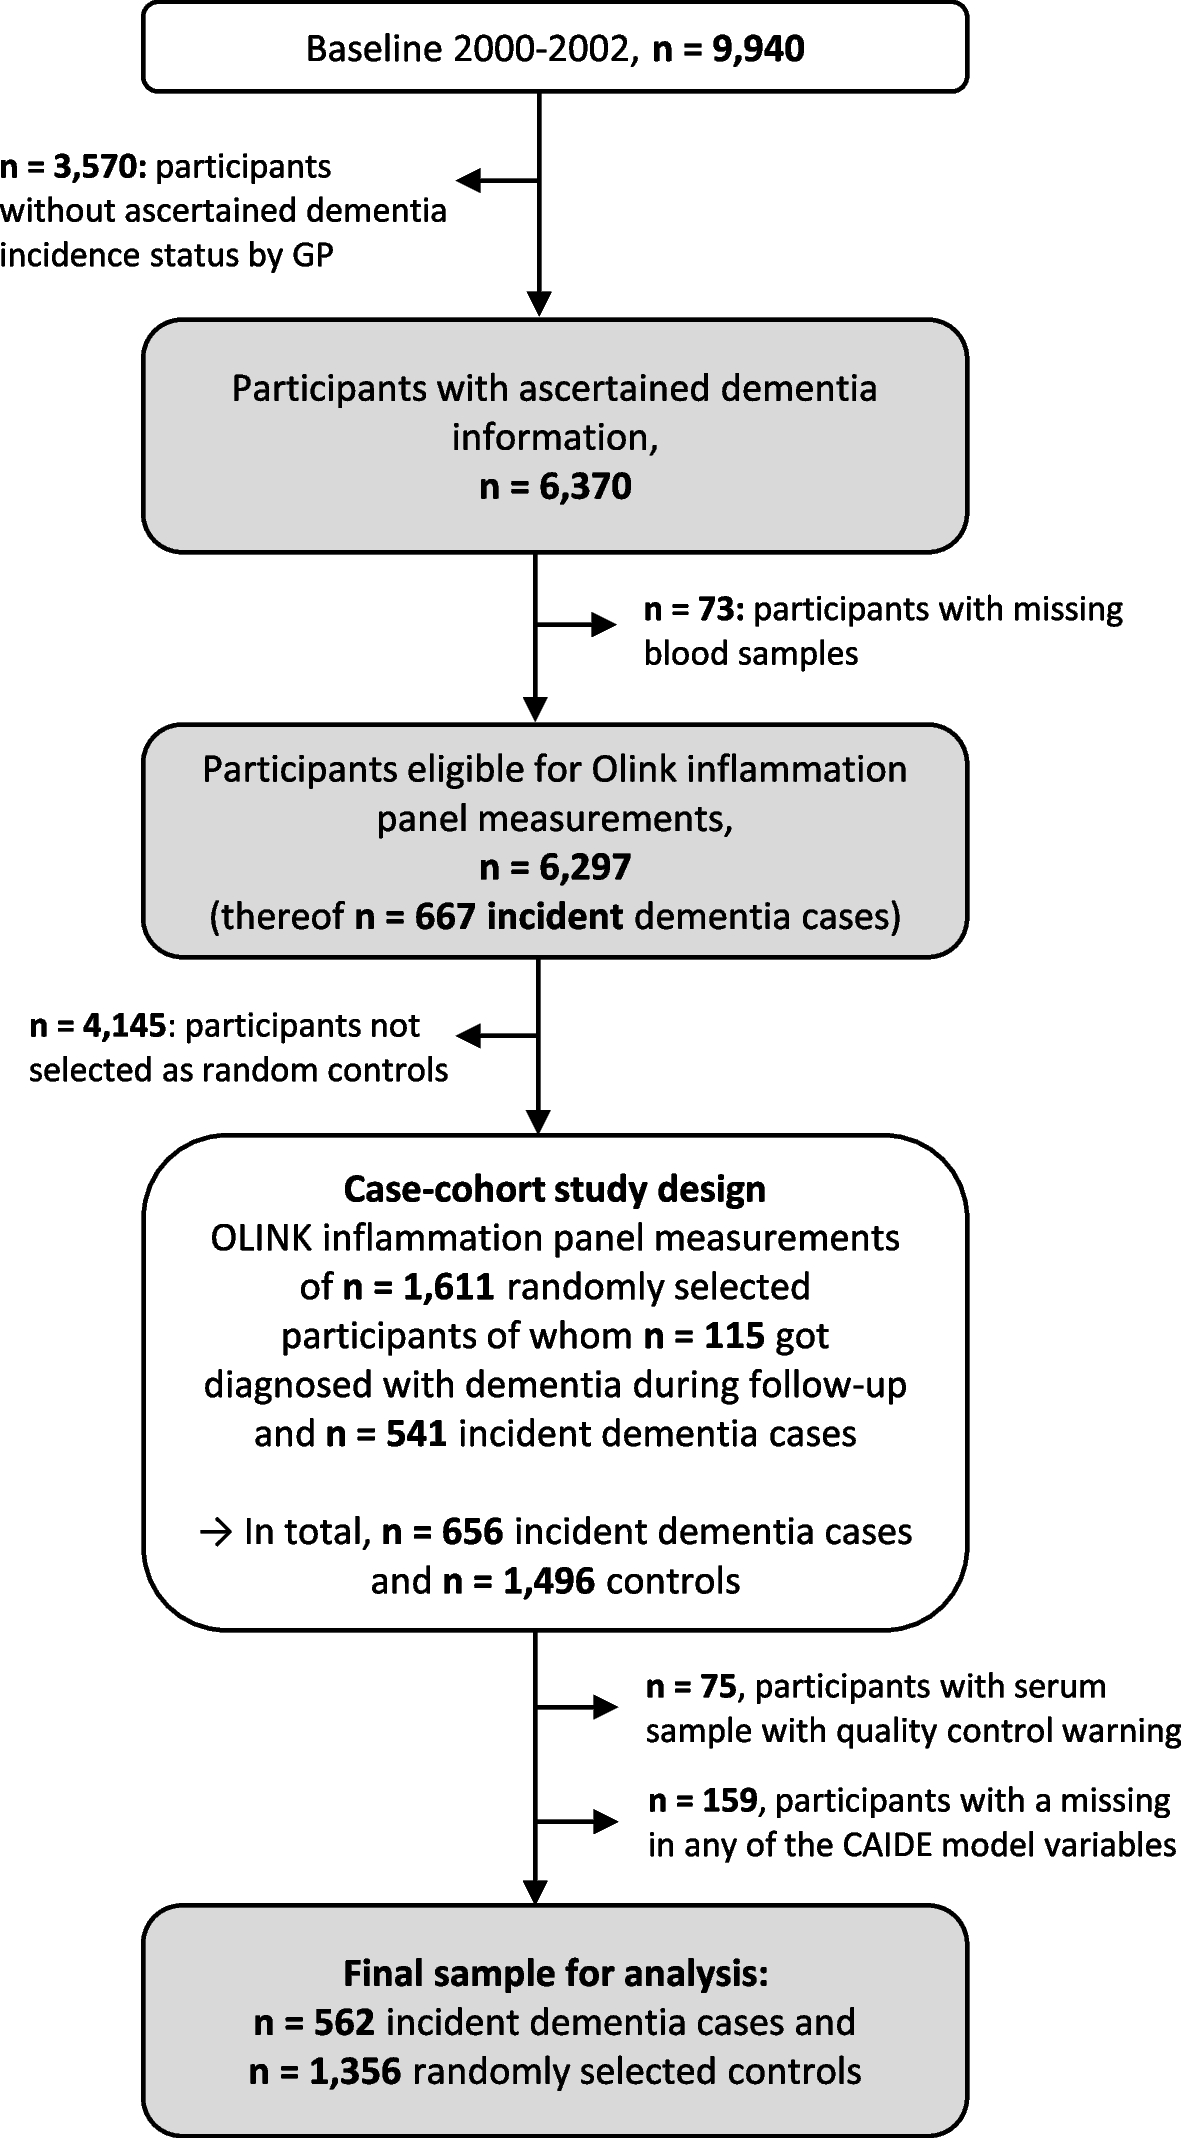
The flow chart shown in Supplementary Fig. 1 explains the methodology used to select a part of total PLIC participants.
The study was approved by the Ethics Committee of the University of Study of Milan (approved on 06-02-2001 SEFAP protocol n°0003/2001). Informed consent was obtained from subjects (all over 18 years-old), in accordance with the Declaration of Helsinki.
TaqMan SNP genotyping assayDNA was extracted from peripheral blood of healthy subjects (QIAamp DNA blood midi kit, Qiagen, Düsseldorf, Germany) and was genotyped using Taqman probe rs2070325.
Measurement of the plasmatic expression of the proteomics panelThe expression of 368 proteins were analysed by Proximity Extension Assay (PEA) using Cardiovascular II, Cardiovascular III, Cardiometabolic, and Inflammation panels of the OlinkTM platform, as previously described [16, 18]. A total number of 10/368 proteins were present on more than one panel, with 358 unique proteins analysed.
Data are expressed as Normalized Protein eXpression (NPX) values.
Statistical analysis of proteins expression dataThe two-sided Wilcoxon rank sum test was applied to test the null hypothesis of no difference in terms of proteins expression between the homozygous for the rs207035 minor allele (GG), and the homozygous and heterozygous for rs207035 major allele (AA/AG). Non-parametric statistical tests were applied since most proteins’ distribution deviated significantly from the normality assumptions in at least one of the two genotypes groups (Shapiro-Wilk test of normality p-value < 0.05). The median of the difference between BPIFB4_rs2070325_(GG) and BPIFB4_rs2070325_(AA/AG) genotypes and corresponding 95% confidence interval has been computed to estimate the difference in location parameters for each protein as provided by the wilcox.test function implemented in the R package called stats. The Benjamini-Hochberg (BH) correction has been applied to control the false discovery rate: BH adjusted p-values < 0.05 have been considered evidence of statistically significant differences in terms of proteins expression between genotypes.
The Spearman correlation coefficient has been computed to estimate the degree of correlation between proteins analysed in two different panels. Proteins showing Spearman r < 0.8 and/or showing evidence of differential expression (p-value < 0.05) in only one out of the two panels have been excluded from the analysis. In the remaining cases one of the two duplicated proteins has been randomly selected to be included in the analysis. Quantile – quantile plots of observed vs. expected -log10 BH unadjusted p-values and λ value have been obtained by the qqPlot (GWASTools package) and P_lambda (QCEWAS package) functions.
The quantile regression was applied by the rq function implemented in the R package called quantreg to estimate the difference in terms of median value of each protein’s distribution between BPIFB4_rs2070325_(GG) and BPIFB4_rs2070325_(AA/AG) genotypes with/without adjustment for covariates. A bootstrap approach (n = 10,000 bootstrap samplings) has been applied to estimate standard error and p-value.
Missing values for the LDL-C variable (n = 5 subjects with missing values) have been imputed by the median value of the corresponding variable’s distribution before performing the quantile regression analyses.
Gene ontology enrichment analysisProteins have been mapped to the corresponding Entrez gene ID by the bitr function implemented in the R package called clusterProfiler or by manual mapping. Gene Ontology (GO) analyses have been performed exploring molecular function (MF), biological process (BP) and cellular components (CC) aspects by the enrichGO function implemented in the R package called clusterProfiler. To this aim, the set of genes reaching BH unadjusted p-value < 0.05 from univariate tests comparing proteins expression between genotypes (thus defining the set of genes of interest) and the complete set of analysed proteins passing quality control and with a corresponding Entrez ID (background genes) were used as input. The minimal size of genes annotated by ontology term for testing (minGSSize) was set to 10, while no limit was set to the maximal size of genes annotated for testing (maxGSSize). BH adjusted p-values < 0.05 have been considered evidence of statistically significant enrichment of a specific gene ontology category.
Statistical and gene ontology analyses have been performed by functions implemented in the R software environment for statistical computing and graphics version 4.3.1 (www.r-project.org).
Cell maintenance, treatment and transfectionHuman colon cancer cells (Caco-2) were purchased from ATCC (Tell City, USA) and maintained in RPMI (Thermo Fisher Scientific, Waltham, USA) supplemented with 10% foetal bovine serum (FBS) (Thermo Fisher Scientific).
Cells were transfected with the indicated plasmids using the TransiT-X2 reagent (Mirus, Madison, USA) according to the manufacturer’s instructions. After 48 h, butyrate (2 mM, Sigma-Aldrich, United Kingdom) was added at indicted time.
Animal model and primary murine splenocytes isolationWe used n = 4 C57BL/6 mice from Jackson Laboratories. The Institutional Animal Care Use Committee of Neuromed Medical Center approved all animal experiments [n° 327/2023-PR]. Mouse colonies were maintained in the animal facility at IRCCS Neuromed, Pozzilli (IS), Italy. Ten-week-old male C57BL/6 mice were anesthetized with 5% isoflurane in 100% O2 (delivery rate, 5 L/min), and placed in dorsal recumbent position on a homoeothermic blanket (N-HB101-S-402) to maintain body temperature at 37 °C. Anaesthesia was maintained with 1% isoflurane in 100% O2 at 1.5 L/min, administered by means of a facemask connected to a coaxial circuit (Fluovac anaesthetic mask), and eutanized by beheading to collect tissue samples. In details, to isolate murine splenocytes, spleen was scalpel-cut and maintained into tubes containing RPMI-1640 (Gibco®, ThermoFisher Scientific) supplemented with 10% (v/v) fetal serum bovine (FBS, Gibco®, ThermoFisher Scientific) and 2% (v/v) penicillin-streptomycin (Aurogene). Then, spleen was placed on a 70 μm cell strainer previously held on a 50mL tube. RPMI-1640-supplemented was added and the spleen was pressed with the plunger of a 5 mL syringe. Then, RPMI-1640-supplemented were added to clean the filter. The cell suspension was centrifuged at 400xg for 5 min. Splenocytes were plated in 96-well plate and treated with LPS 1 µg/mL for 18 h in presence or absence of recombinant LAV-BPIFB4 (18ng/mL). Further, supernatants were collected for TNFSF14 secretion dosage.
Enzyme-linked immunosorbent assay (ELISA)TNFSF14 level was determined using Mouse Tumor Necrosis Factor Ligand Superfamily, Member 14 (TNFSF14) ELISA kit (antibodies; Cat. No. A5014) following the manufacturer’s protocol. Briefly, supernatants were incubated for 2 h at 37 °C in the assay coated microplate. After removing any unbound substances, Reagent A was added to the wells and incubated for 1 h at 37 °C. After washing, Reagent B was added to the wells and incubated for 1 h at 37 °C. Following several washing steps, substrate solution was added, and the consequent color development was stopped. Optical density was measured at 450 nm.
RNA extraction and quantitative real-time analysisRNA was extracted with RNeasy (Qiagen, Germantown, USA), following the protocol provided by the manufacturer. Total RNA concentration and quality were determined using a Nanodrop spectrophotometer (Nanodrop 1000, Thermo Fisher Scientific). Before retro-transcription, DNAse I (Thermo Fisher Scientific) was used to remove genomic DNA contamination. Subsequently, Superscript III, Oligo(dT)12–18, dNTPs mix, and RNaseOUT (Thermo Fisher Scientific) were used to synthesize cDNA, following the manufacturer’s protocol. QuantStudio™ 6 Flex Real-Time PCR System (Applied Biosystems) and SYBR Green PCR Master Mix (Applied Biosystems, Life Technology) were employed to conduct Real-Time-qPCR analyses, on triplicate samples of retrotranscribed cDNA. Expression levels were normalized to 18 S. Data were expressed as 2-(ΔΔCt). Primer sequences are the following:
BPIFB4-F: GTGGGTGTCTACCTGAGCTTGT
BPIFB4-R: GCTCAATGACCAGCCGAGGATA
18S-F: CTCATGGAGGTGCTGGTG
BPIFB4-F: GTGGGTGTCTACCTGAGCTTGT
Western blottingCells were lysed in RIPA buffer containing protease and phosphatase inhibitor cocktail (Sigma-Aldrich). Protein concentration was determined using the Bradford assay (Sigma-Aldrich). Total proteins were separated by electrophoresis using 4–12% NuPAGE Bis-Tris protein gels (Thermo Fisher Scientific), transferred onto a polyvinylidene difluoride (PVDF) membrane (GE Healthcare, Buckinghamshire, UK), and probed overnight at 4 °C with the following primary antibodies: anti-BPIFB4 (dilution 1:1000, Clinsciences, Guidonia Montecelio, Italy, custom made), anti-H3 (dilution 1:1000, Abcam, Cambridge, UK), anti H3k9ac (dilution 1:1000, Millipore, Darmstadt, Germany), anti-Vinculin (dilution 1:5000, Cell Signaling Technology, Massachusetts, United States) and anti-GAPDH (dilution 1:5000, Cell Signaling Technology). Secondary IgG HP-conjugated anti-rabbit HRP-linked antibody (dilution 1:3000, Cell Signaling Technology) was applied for 1 h at room temperature. Blots were revealed by Western Chemiluminescent Substrate Westar Ultra 2 (Cyanagen, Bologna, Italy) using UVITEC Alliance Q9 (UVITEC, Cambridge, UK). Densitometric quantifications were normalized relative to housekeeping signal using UVITEC software.
IBD biopsies cultured in vitroTissue samples from IBD patients were collected (N = 6). The study was approved by the Local Ethics Committee (Comitato Etico Campania Sud protocol prot./SCCE n.11,174 21/01/2019). Informed consent was obtained from subjects, in accordance with the Declaration of Helsinki. Fragments were placed in culture and challenged in presence/absence of the recombinant LAV-BPIFB4 protein and LPS. After 3 h, fragments were harvested, washed and freezed in OCT. Conditioned media were assayed for the release of multiple cito-chemokines that are considered reliable inflammation markers.
Cito-chemokines detectionIL-8, IL-6 and MCP-1 levels in conditioned media of IBD tissues were determined using a beads-based multiplex ELISA (LEGENDplexTM, Biolegend, USA). Medium was incubated for 2 h with the beads and for 1 h with the detection antibodies, followed by 30 min incubation with SA-PE. After washing, beads were resuspended in washing buffer and acquired using a FACS VERSE flow cytometer (BD Biosciences). Data were analyzed with the LEGENDplex Data Analysis Software.
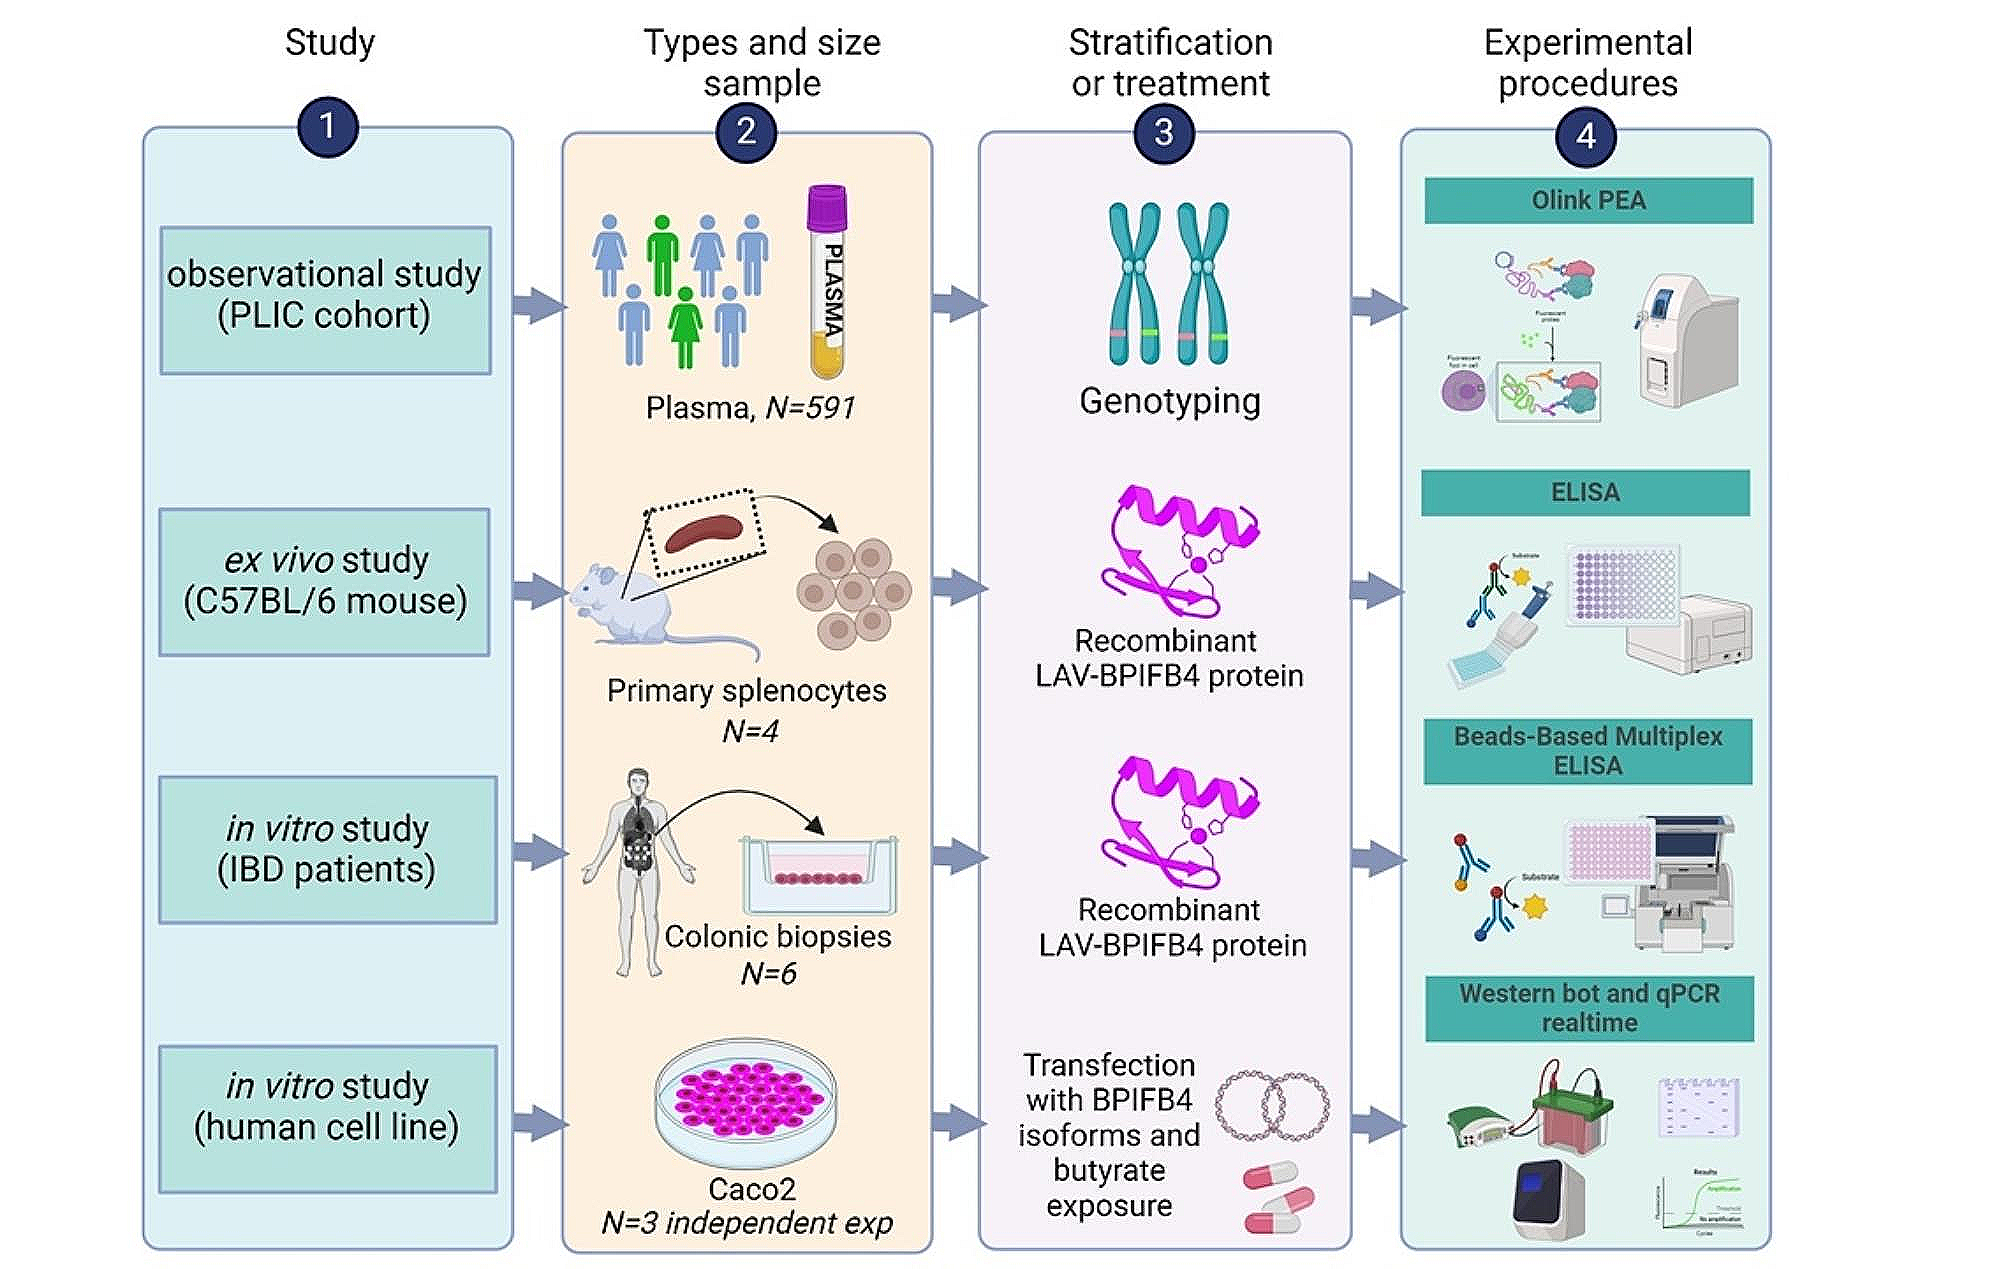
Workflow diagramThe workflow diagram shown in Fig. 1 summarizes the multiple types of study designs.
Fig. 1
Work flow diagram. Workflow diagram summarizing the multiple types of study designs including the specimen type, number of samples, number of replicates, the treatments and the experimental procedures
留言 (0)