Study participants
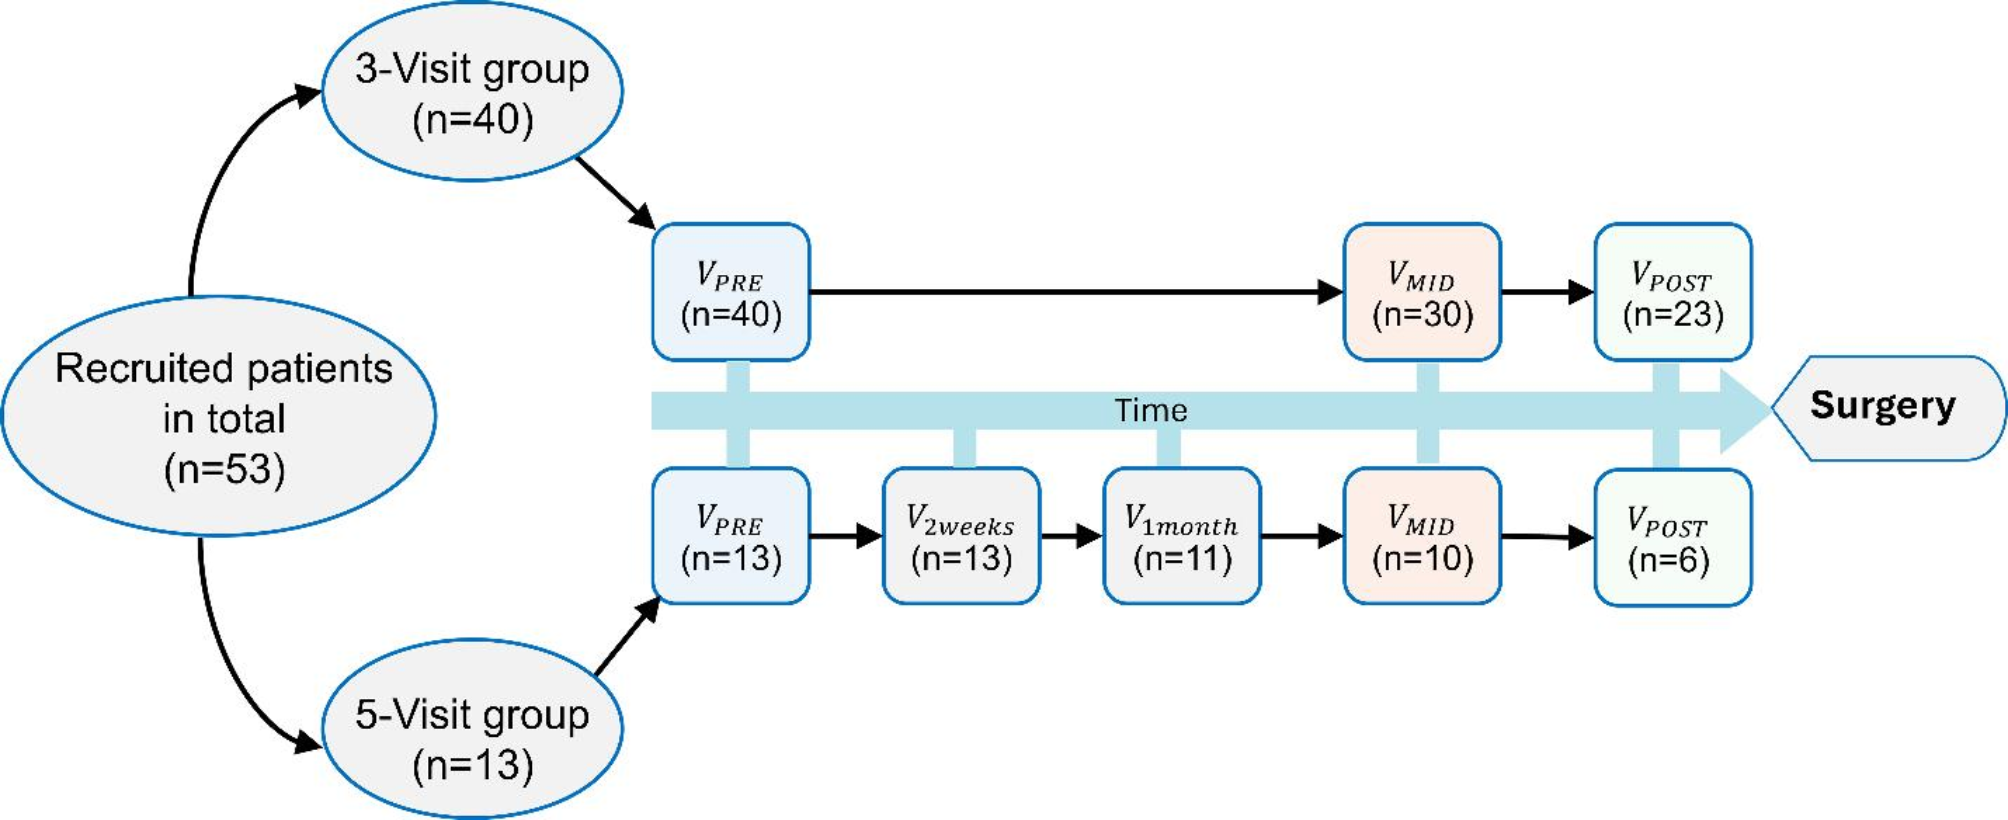
A total of 53 patients with biopsy-proven invasive breast cancer recommended for treatment with neoadjuvant chemotherapy (excluding neoadjuvant endocrine therapy) were recruited for this study. The exclusion criteria involved having breast implants or prior mastectomy. The study was Institutional Review Board (IRB) approved and was compliant with the Health Insurance Portability and Accountability Act (HIPAA). All patients signed an informed consent form prior to their first data acquisition session.
Data acquisition
This was a prospective study that involved two groups of participants, based on their preference and availability. The first group (containing 40 patients) participated in three data acquisition sessions/visits, that were scheduled before the initiation of NAC (pre-NAC / VPRE), at some point (about eight weeks after the initiation) in the middle of therapy (mid-NAC / VMID), and at the end of therapy (about 24 weeks after NAC initiation) before the surgery (post-NAC / VPOST). The second group (involving 13 patients) participated in five visits, which included the same three time points as the first group and in addition at two weeks after the initiation of NAC (2-week-NAC / V2Weeks) and at one month after the initiation of NAC (one-month-NAC / V1Month).
The ultrasound data acquisition for each participant during each visit was performed by one of our four experienced sonographers. A linear array transducer L3-12 H (typical frequency range 3–12 MHz) operating at a center frequency of 8.5 MHz attached to an Alpinion E-Cube 12R ultrasound system (Alpinion Medical Systems, Seoul, South Korea) was used to acquire ultrasound in-phase and quadrature (IQ) data in the plane wave imaging mode. Time gain compensation (TGC) settings were adjusted, if necessary, by the sonographers to accurately locate the lesions, and a suitable imaging plane was determined to cover the lesion in its entirety, generally in its largest cross-section. The sonographers were only involved in locating the breast lesions in B-mode ultrasound. Data acquisition (using the same machine under consistent acquisition settings) and subsequent data processing steps were performed by the investigating team. Compounded plane wave IQ data frames were acquired for a duration of 3 s at an effective frame rate of ∼600 frames per second. During each acquisition, patients were instructed to pause respiration to limit motion artifacts. The lesion is likely to change shape over the course of the treatment, but the sonographers would locate the lesion at each visit using the initial clock-face position and distance from the nipple, as well as the hyperechoic biopsy clip inside the lesion.
Tumor pathology status
Estrogen receptor (ER), progesterone receptor (PR) and HER2 status were obtained from patients’ pathology reports. Estrogen and progesterone receptor status was considered as positive when > 1% tumor nuclei showed positive nuclear staining. HER2 status was determined by immunohistochemistry (scores of 0, 1+, 2 + and 3+) and fluorescence in-situ hybridization (FISH) was performed to check for HER2 gene application in tumors with equivocal (score 2+) staining.
Microvasculature visualization and quantification
The method for visualization of tumor microvasculature and quantification of its morphological features is what we refer to as qHDMI [20,21,22]. The visualization portion of the process consists of the following steps. We begin by reshaping the stack of IQ data frames into a spatiotemporal (Casorati) matrix. We then apply singular value decomposition (SVD) and spectral filters to remove tissue clutter from the data. A top-hat filter is subsequently used to detect and remove the background noise. Finally, a vessel-enhancing Hessian-based filter is employed to further accentuate the vessel-shaped structures. The denoising and vessel enhancement steps are necessary to ensure isolation of vessel structures from background noise, thereby facilitating morphological analysis of the vessels. The next step involves a manual segmentation of the lesion. Then the boundaries of the segmented lesion are dilated omnidirectionally by 2 mm. This is done to ensure inclusion of the peripheral vasculature. The 2 mm dilation is empirically selected, as the majority of the peritumoral vasculature in our data is generally observed within this range. The resulting dilated segmentation is then used as a mask to isolate the lesion and its periphery. The quantification portion of the process begins by binarizing the masked microvasculature image, followed by morphological hole-filling, opening and closing to remove noise-like structures. Subsequently, skeletonization and cleaning (spur and isolated pixels) prepare the image for morphological quantification. Through this process, 12 features/biomarkers are extracted for each image. These biomarkers include vessel density (\(\:VD\)), number of vessel segments (\(\:NV\)), number of branch points (\(\:NB\)), mean tortuosity as measured by the distance metric (\(\:_\)), maximum tortuosity as measured by the distance metric (\(\:_\)), mean vessel diameter (\(\:_\)), maximum vessel diameter (\(\:_\)), fractal dimension (\(\:FD\)), mean of Murray’s deviation (\(\:_\)), maximum of Murray’s deviation (\(\:_\)), mean of bifurcation angle (\(\:_\)), and maximum of bifurcation angle (\(\:_\)). The computation details for each of these biomarkers can be found in [21] and [19], as well as the included supplementary material. All the data processing and image processing were performed in MATLAB R2019a (Mathworks Inc., Natick, MA, USA). Microvasculature image visualization and vessel quantification in the qHDMI framework are objective processes and do not necessitate subjective interventions.
pCR label generation
Each participant was labeled as either responder or non-responder based on their residual cancer burden from the surgical pathology results [32]. The pathologists were blinded to the data and image processing and the data acquisition and processing team were blinded to the pathology. The evaluation of pCR was conducted via the residual cancer burden (RCB) metric defined as: RCB = 1.4 ×(finv × dprim)0.17 + [4 × (1- (0.75)LN) × dmet] 0.17, where \(\:_\) indicates the proportional area containing invasive carcinoma, \(\:_\) is a measure of the remaining primary tumor, \(\:LN\) is the number of lymph nodes involved in metastasis, and \(\:_\) is the diameter of the largest metastatic lymph node. Four categories are considered for RCB: RCB-0 (\(\:\text\text\text\) = 0), RCB-I (0 < \(\:\text\text\text\) <= 1.36), RCB-II (1.36 < \(\:\text\text\text\) <= 3.28), and RCB-III (\(\:\text\text\text\) > 3.28). The RCB thresholds are statistically determined to provide prognosis-based separation of classes with no residual disease (RD), minimal RD, moderate RD, and extensive RD [32]. In this study, RCB-0 and RCB-I cases were labeled as responder, while RCB-II and RCB-III cases were labeled as non-responder [33].
Statistical analysis
The values of the qHDMI biomarkers for the responder and non-responder groups were computed for each visit. A two-sided Wilcoxon rank-sum test was performed to compare the distributions of the biomarkers at each visit. Biomarker trajectories over time were analyzed using linear mixed effects models to account for intra-individual correlation, modeling the effects of responder status for individual biomarkers treating time as a continuously valued predictor and thus assuming a linear function of time. Random intercepts were applied and differences in trajectories by responder status were tested by including a time interaction with responder status, resulting in the model form \(\:_=_+__+__+\beta\:}___+_+ϵ}_\) where \(\:_\) represents the biomarker value at timepoint \(\:_\) for participant \(\:i\), \(\:_\) is the binary responder status for participant \(\:i\), \(\:_\) is the random intercept effect, and \(\:_\) is the residual error. Model assumptions, such as variance homogeneity and linearity, were assessed and potential transformations of the biomarker values were considered, as appropriate. In all cases, a p-value<0.05 was considered statistically significant. All statistical analyses were performed in R version 4.4.1 (R Core Team, Vienna, Austria) using RStudio (RStudio, PBC, Boston, MA).
Sample size
This study was designed with the expectation of a 70% chemotherapy response rate among the target patient population. Targeting 80% power to identify a 1 SD mean difference between qHDMI biomarkers by response status at a given timepoint, a total of 39 patients would be necessary when performing a two-sample Student’s t-test under a two-sided hypothesis and an alpha level of 0.05. No adjustments were made to the alpha level for multiple testing based on high expected correlation among qHDMI biomarkers. To account for potential participant drop-out over time, a 20% sample size inflation factor was considered for total enrollment, resulting in a target sample size of 50 patients. Analyses that leverage repeated longitudinal measures should only have increased statistical power.


留言 (0)