
記住我
A total of 204 children, 214 adolescents and 605 adults from three independent prospective cohorts were included to form the life course cohort at baseline (ESM Table 1). The proportion of male participants ranged from 43.5% to 53.4% among the three age groups, with no statistical difference in the proportion of male participants. The mean ± SD age of the children, adolescents and adults were 7.0 ± 0.5 years, 15.0 ± 1.8 years and 41.5 ± 9.3 years, respectively. Adults (including those who were not overweight or obese) had higher BMI than children and adolescents. Glucose levels were highest in adults and lowest in children at 0 min and 120 min. During the OGTT, we observed a sharp decrease in glucose levels in children between 30 min and 120 min (ESM Fig. 3). In adolescents and adults, we observed a delay in this decrease, which occurred at 60 min. Adolescents had the highest insulin levels during the whole OGTT period, compared with the other two age groups (ESM Fig. 3). At baseline, the proportion of individuals with AGT (not including diabetes) was highest in adults, followed by adolescents and then children, with the proportion being 22.0%, 15.9% and 3.4% respectively (ESM Table 1).
Insulin sensitivity and secretion over the life courseWhen analysed as a life course cohort, there was a curvilinear relationship between insulin sensitivity and insulin secretion during the three phases of the OGTT, with individuals at the extremes of the curvilinear line being prone to metabolic decompensation due to small changes in either of the indices relating to insulin sensitivity or insulin secretion (Fig. 1). The data points for adults (with insulin sensitivity plotted on the x axis and insulin secretion on the y axis) were clustered around the middle of the curvilinear line, while those for adolescents and children were clustered at the upper and lower ends respectively. When comparing the median values of these indices across the age stages of the life course, adolescents had the highest insulin secretion but the lowest insulin sensitivity, as compared with children and adults for all three phases of the OGTT (ESM Table 2; p<0.001), even when stratifying for those with normal glucose tolerance (NGT) and/or BMI not in the overweight/obese range (ESM Table 3).
Fig. 1
Insulin sensitivity (x axis) and secretion indices (y axis) over the life course (in children, adolescents and adults) during the fasting, early and late phase of the OGTTs. (a) Fasting phase insulin sensitivity–insulin secretion indices, presented by HOMA2-%S and HOMA2-%B, respectively. (b) Early-phase insulin sensitivity–insulin secretion indices, presented by 1/HISI and the Stumvoll index-1, respectively. (c) Late phase insulin sensitivity–insulin secretion indices, presented by the Matsuda index and Stumvoll index-2, respectively. The fitted curvilinear line of insulin sensitivity and insulin secretion (black dotted lines) and the 95% CI of the curvilinear line (grey-shaded area) are also shown on each graph
When comparing among the three OGTT phases, the coordinates for all three age groups were distributed relatively centrally around the curvilinear line in the fasting phase, with a few outlying data points mainly for adolescents (Fig. 1). In both the early and late phases, the coordinates were observed to exhibit greater dispersions in the insulin sensitivity direction than those in the fasting phase, with more data points at the two extreme ends. High secretion dispersions were mainly found in adolescents at the higher extreme ends and low secretion dispersions were mainly found in adults at the lower extreme ends. When limited to participants with NGT and/or without overweight/obesity, we observed a reduction in the number of outlying points, but the dispersion patterns in the three life course stages remained consistent with the results above (ESM Fig. 4).
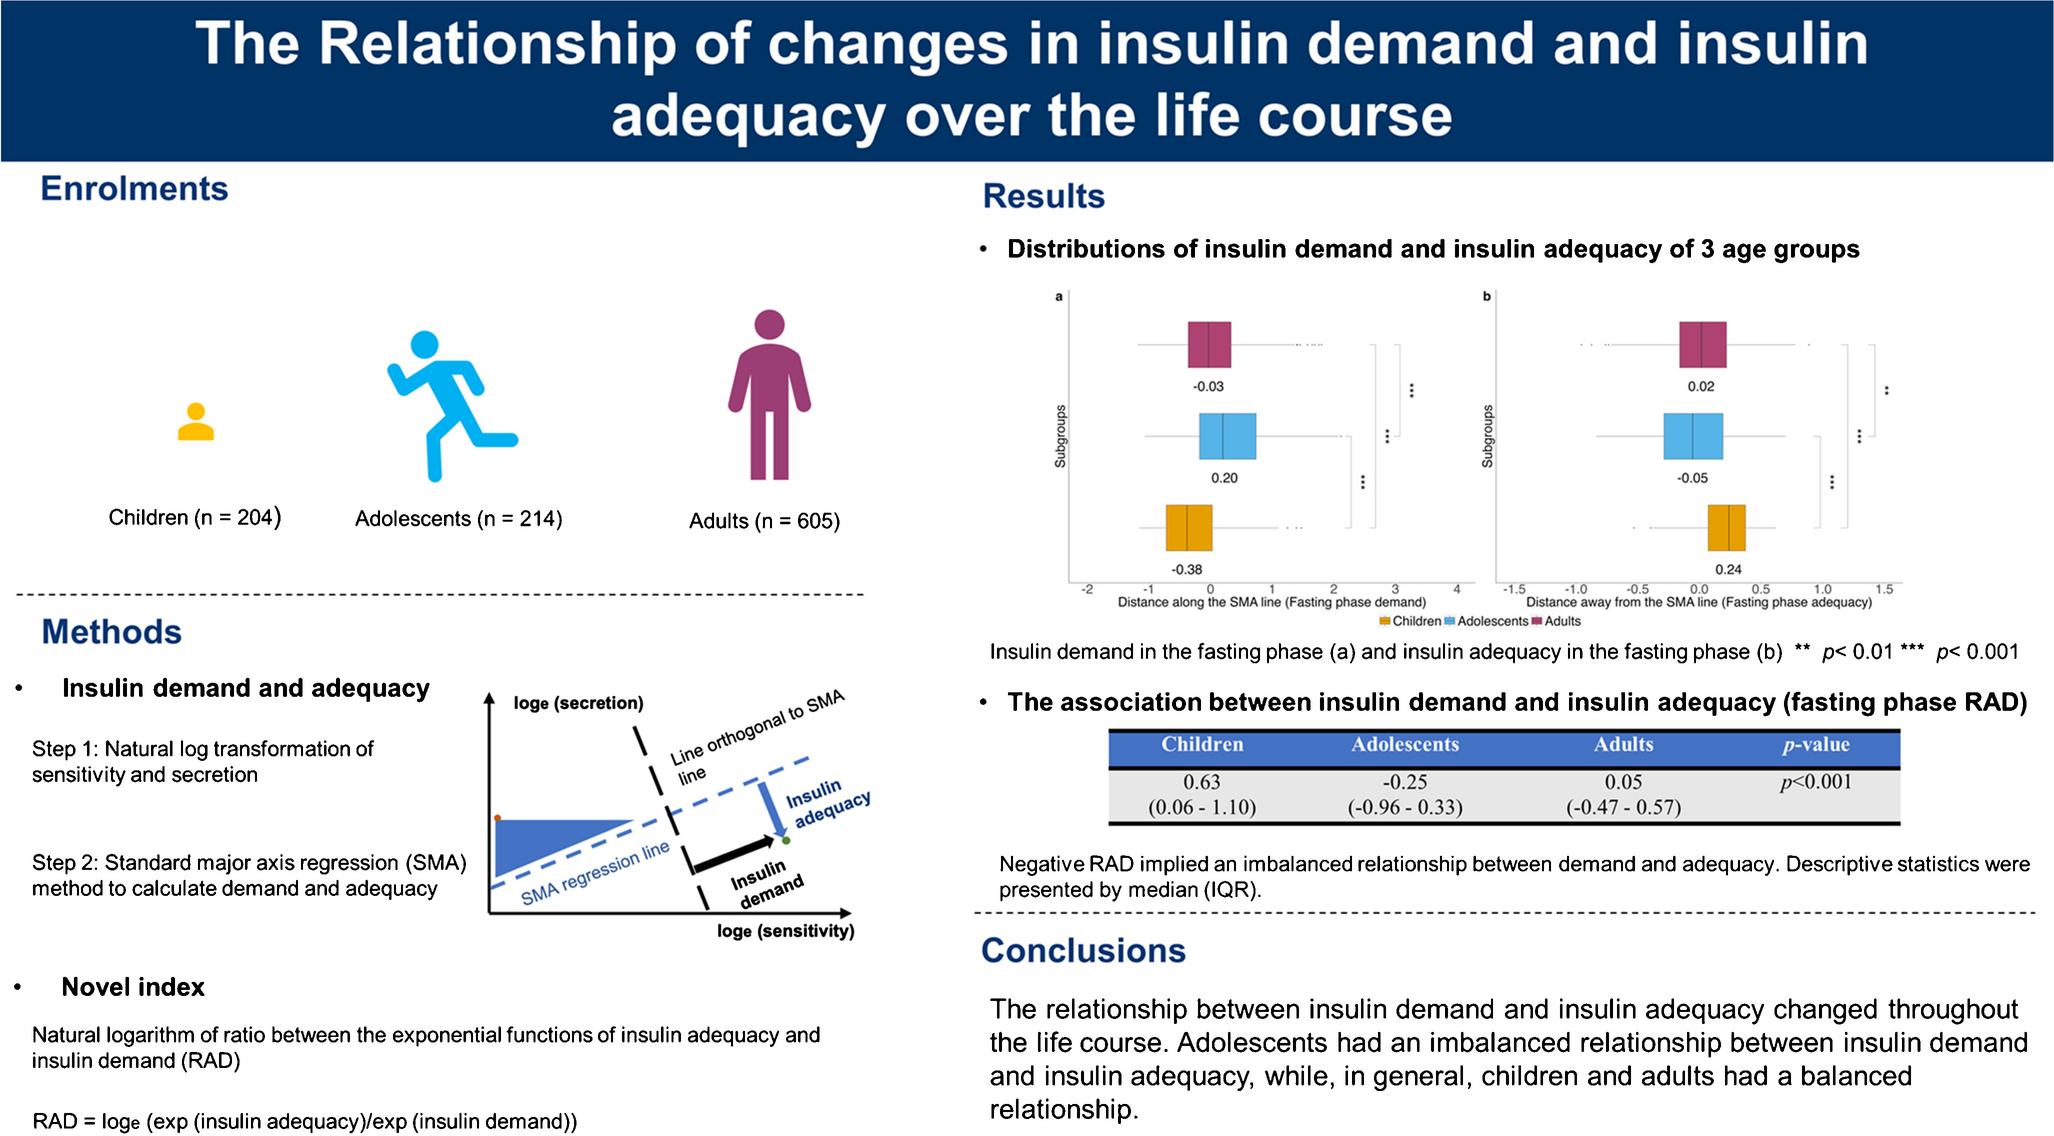
Insulin demand and insulin adequacy over the life courseWe applied the SMA regression method to evaluate the relationship between insulin demand (distance along the SMA regression line) and insulin adequacy (distance away from the SMA regression line) (ESM Fig. 2). In all phases of the OGTT, adolescents had the highest insulin demand, followed by adults and then children (Fig. 2; p<0.001 for all age group comparisons in all OGTT stages). For insulin adequacy, adolescents had the lowest value in the fasting phase of the OGTT (p<0.01), while adults had the lowest values in both early and late phases, with statistical significance only in the late phase (p<0.001). In general, these trends remained consistent in participants with NGT and/or without overweight/obesity (ESM Fig. 5).
Fig. 2
Insulin demand and insulin adequacy over the life course (in children, adolescents and adults). (a–f) Insulin demand (a, c, e) and insulin adequacy (b, d, f) were derived from insulin sensitivity and insulin secretion indices in the fasting (a, b), early (c, d) and late (e, f) phase of the OGTT using the SMA regression method. Insulin sensitivity in the fasting phase, early phase and late phase of the OGTT was represented by HOMA2-%S, 1/HISI and the Matsuda index, respectively. Insulin secretion in the fasting phase, early phase and late phase of the OGTT was represented by HOMA2-%B, the Stumvoll index-1 and the Stumvoll index-2, respectively. The middle lines in the box plots show the median values for each age group, while the upper lines and lower lines show the first quartiles (Q1) and the third quartiles (Q3), respectively. Lower outliers indicate values less than Q1−(1.5×IQR) and higher outliers indicate values greater than Q3+(1.5×IQR). **p<0.01, ***p<0.001
The novel RAD index was used for further investigations of the relationship between insulin demand and insulin adequacy. Adolescents had the lowest RAD values in all three phases, compared with children and adults (Table 1), and these were all negative, indicating an imbalanced insulin demand–adequacy relationship. This trend was consistent even in adolescents without AGT and/or overweight/obesity (ESM Table 4). In children and adults, the insulin demand was generally balanced by the insulin adequacy response, as indicated by positive RAD values (Table 1). Although a slightly negative RAD value was observed in adults in the late phase of the OGTT (Table 1), RAD values were all positive when stratified by NGT and/or non-obese/non-overweight participants (ESM Table 4; p<0.001 between age groups in each of the fasting, early and late phases of the OGTT).
Table 1 RAD values of the life course cohort during three phases of the OGTT Risk of AGT and diabetes assessed using the insulin demand–adequacy method and RAD methodAmong 204 children, 115 children had both baseline and follow-up records for glucose tolerance. Among these children, 87 children had NGT, 19 children had i-IFG, five children had i-IGT, four children had IFG+IGT and no children had diabetes at follow-up. In the adult group, 359 of 605 individuals had glucose tolerance records at both baseline and follow-up. Of these adults, 214 adults had NGT, 25 adults had i-IFG, 37 adults had i-IGT, 14 adults had IFG+IGT and 69 adults had diabetes at follow-up. The adolescent group only had fasting plasma glucose data at follow-up, which was not sufficient for defining glycaemic status and, hence, this group was excluded from the analyses of prospective evaluation of glucose tolerance. We compared the baseline characteristics of children and adults with and without follow-up glucose tolerance records and, for the majority of variables, there was no statistically significant difference (ESM Table 5).
We evaluated the risk of AGT (i-IGT, i-IFG, IFG+IGT and diabetes) using both the insulin demand–adequacy method and the RAD method based on follow-up glucose tolerance records. For the insulin demand–adequacy method, we stratified all participants into four groups based on the median values of insulin demand and insulin adequacy at baseline: low demand–high adequacy (LD–HA), high demand–high adequacy (HD–HA), high demand–low adequacy (HD–LA) and low demand–low adequacy (LD–LA). The insulin demand–adequacy distributions of participants are shown in ESM Fig. 6a–c for children and adults. We considered the HD–LA group as the at-risk group, due to having the highest insulin demand but lowest insulin adequacy, and combined the LD–HA, HD–HA, and LD–LA groups as the reference group (Table 2). To keep the sample size of participants in the at-risk group relatively consistent with the insulin demand–adequacy method, we considered participants with RAD values below the 25th percentile as the at-risk group when using the RAD method, and regarded those above the 25th percentile as the reference group (Table 2). The findings showed that the HD–LA group had a higher risk of AGT compared with the reference group when assessed using the insulin demand–adequacy method, with statistical significance only in the fasting and late phase of the OGTT (fasting-phase OR=1.55 [95% CI 1.04, 2.30]; early-phase OR=1.35 [95% CI 0.88, 2.04]; late-phase OR=2.62 [95% CI 1.72, 4.02]). Accordingly, using the RAD method, participants with RAD values below the 25th percentile had a higher risk of AGT compared with those with RAD values above the 25th percentile, with statistical significance in all three phases of the OGTT (fasting-phase OR=1.86 [95% CI 1.18, 2.91]; early-phase OR=1.99 [95% CI 1.24, 3.19]; late-phase OR=2.49 [95% CI 1.57, 3.97]). The base model to evaluate the risk of AGT was adjusted for age and sex, with an AUC-ROC value of 0.578.
Table 2 Performance of the insulin demand–adequacy method and the RAD method in evaluating the risk of AGTWe used the insulin demand–adequacy method and the RAD method models to evaluate the risk of AGT in the three OGTT phases. We observed the highest AUC-ROC, NRI and IDI values in the late phase of the OGTT, compared with the fasting phase and the early phase, using both methods (Table 2). When comparing between the two methods, the RAD method was more stable and efficient than the insulin demand–adequacy method as the NRI and IDI values were all significant in the three OGTT phases, while the NRI and IDI values derived using the insulin demand–adequacy method were non-significant in the early phase of the OGTT (Table 2). We built a glycaemic trajectory by selecting adult participants with NGT at baseline and then comparing the baseline RAD values according to glycaemic status at the follow-up visit. The NGT at baseline–NGT at follow-up group had higher RAD values than the NGT at baseline–AGT at follow-up group in all three phases of the OGTT, with differences between groups being statistically significant in the early phase and late phase of the OGTT (ESM Table 6), which was in accordance with the RAD results above.
For sensitivity analyses, we used both the insulin demand–adequacy method and the RAD method to evaluate the risk of diabetes in adults (only the adult group had adequate numbers of incident diabetes diagnoses at follow-up). The insulin demand–adequacy distributions for adults are shown in ESM Fig. 6d–f. Both the HD–LA group and the group with RAD values below the 25th percentile had a higher risk of diabetes compared with their respective reference groups when using the insulin demand–adequacy method and the RAD method, respectively (ESM Table 7). The base model to evaluate the risk of diabetes was adjusted for age and sex, with an AUC-ROC value of 0.541. Consistent with our findings for AGT risk, both the insulin demand–adequacy method and the RAD method performed best for evaluating the risk of diabetes in the late phase of the OGTT, as compared with the other two OGTT phases, and the RAD method was more stable and efficient than the insulin demand–adequacy method (ESM Table 7).
留言 (0)