
記住我

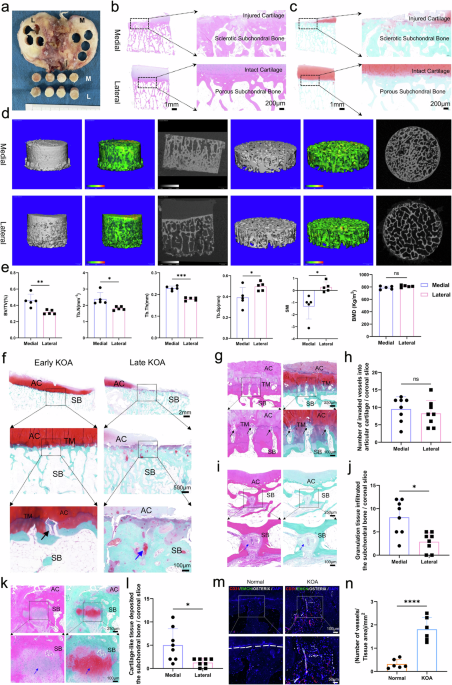

By following the instructions from the OARSI and ICRS,22 tibial plateau samples were collected from patients with primary KOA who underwent knee replacement surgery (Supplementary Table 1, Supplementary Fig. 1). Cylindrical specimens with a diameter of 8 mm were drilled from both the medial and lateral tibial plateaus (Fig. 1a). For KOA patients with varus deformity, H&E (Fig. 1b) and SO&FG (Fig. 1c) staining showed more severe progression of KOA in the medial tissue of the tibial plateau compared with the lateral side. The lateral cartilage tissue showed less damage and even distribution of trabeculae. In contrast, the medial cartilage tissue wore away, and there was a noticeable and regional subchondral bone hyperplasia and sclerosis. Micro-CT examination further proved that the trabecular bone in the medial tibial plateaus of the KOA patients was significantly denser compared with the lateral side (Fig. 1d). Additionally, compared to the subchondral bone microstructure of the lateral tibial plateau, the medial trabeculae have a significantly greater BV/TV (p = 0.006), number (p = 0.020) and thickness (p = 0.0001), and lower separation (p = 0.026) and SMI (p = 0.021), but reduced bone mineral density (MD = −23.90 Kg/m2, p = 0.232) (Fig. 1e). This suggests that in KOA, the more severe subchondral bone sclerosis remodeling of the medial tibial plateau is accompanied by insufficient bone mineralization.
Fig. 1
Pathological remodeling of subchondral bone in patients with KOA. a Tissue samples were isolated from tibial plateaus with KOA. b, c Representative sagittal micrographs of H&E (b) and SO&FG (c) staining for the samples of tibial plateaus with KOA, injured cartilage and subchondral bone lesions were marked. Scale bars = 1 mm, 200 μm. d Micro-CT measurement and heatmap of Tb.Th for the samples of tibial plateaus with the KOA. The color scale changes from green to red. The darker the color, the greater the Tb.Th. e Quantitative analysis of BV/TV, BMD, Tb.N, Tb.Th, Tb.Sp and SMI (n = 5 per group). The BMD of trabeculae on the medial tibial plateau is significantly lower than that on the lateral side. And the parameters measured in the lateral side appeared to be more concentrated compared with the medial side. f Representative sagittal micrographs of pathological alterations of tibial plateaus at early and late stage of KOA. Articular cartilage (AC), tidemark (TM), and subchondral bone (SB) are marked. Scale bars = 2 mm, 500 μm, 100 μm. g Representative micrographs of vascular invasion from the subchondral bone into articular cartilage. Scale bars = 250 μm, 100 μm. Black arrow indicates the vascular invasion into cartilage. h Quantitative analysis of invaded vessels crossing tidemarks in the medial and lateral tibial plateaus (n = 8 per group). i Representative micrographs of vascular rich granulation tissue infiltrated the subchondral bone with KOA. Scale bars = 250 μm, 100 μm. Scale bars = 100 μm, 50 μm. Blue arrow suggests the granulation tissue deposited in subchondral bone. j Quantitative analysis of the number of infiltrated granulation tissue in the medial and lateral subchondral bone (n = 8 per group). k Representative micrographs of cartilage-like tissue, positively stained with safranin O, deposited in the subchondral bone with KOA. Scale bars = 250 μm, 100 μm. Blue arrow suggests the cartilage-like tissue deposited in subchondral bone. l Quantitative analysis of the number of deposited cartilage-like tissue in the medial and lateral subchondral bone (n = 8 per group). m Representative micrographs of type H vessels (CD31hiEMCNhi) immune-positively stained with CD31 and EMCN in subchondral bone with KOA. White arrow indicates the type H vessels grown in subchondral bone with KOA. The white dashed line marked the boundary of the subchondral bone in the normal tibial plateau, while that was disrupted and unclear in the KOA group. n Quantitative analysis of the density of vessels in the normal and osteoarthritic tibial plateaus (n = 8 per group). Data are shown as mean ± SD. P-values were determined by paired, two-tailed t-test for (e, h, j, l) and unpaired, two-tailed t-test for (n)
Further histological analysis revealed that, in the early stages of KOA, vessels invaded the articular cartilage, and in the later stages, cartilage-like tissue was deposited within the subchondral trabeculae (Fig. 1f). Vascular invasion was accompanied by the destruction of tidemark, thickening of calcified cartilage, and degeneration of hyaline cartilage (Fig. 1g). And the number of vessels invaded into cartilage was not significantly different between medial and lateral tibial plateaus (Fig. 1h). The infiltration of vascular-rich granulation tissue within the trabecular bone (Fig. 1i) along with the deposition of cartilage-like tissue positive for safranin O (Fig. 1k), are important pathological features of subchondral bone remodeling. These phenomena were markedly more prevalent and pronounced in the medial tibial plateaus of individuals with KOA, where the pathological alterations were considerably more severe compared to the lateral side (Fig. 1j, l). Type H vessels, a newly identified subtype of bone vasculature characterized by endothelial cells with high expression of CD31 and EMCN, have been found to be closely associated with osteogenesis.23 Through multiple immunofluorescence staining using CD31 and EMCN antibodies, it has been confirmed that Type H vessels are indeed present in the subchondral bone of individuals with KOA (Fig. 1m). Furthermore, the density of these vessels within a given area was significantly higher in the KOA group compared to the normal control group (Fig. 1n). Consequently, it can be inferred that the increased angiogenesis, deposited cartilage-like tissue and the activated bone remodeling processes are markedly joining and promoting the development of KOA disease.
Postmenopausal KOA model is successfully constructed in bipedal miceThe mouse grouping and experimental setup are shown in Fig. 2a. This study included a total of six groups of mice: MN (male normal mice), MB (male bipedal mice), FN (female normal mice), FB (female bipedal mice), FO (female mice with bilateral ovariectomy), and FBO (female bipedal mice with bilateral ovariectomy). The forelimbs and tails of C57 mice at 3 weeks of age were amputated, with half of the female mice undergoing bilateral ovariectomy at 10 weeks of age. The KOA phenotype was assessed monthly from 10 to 22 weeks of age.
Fig. 2
Postmenopausal KOA model was successfully constructed in bipedal mice. a A schematic of mice experimental design. This study has included six groups of mice: MN (male normal mice), MB (male bipedal mice), FN (female normal mice), FB (female bipedal mice), FO (female mice with bilateral ovariectomy), and FBO (female bipedal mice with bilateral ovariectomy). The forelimbs and tail of 3-week-old C57 mice were cut off in a sterile environment, and exercise for the bipedal activities was performed on a treadmill with a slow speed. Half of female mice were bilaterally ovariectomized at 10 weeks of age. The phenotype of KOA was evaluated monthly from 10 to 22 weeks of age. b Representative micrographs of H&E and SO&FG staining in sagittal sections of the medial sides of knee joints of experimental mice at 10, 14, 18, and 22 weeks of age. Articular cartilage (AC), calcified cartilage (CC), subchondral bone (SB) and meniscus (ME) are marked. Scale bar = 200 μm. c Measurement and quantitative analysis of femoral cartilage thickness (n = 5 per group). d The Osteoarthritis Research Society International score for different animal models (n = 5 per group). e, f Representative micrographs of immunohistochemical staining of Collagen II (e) and Aggrecan (f) in sagittal sections of the medial sides of the knee joints in the six groups at 22 weeks of age, Scale bar = 200 μm. g, h Semi-quantitative analysis of immune-positive percentage of Collagen II (g) and Aggrecan (h) (n = 5 per group). i Representative TEM images of the chondrocytes in cartilage tissues of knees at 22 weeks of age, Scale bars = 2 μm, 500 nm. Red, orange, cyan and blue arrows indicated the mitochondrial, rough endoplasmic reticulum, perinuclear space, and cell protrusions, respectively. Data are shown as mean ± SD. P-values were determined by one-way ANOVA with a Tukey post hoc test for (c, d, g, h)
Compared to the other five groups of mice at the ages of 10, 14, and 18 weeks, H&E and SO&FG staining revealed that, in the FBO group, the degenerative changes in articular cartilage had progressively worsened, with cartilage tissue being eroded and deformed by the age of 22 weeks (Fig. 2b). The thickness of femoral cartilage was significantly decreased (Fig. 2c), and the OARSI score was significantly increased (Fig. 2d). The loss of main components of the extracellular matrix (ECM) of chondrocytes in the FBO group mice, including collagen II (Fig. 2e, g) and aggrecan (Fig. 2f, h), was most pronounced at 22 weeks of age. Furthermore, transmission electron microscopy (TEM) observation of cartilage tissue in the FBO group showed damaged chondrocytes with swollen mitochondria, expanded rough endoplasmic reticulum, and widened perinuclear space (Fig. 2i).
There were significant differences in gait between the bipedal mice and normal mice (Fig. 3a), despite the bipedal mice being able to move freely within their cages. Compared with normal mice, the bipedal mice exhibited markedly shortened stride length (Fig. 3b), slower walking speed (Fig. 3c), longer touchdown time (Fig. 3d), but similar walking cycle (Fig. 3e) and gait asymmetry index (Fig. 3f). The imaging examination revealed an obvious decrease in bone strength in the hindlimbs of FBO mice, along with narrowing of the knee joint space, an increased presence of osteophytes, and varus deformity when compared to FN mice (Fig. 3g). In addition, subchondral bone damage with decreased BV/TV, BMD, and Tb.Th, and increased Tb.Sp was found in the FBO mice compared to FN mice (Fig. 3h–k). Taken together, the above findings suggested that the KOA phenotypes were most pronounced in FBO mice at 22 weeks of age.
Fig. 3
Gait analysis and micro-CT measurement of KOA mice. a Results of gait analysis of mice at 22 weeks of age, including the original footprint and heatmap of footprint pressure. b Quantitative analysis of stride length (n = 5 per group). c Quantitative analysis of walking speed (n = 5 per group). d Quantitative analysis of touchdown time (n = 5 per group). e Quantitative analysis of walking cycle (n = 5 per group). f Quantitative analysis of gait asymmetry index (n = 5 per group). g Representative images of bone strength heatmap and micro-CT images for the 3-dimensional (3D) reconstruction of knee joints at 22 weeks of age. Scale bar = 200 μm. h Quantitative analysis of BV/TV (n = 5 per group). i Quantitative analysis of BMD (n = 5 per group). j Quantitative analysis of Tb.Th (n = 5 per group). k Quantitative analysis of Tb.Sp (n = 5 per group). Data are shown as mean ± SD. P-values were determined by one-way ANOVA with a Tukey post hoc test for (b–f and h–k)
Pathological remodeling of subchondral bone in KOA miceThe BMD and body composition (bone mineral content, fat mass, and lean mass) of the mice in six groups were assessed using the InAlyzer (Fig. 4a). From the age of 14 to 22 weeks, the weight of the bipedal mice was significantly less than that of the normal mice. When they grew to 18 and 22 weeks of age, the weight of the FO mice increased a lot and was significantly higher than that of the FN mice. Furthermore, the weight of the FBO mice increased much more than that of FB mice (Fig. 4b). In addition, the percentage of fat of FO and FBO mice at 22 weeks of age was significantly increased than that of the FN mice (Fig. 4c, d), but the BMD of FO and FBO mice was significantly lower (Fig. 4c, e). The damage to the subchondral bone microstructure of FBO mice was the most pronounced among the six groups (Fig. 4c). The BMD of the knee joint of MN mice was the highest among all groups, and it was significantly lower in FO and FBO mice than that of FN mice (Fig. 4f). That is, compared with normal mice, model mice exhibited a higher proportion of fat deposition surrounding the knee joint and a lower proportion of lean tissue.
Fig. 4
Pathological remodeling of the subchondral bone in the KOA mice. a The BMD and body composition (bone mineral content, fat mass, and lean mass) of the mice were measured by Inalyzer (left), and the corresponding X-ray photograph of mice (right). Red box indicated the selected region of interest of knee joints for analysis. Scale bar = 20 mm. b Changing trend and quantitative analysis of weights of mice in six groups from 14 to 22 weeks of age (n = 5 per group). c Representative images of body composition heatmap and microstructure of trabecular bone of mice in six groups at 22 weeks of age. The bone is white, fat is red, blue & green are mixed lean and liquid. Scale bar = 500 μm. d, e Quantitative analysis of percentage of fat (d) and BMD (e) of mice in six groups at 22 weeks of age (n = 5 per group). f Quantitative analysis of the BMD of the knee joints of mice in six groups at 22 weeks of age (n = 5 per group). g, h Representative sagittal micrographs of TRAP staining (g) and related semi-quantitative analysis (h) in subchondral bone of femoral condyles (FC) and tibial plateaus (TP) of mice in the six groups at 22 weeks of age (n = 5 per group). Scale bar = 50 μm. Black arrows indicated the TRAP+ osteoclasts. i, j Representative sagittal micrographs of IHC staining of osteocalcin (i) and related semi-quantitative analysis (j) in subchondral bone of mice in the six groups at 22 weeks of age (n = 5 per group). Scale bar = 50 μm. Black arrows indicated the TRAP+ osteoclasts or osteocalcin+ osteoblasts. k Representative TEM images of osteoblasts in subchondral bone of femoral condyles of mice in the six groups at 22 weeks of age. Scale bars = 2 μm, 500 nm. Red, orange and blue arrows indicated the mitochondrial, rough endoplasmic reticulum, and cell protrusions, respectively. l Representative sagittal micrographs of SO&FG staining of femoral condyle (FC) of mice in the six groups at 22 weeks of age, indicating the cartilage degeneration and pathological remodeling of subchondral bones. Articular cartilage (AC), subchondral bone (SB) and bone marrow cavity (BM) were marked. Scale bar = 50 μm. Black arrow indicated the cartilage-like tissue deposited in the subchondral bone. Data are shown as mean ± SD. P-values were determined by one-way ANOVA with a Tukey post hoc test for (b, d, e, f, h, and j)
Specifically, the quantity of TRAP+ osteoclasts showed a significant increase in the subchondral bone of FB, FO, and FBO mice (Fig. 4g, h). Additionally, the number of osteocalcin+ osteoblasts significantly increased in the subchondral bone of FB and FBO mice (Fig. 4i, j). These findings suggest that both subchondral bone resorption and formation were notably activated in FBO mice. Furthermore, observation of osteoblasts in the femoral condyle using TEM showed swollen mitochondria of osteoblasts in MB, FB, and FBO mice, and expanded rough endoplasmic reticulum of osteoblasts in FBO mice, potentially impacting protein synthesis (Fig. 4k). Notably, histological changes similar to the pathological remodeling of subchondral bone in KOA patients were also observed in FB and FBO mice, such as vascular invasion and cartilage-like tissue deposition (Fig. 4l).
Single-cell transcriptional landscape of femoral condyles in KOA miceTo define cell populations and identify genome-wide gene expression patterns in the development of subchondral bone remodeling and cartilage degeneration. Ten femoral condyles from hindlimbs of 5 mice in each group at 22 weeks of age were isolated for scRNA-seq using a modified STRT strategy24 (Fig. 5a). Femoral condyle used for scRNA-seq was isolated manually at the junction connected the femoral shaft and condyle, to eliminate the influence of chondrocytes distributed in the growth plate (Fig. 5b). A total of 82,083 cells were isolated from femoral condyles in mice of six groups, and 65,491 cells were retained for subsequent analysis after rigorous filtration (Supplementary Table 2). That consisted of 26 clusters (Supplementary Fig. 2a), which were identified as 15 cell types (Fig. 5c), including chondrocytes (CC, 16,378), endothelial cells (EC, 553), osteoblast (OB, 2203), progenitor cells (PC, 5461), reticular cells (RC, 2184), B cells (11,463), T cells (2528), monocytes likes (1193), monocyte-macrophages (4404), dendritic cells (1155), erythrocytes (2929), smooth muscle cells (819), granulocyte-1 (10,657), granulocyte-2 (2821), granulocyte-3 (743) (Supplementary Fig. 2b–d). Identity of each cell type was determined based on the expression of previously published specific marker genes (Fig. 5d, e, and Supplementary Fig. 2e). For example, CC was identified for high expression of Sox9, Acan, and Col2a1; EC was defined for high expression of Pecam1, Cldn5, and Cdh5; OB was confirmed for high expression of Alpl, Bglap, Col1a1, and Ibsp; PC was identified for high expression of Cd34, Ly6a, and Thy1; RC was defined for high expression of Adipoq, Cxcl14, and Gdpd2. Additionally, the volcano plots of differentially expressed genes in all cell types across the different groups were shown in Supplementary Figs. 3–8.
Fig. 5
The single-cell landscape of femoral condyles in six groups at 22 weeks of age. a Schematic workflow for transcriptomic profiling of the mice femoral condyles with KOA using scRNA-seq. The scRNA-seq data (one sample per group, six groups) were assayed by following the SeekOne protocol, including 5 pairs of knees in each sample. The CD45+ cells were selected by flow cytometric sorting, and the CD45+ and CD45− cells were mixed in a ratio of 1:1 before the examination. b Process of isolation for femoral condyle from femur for scRNA-seq, and representative images of isolated femoral condyles stained with H&E and SO-FG, Scale bar = 200 μm. c UMAP plot of single cells profiled in the presenting work colored by cell types. A total of 65,491 cells were isolated from six groups of femoral condyles and divided into 15 cell types. d Feature plots showing the expression of key markers in various clusters projected on the UMAP plot. Red indicates high expression and blue indicates low or no expression. e Heatmap revealing the scaled expression of the top 3 discriminative genes in each cell cluster defined in (c), the color scheme is based on z-scores
Enhanced mechanical stress accelerates cartilage degenerationAUCell package was used to score the “response to mechanical stimulus” pathways of CCs and OBs of samples from six groups. In comparison to the FN group, the AUCell scores were significantly higher in the FB and FBO groups, and significantly lower in the FO group (Fig. 6a, b). The changes in expression levels of Piezo1, a mechanically-activated ion channel that links mechanical forces to biological signals, exhibited consistent patterns with AUCell scores in both CCs (Fig. 6c) and OBs (Fig. 6e), as confirmed by IHC staining (Fig. 6d, f). Furthermore, the finite element analysis was performed for the mechanical stress distribution on the cartilage surface and subchondral bone based on the constructed three-dimensional models of knee joints of mice in each group (Fig. 6g). Bipedal mice at 18 and 22 weeks of age had higher mechanical stress in cartilage and subchondral bone compared to normal and FO mice, with FBO mice having the highest stress levels (Fig. 6h, i). These findings indicated that the study effectively increased the stress intensity of the knee joint using the bipedal mouse model.
Fig. 6
Enhanced mechanical stress accelerated cartilage degeneration. a, b The box plot represents the scores of chondrocytes (a) and osteoblasts (b) in each group for “response to mechanical stimulus” pathway in the GO database, scores come from the R package “AUcell”. c, d The box plot represents the Piezo1 gene expression of chondrocytes (c), and representative images of immunohistochemistry staining of indicated Piezo1 gene in cartilage tissue (d) in each group, Scale bar = 20 μm. e, f The box plot represents the Piezo1 gene expression of osteoblasts (e), and representative images of immunohistochemistry staining of indicated Piezo1 gene in subchondral bone (f) in each group, Scale bar = 20 μm. g Schematic representation of the workflow followed for Finite Element Analysis (FEA) of the models reconstructed from DICOM data of knees measured by micro-CT. h, i Heatmap of stress distribution (MPa) on cartilage surface and subchondral bone of knee joints in six groups at 18 (h) and 22 (i) weeks of age. The stress distribution is mainly concentrated on the medial side of the knee joints, and the stress intensity in bipedal mice was significantly higher than that in normal and FO mice. j Representative images of chondrocytes in bright field or staining with phalloidin (red) to present the cytoskeleton changes of chondrocytes before and after stretching for 24 h, Scale bars = 100 μm, 50 μm. k Expression level of genes related to mechanical stress and cartilage degeneration, including PIEZO1, ADAMTS5, MMP13, COL2A1, ACAN and SOX9, of chondrocytes before and after stretching for 24 h. Data are shown as mean ± SD, n = 3 per group. P-values were determined by unpaired, two-tailed t-test
In order to further explore the effect of mechanical stress on CCs, this study constructs an in vitro CC stress stimulation model using the IonOptix C-Pace EM stretch system. After 24 h of stretching, it was observed that CCs exhibited a notable elongation and narrowing of their shape and skeletal structure (Fig. 6j). Moreover, the expression levels of PIEZO1 gene and ECM-degrading metalloproteinases such as ADAMTS5 and MMP13 of CCs significantly increased after stretching, while the expression levels of ECM synthesis-related genes such as COL2A1, ACAN and SOX9 significantly decreased (Fig. 6k). The aforementioned findings suggest that enhanced mechanical stress may contribute to cartilage degeneration by reducing ECM synthesis.
Aggravated chondrocyte damage, vessel invasion and subchondral bone remodeling in the KOA miceThe FB mice have shown increased osteoclast differentiation and inhibited BMP signaling compared with the FN mice, while the MB mice showed an opposite trend compared with the MN mice (Supplementary Figs. 9–11). This could explain why the KOA phenotype of FB mice progressed more rapidly than that of MB mice during the same observation period. Compared to FN mice, alterations of gene expression of CCs in FBO mice were significantly related to oxidative stress, angiogenesis, senescence, and ECM dysregulation (Fig. 7a, d). Changes in the gene expression of the ECs in the FBO mice regulated abnormal vascular proliferation and pathological remodeling of the subchondral bone (Fig. 7b, e). Altered gene expression of the OBs in the FBO mice has enhanced osteoblast development, angiogenesis, and ECM degradation (Fig. 7c, f). Among these, the expression level of aging-related gene Rpl11 was significantly increased in the CCs of FBO group compared with that in the FN group (Fig. 7g). And so was Thbs1, a gene associated with the dysregulation of ECM (Fig. 7h). Angiogenic gene Ccn1 was upregulated in CCs of FBO mice than that of FN mice (Fig. 7i). The expression level of Col1a1, relevant to OB differentiation, was significantly increased in the OBs of FBO group compared with that in the FN group (Fig. 7j). Timp2, a gene inhibited the expression level of matrix metalloproteinase, was significantly downregulated in the OBs of FBO mice compared with that of FN mice (Fig. 7k).
Fig. 7
Chondrocyte damage, vessel invasion and subchondral bone remodeling was aggravated in the KOA mice. a–c The circle enrichment plot shows the GO database results of group FBO compared with group FN in chondrocytes (a), endothelial cells (b) and osteoblasts (c). The deeper the color or the bigger the size is, the −log10(p-value) is greater, indicating a more significant difference. Red (YlOrRd) circle plot indicated the up-regulation function of group FBO relative to group FN (left), and the blue (PuBu) circle plot indicated the down-regulation function (right). d–f Dot plots indicated differentially expressed genes of chondrocytes (d), endothelial cells (e) and osteoblasts (f) between the FBO and FN groups. Presented genes are derived from the results of interest in the enrichment analysis and mostly refer to degeneration of chondrocytes, angiogenesis and remodeling of subchondral bone. g The box plot represents the Rpl11 gene expression of chondrocytes related to the “senescence” pathway in (d). h The box plot represents the Thbs1 gene expression of chondrocytes related to the “ECM regulation” pathway in (d). i The box plot represents the Ccn1 gene expression of chondrocytes related to the “angiogenesis” pathway in (d). j The box plot represents the Col1a1 gene expression of osteoblasts related to the “osteoblast development” pathway in (f). k The box plot represents the Timp2 gene expression of osteoblasts related to the “ECM regulation” pathway in (f). All referred genes were confirmed in vivo by IHC staining, Scale bar = 20 μm. l Representative images of multi-immunofluorescence staining for type H vessels (CD31hiEMCNhi) grown in femoral condyles (FC) and tibial plateaus (TP) of FN and FBO mice. Articular cartilage (AC), subchondral bone (SB), growth plate (GP), and metaphysis (MP) were marked. Osterix+ progenitor cells (white) distributed a lot in the growth plate of FN mice, while it significantly decreased in FBO mice. And vessels highly expressed CD31 (red) and EMCN (green), even osterix+ progenitor cells (white) appeal around it, grown more in the subchondral bone of FBO mice than FN. Scale bar = 200 μm. m Quantitative analysis of the density of vessels in the subchondral bone of knees from the FN and FBO mice. Data are shown as mean ± SD, n = 5 per group. P-values were determined by unpaired, two-tailed t-test. n Representative images of multi-immunofluorescence and H&E staining for CD31hiEMCNhi vessels (white arrow indicated) invaded into articular cartilage of FBO mice. Scale bar = 40 μm. o Representative images of multi-immunofluorescence staining for type H vessels grown in SB of FBO mice. Scale bar = 40 μm. And representative TEM images of osteoblast grown around the vessel. Scale bars = 2 μm, 500 nm
The potential results concerning the alterations in gene expression in the CCs, ECs, and OBs in the FBO sample were validated. It was found that the blood vessels have significantly proliferated in the subchondral bone (Fig. 7l, m), while Osterix+ osteoprogenitor cells and blood vessels were obviously reduced in the growth plate of the FBO mice compared with the FN mice. Further observation revealed that the blood vessels have invaded the articular cartilage of the FBO mice (Fig. 7n). And CD31hi EMCNhi H-type vessels, recruiting Osterix+ osteoprogenitor cells, have grown in the subchondral bone of the FBO mice, which was closely coupled with osteogenesis (Fig. 7o). In addition, the expression of TRAP (Fig. 4g, h) in the subchondral bone of the FBO mice was significantly increased compared with the FN mice, which indicated the pathological remodeling of subchondral bones.
Angptl7 + chondrocytes promote angiogenesis through the FGF2-FGFR2 signaling pathway in the KOA miceSix sub cell types of 16,378 chondrocytes of six samples were visualized by a UMAP plot (Supplementary Fig. 16a), including angiogenic chondrocytes-1 (AngC-1, 6263), angiogenic chondrocytes-2 (AngC-2, 4800), prehypertrophic chondrocytes (preHTC, 2651), aging chondrocytes (AgeC, 1362), osteogenic chondrocytes (OstC, 939), inflammatory chondrocytes (InfC, 363) (Fig. 8a, Supplementary Fig. 16b, c). Based on the GO enrichment analysis of genes highly expressed in each subtype of CCs (Fig. 8b, Supplementary Fig. 16d–i), it was found that both AngC-1 and AngC-2 had the function of promoting angiogenesis (Supplementary Fig. 16d, e), and highly expressed Smoc2 and Angptl7, respectively; PreHTC highly expressed Col9a3, which was closely related to CCs hypertrophy (Supplementary Fig. 16f); AgeC highly expressed Apoe, that was closely associated with senescence (Supplementary Fig. 16g); OstC highly expressed Col1a1 and other related genes, that was closely coupled with osteoblast differentiation and bone development (Supplementary Fig. 16h); InfC highly expressed Ccl2, which was closely correlated with inflammation (Supplementary Fig. 16i). The number and position of six subpopulations of CCs in the femoral condyle of FBO mice were presented through multiplex IF staining of marker genes (Fig. 8c).
Fig. 8
Angptl7+ chondrocytes promoted angiogenesis through the FGF2-FGFR2 signaling pathway in the KOA mice. a Six sub cell types of 16,378 chondrocytes were visualized by a UMAP plot, including angiogenic chondrocytes-1 (AngC-1, 6263), angiogenic chondrocytes-2 (AngC-2, 4800), prehypertrophic chondrocytes (preHTC, 2651), aging chondrocytes (AgeC, 1362), osteogenic chondrocytes (OstC, 939), inflammatory chondrocytes (InfC, 363). b Expression patterns of selected markers projected on the UMAP plot. Red color indicated high expression and blue color indicated low or no expression, one marker for each sub cell type of chondrocytes was shown. c Representative images of immunofluorescence and H&E staining for marking the location and expression of six subtypes of chondrocytes in a FBO sample. Scale bar = 50 μm. d The heatmap shows the number of interactions in FBO group and FN group among each cell sub cell types. Red indicates a higher number of interactions in group FBO; blue indicates a higher number of interactions in group FN. e Circle plot showing the inferred FGF signaling networks in FN and FBO datasets. Edge line thickness indicated the interaction strength of FGF signaling between different cell types. The interaction between AngC-2 and EC was significantly improved through FGF signaling pathway in FBO sample. f Representative images of multi-immunofluorescence staining for the interaction between AngC-2 and EC through the FGF2-FGFR2 signaling pathway in the FBO sample. Scale bar = 50 μm
It was likely that AngC-2 is involved in the abnormal proliferation of vessels in the subchondral bone of FBO mice, rather than AngC-1 (Supplementary Fig. 17a–d). Compared with the FN sample, the expression of Cebpb, Cst3, Ecrg4, Thbs1, Ubb, Rpl11, and S100a10 in AngC-2 cells of the FBO sample was significantly upregulated, while the expression of Cdk8, Hk2, Fn1, Bmp2, and Nfkb1 was significantly downregulated (Supplementary Fig. 17f). Cell interaction analysis revealed that the interaction between AngC-2 and ECs in the FBO mice was obviously enhanced compared with that in the FN mice (Fig. 8d). And pathway screening reveals that AngC-2 may enhance its regulatory effects on ECs through the FGF signaling pathway (Fig. 8e and Supplementary Fig. 18). Further analysis found that AngC-2 in the FBO mice was believed to interact with ECs through the FGF2-FGFR2 ligand-receptor pair, which was also observed by multiplex IF staining (Fig. 8f and Supplementary Fig. 19).
To further investigate the role of ANGPTL7+ chondrocytes in cartilage degeneration and KOA progression, we constructed human chondrocyte models with ANGPTL7 knockdown (Supplementary Fig. 20a, b) and overexpression (Supplementary Fig. 20c, d) in vitro. Through cell immunofluorescence staining, we found that overexpression of ANGPTL7 exacerbated chondrocyte degeneration, whereas knockdown of ANGPTL7 mitigated chondrocyte degeneration (Supplementary Fig. 20e–j). For example, knocking down the ANGPTL7 gene expression in chondrocytes led to increased synthesis of ECM components, such as COL2A1 (Supplementary Fig. 20e) and ACAN (Supplementary Fig. 20f), and promoted the expression of cartilage differentiation gene SOX9 (Supplementary Fig. 20g), while reducing the expression of ADAMTS5 (Supplementary Fig. 20h) and MMP13 (Supplementary Fig. 20i). Additionally, we co-cultured common chondrocytes and ANGPTL7-overexpressing chondrocytes with human umbilical vein endothelial cells (HUVECs), selectively adding FGF2 protein or Alofanib (a FGFR2 inhibitor). Through tube-forming experiments, we verified that ANGPTL7+ chondrocytes significantly enhanced the angiogenic ability of HUVECs. However, the angiogenic ability of ANGPTL7+ chondrocytes was weakened after the addition of Alofanib (Supplementary Fig. 20k, l).
Sparc + OBs negatively regulate bone mineralization and osteoblastic differentiation in KOA miceIt was found that starting from PCs in FN and FBO samples, both can differentiate into different subtypes of OBs and CCs through trajectory analysis (Fig. 9a–c). While the expression levels of genes that negatively regulate bone mineralization such as Sparc, Ecm1, Mgp, and Srgn in each cell group during the differentiation process of PCs in FBO samples were always higher than those in FN samples, which were verified by IHC staining (Fig. 9d). It was suggested that there was a significant inhibition of subchondral bone mineralization in FBO mice. Furthermore, the expression levels of osteoblastic differentiation-related genes such as Runx2, Ibsp, Alpl, and Bmp2 in some OBs and OstCs in FBO samples were significantly lower than those in FN samples, which were verified by IHC staining (Fig.
留言 (0)