
記住我


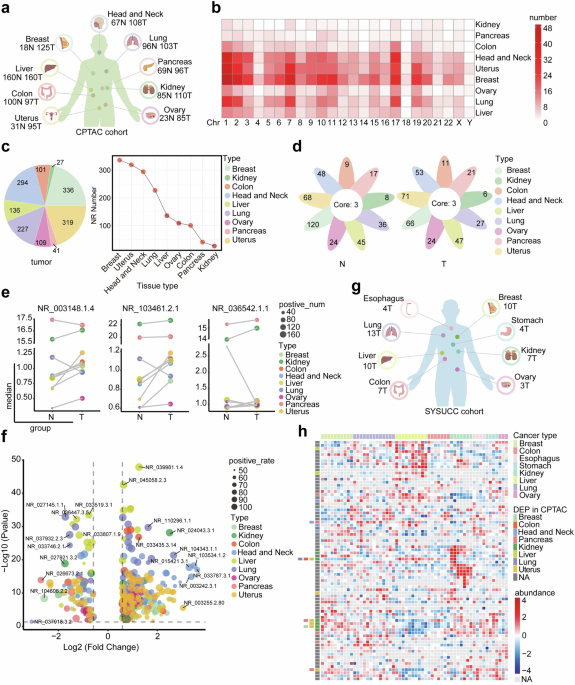
In our previous studies, we established the ribosome-nascent chain complex sequencing (RNC-seq) technique to determine that 3300 lncRNAs were bound to ribosomes with active translation elongation in nine cancer cell lines.7,19,22 In this study, proteomics data from the Clinical Proteomic Tumor Analysis Consortium (CPTAC), the Cancer Cell Line Encyclopedia (CCLE) and SYSUCC databases were used to screen candidate novel proteins of interest and conducted functional studies in renal cancer (Supplementary Fig. 1). Here, we acquired proteomic data from >1000 patients with nine types of malignant tumors in CPTAC (Fig. 1a). We then matched the 3300 translating lncRNAs to the CPTAC proteomic data, and identified 777 lncRNA-encoded proteins (LEPs) (Data S1), the lengths of LEPs are primarily distributed within the 50–200 amino acid (aa) range in tumor tissues (Supplementary Fig. 2a). These LEPs were distributed across various chromosomes (Fig. 1b and Data S2). Most LEPs were detected in over half of the kidney cancer samples but in fewer than 50% of lung cancer and head and neck cancer samples (Supplementary Fig. 2b and Data S3). The absolute numbers and the positive rates of LEPs identified in tumor tissues were noticeably different in human cancers (Fig. 1c, Supplementary Fig. 2c, d and Data S3). Proteins uniquely expressed in specific cancer types are listed in Fig. 1d and Data S4. Three proteins were found to be universally expressed in all tested cancer types and were differentially expressed between tumor and non-tumor tissues (Fig. 1e and Data S5). The expression of all the LEPs was further compared in nine types of cancer (Supplementary Fig. 2e and Data S6). LEPs expressed in >50% of the cases were subjected to differential expression analysis. The results indicated that LEPs were more frequently upregulated than downregulated in cancer tissues (Fig. 1f and Data S7). This may indicate that the expression of LEPs can be induced by oncogenic stress.
Fig. 1
Cryptic translation of microproteins hidden in lncRNAs in human cancers. a Schematic representation showing an overview of pan-cancer types and their distributions in the CPTAC cohort (Created with BioRender.com). b The chromosomal distribution of LEPs identified in the CPTAC cohort. LEPs expressed in >30% of the tumor tissues or non-tumor tissues within a specific sample type were considered to be identified. c The number of LEPs identified in tumor tissues for each sample type. LEPs identified in 30% of the tumor samples were considered to be expressed in the tumor samples. d Flower plot. The petals represent the unique LEPs identified for each cancer type, and the core represents LEPs identified in all cancer types. e The expression levels of the three LEPs identified in all nine cancer types, with the size of the dot indicating positive rates and the color representing the cancer type. f Differentially expressed LEPs between tumor and non-tumor samples in the CPTAC cohort. Volcano plot showing the LEPs with |fold change | ≥ 1.5 and p < 0.05. g Schematic representation showing an overview of pan-cancer types and their distributions in the SYSUCC cohort (Created with BioRender.com). h Heatmap showing the LEPs identified in the SYSUCC cohort. LEPs expressed in >30% of the samples within a cancer type were considered to be identified
To validate the expression profile of LEPs in human cancers, we further analyzed LEP profiling in both CCLE (Supplementary Fig. 3a, Data S8) and cancer cell lines preserved in our laboratory (Supplementary Fig. 3b, Data S9). The results consistently showed that LEPs were widely present in cancer cell lines. Additionally, we collected postsurgical samples from 58 patients with eight types of solid cancers from SYSUCC (Fig. 1g). Using the same strategy employed in the CPTAC cohort, we identified 78 LEPs that were expressed in these 58 clinical cases (Fig. 1h, Supplementary Fig. 3c, Data S10 and S11). Among the 78 LEPs, several with differential expression between tumor and non-tumor tissues were also found in the CPTAC cohort. Specifically, kidney cancer showed a significant profile of LEPs expression, as compared with other cancers (Fig. 1h). This may suggest the deep involvement of LEPs in the progression of kidney cancer.
The new protein TPM3P9 is upregulated in ccRCC, and its upregulation is correlated with poor prognosisGiven the potential roles of LEPs in kidney cancer, we conducted an in-depth screening for microproteins involved in the progression of clear cell renal cell carcinoma (ccRCC), as we previously reported.7 We conducted nascent polypeptide-associated complex sequencing on renal tubular epithelial cells (HK-2) and renal cancer cell lines (ACHN and 786-O) to obtain noncoding RNAs bound to ribosomes to construct a database of potential LEPs (Supplementary Fig. 4a). To identify functionally relevant novel proteins in renal cancer, we performed high-throughput liquid chromatography-tandem mass spectrometry (LC-MS/MS) analysis on proteins from four renal cancer tissue samples and their adjacent non-cancerous tissues (Supplementary Fig. 4b). Seven novel proteins encoded by noncoding RNAs were identified. The heatmap illustrated the expression levels of these proteins across the four renal cancer tissues and adjacent normal tissues (Supplementary Fig. 4c). To further investigate the biological functions of the dysregulated LEPs in ccRCC, we used siRNAs to evaluate the effects of these LEPs on cell proliferation. The results showed that TPM3P9 depletion significantly inhibited the proliferation of ACHN cells (Supplementary Fig. 4d). In the SYSUCC cohort, TPM3P9 was ubiquitously expressed across nearly all types of cancer (Supplementary Fig. 4e, f). Specifically, TPM3P9 expression is higher in kidney, breast, colon, head and neck, uterine, and liver cancers compared to the corresponding adjacent normal tissues, whereas TPM3P9 expression in lung cancer tissues was lower than that in non-cancerous tissue (Fig. 2a).
Fig. 2
The novel microprotein TPM3P9 is upregulated in ccRCC, and its upregulation is correlated with poor prognosis. a Violin plot showing the expression levels of the lncRNA-TPM3P9 encoded microprotein TPM3P9 in pan-cancer and non-tumorous tissues. ***p < 0.001; ****p < 0.0001; ns, nonsignificant. b Schematic representation of the microprotein TPM3P9 translated from lncRNA-TPM3P9, with the transcript NR_003148.3. Unique peptides are visually represented in purple. c The representative unique peptide of TPM3P9 was identified by shotgun mass spectrometry of ccRCC cell lines. d Verification of endogenous and exogenous TPM3P9 expression in ccRCC cells with TPM3P9 overexpression or knockdown, using a TPM3P9-specific antibody in western blot analysis. e Western blot showing the significant upregulation of TPM3P9 in ccRCC cell lines compared to human kidney HK-2 cells. The black arrow represents the destination blots. f Western blot showing significant upregulation of TPM3P9 in ccRCC tissues compared with adjacent non-tumorous tissues. The statistical plot demonstrates the high expression of TPM3P9 in renal cancer tissues. n = 16. g The degradation half-life of TPM3P9 was detected in ACHN cells treated with cycloheximide. Data from three biological replicates are shown as mean ± SEM. h Immunofluorescence staining assay demonstrates the cytosolic and nuclear distribution of TPM3P9 in ccRCC cells with a TPM3P9-specific antibody. Nuclei were stained with DAPI (blue), and TPM3P9 was stained with green. Scale bar, 5 μm. i The nuclear-cytoplasmic fractionation experiment confirms the expression of TPM3P9 in both the cytoplasmic and nuclear compartments. j The expression of TPM3P9 RNA (left) or protein levels (right) in paired ccRCC and adjacent non-tumor tissues in TCGA and CPTAC cohorts, respectively. **p < 0.01; ***p < 0.001. k Representative immunohistochemistry staining of TPM3P9 in ccRCC with high or low expression. Scale bar,100 μm. l, m Kaplan–Meier survival analyses indicated that ccRCC patients with high TPM3P9 expression had shorter overall survival (l, p < 0.05, log-rank test) and relapse-free survival (m, p < 0.01, log-rank test)
TPM3P9, comprising 92 amino acids translated from two exons, is encoded by the NR_003148.3 transcript on chromosome 19 (Fig. 2b). Furthermore, we substantiated the existence of TPM3P9 protein through various experimental approaches. Shotgun mass spectrometry was used to reveal the unique peptides of TPM3P9 by comparing the peptide sequences with the reviewed human protein database downloaded from UniProt (Swiss-Prot, https://www.uniprot.org/), which contains a total of 20,435 reviewed human proteins. Through sequence alignment, we identified unique peptides specific to TPM3P9 (Fig. 2c and Supplementary Fig. 5a, b). A specific antibody for TPM3P9 was generated and used to detect endogenous and exogenous TPM3P9 protein in ccRCC cells (Fig. 2d). Western blot analyses revealed significant upregulation of TPM3P9 in ccRCC cell lines (Fig. 2e) and clinical samples (Fig. 2f). Treatment with cycloheximide revealed that the half-life of the TPM3P9 protein was ~10 h in ACHN cells (Fig. 2g). Immunofluorescence staining demonstrated the cytosolic and nuclear localization of TPM3P9 in ccRCC cells (Fig. 2h). Furthermore, we validated the expression of TPM3P9 in both the cytoplasmic and nuclear compartments through a nuclear-cytoplasmic fractionation experiment (Fig. 2i). Analysis of TCGA and CPTAC data showed that both the mRNA and protein expression levels of TPM3P9 were higher in ccRCC tissues than in the corresponding adjacent non-tumor tissues. (Fig. 2j). Immunohistochemistry was used to evaluate the expression of TPM3P9 in 385 ccRCC patients (Fig. 2k and Supplementary Table 1), showing higher expression of TPM3P9 in ccRCC tissues. Prognostic analyses indicated that ccRCC patients with high TPM3P9 expression had shorter overall survival (OS) and relapse-free survival (RFS) (Fig. 2l, m). Overall, these findings indicate that lncRNA-TPM3P9 is able to be translated into the new microprotein TPM3P9, which is abnormally upregulated in ccRCC and associated with poor prognosis.
TPM3P9 exerts oncogenic activity in ccRCCWe next investigated the effect of the microprotein TPM3P9 on the proliferation of ccRCC cells. We constructed a plasmid containing the ORF encoding the wild-type TPM3P9 protein as well as a plasmid containing the related ORF with mutation of the start codon ATG to ATT, which normally results in the expression of the lncRNA but not the protein (Fig. 3a). TPM3P9 mRNA expression was upregulated in cells transfected with either the wild-type or the mutant ORF, whereas the TPM3P9 protein was overexpressed only in cells transfected with the wild-type ORF (Fig. 3b, c). CCK-8 (Fig. 3d), colony formation (Fig. 3e), and EdU incorporation assays (Fig. 3f) were performed to evaluate the effects of TPM3P9 protein overexpression on cell growth. The results demonstrated that overexpression of the TPM3P9 protein but not the associated lncRNA promoted ccRCC cell proliferation. Furthermore, we conducted qRT-PCR to measure the expression levels of lncRNA-TPM3P9 in several ccRCC cell lines. The results demonstrated that in ACHN and 786-O cells, the baseline expression of lncRNA-TPM3P9 was not significantly higher than in renal tubular epithelial cells HK-2 (Supplementary Fig. 6a). This suggests that the lack of significant cellular function observed with the overexpression of mutant start codon lncRNA-TPM3P9 is not due to high baseline expression of lncRNA. On the other hand, sgRNAs were used to knock down TPM3P9 in ACHN and 786-O cells. Western blot analysis confirmed the depletion of the TPM3P9 protein (Fig. 3g). The RNA expression level of TPM3P9 was not affected by sgRNAs (Supplementary Fig. 6b). Sequencing of the DNA fragments flanking the sgRNA target sites, combined with the T7 endonuclease I assay, further demonstrated that the knockout system functioned effectively at the DNA level (Supplementary Fig. 6c, d). Silencing TPM3P9 markedly suppressed cell viability, inhibited colony formation, reduced the number of EdU-positive cells, and induced G1 arrest (Fig. 3h–j and Supplementary Fig. 6e). Strikingly, both the overexpression and knockdown of TPM3P9 in ccRCC cells had limited effects on apoptosis (Supplementary Fig. 6f, g). In vivo models were used to examine the impact of TPM3P9 depletion on tumor growth. Tumor growth was significantly inhibited by knockout of TPM3P9 (Fig. 3k). Compared to control ccRCC cells, ccRCC cells containing sgRNAs specific for TPM3P9 generated xenograft tumors with a significantly smaller size and lower weight (Fig. 3l, m). No significant difference was observed in body weight among the mice (Fig. 3n). Collectively, these results indicate that the microprotein TPM3P9 promotes ccRCC progression in vivo and in vitro.
Fig. 3
The novel microprotein TPM3P9 promotes ccRCC proliferation. a Two plasmids encoding TPM3P9-Flag (TPM3P9) and TPM3P9-mut-Flag (Mut) were constructed. To generate the mutant, the translation initiation codon ATG was mutated to ATT to abolish protein translation. b Western blot analysis using anti-TPM3P9 and anti-Flag antibodies showed that the TPM3P9 protein was overexpressed only in ccRCC cells with the wild-type ORF. c TPM3P9 mRNA expression was upregulated in ccRCC cells transfected with either the wild-type or mutant TPM3P9 ORF. ****p < 0.0001. d CCK-8 assays were performed to test the growth ability of both ccRCC cell lines transfected with the indicated constructs. **p < 0.01; ns, nonsignificant. e Colony formation assays were performed to assess the colony formation ability of both ccRCC cell lines transfected with the indicated constructs. **p < 0.01; ***p < 0.001. f EdU assays were performed to evaluate the proliferation ability of both ccRCC cells transfected with the indicated constructs. **p < 0.01; ***p < 0.001. Bars, SEMs. Scale bar, 50 μm. g Western blot validation of TPM3P9 knockdown efficiency of the indicated sgRNAs in ccRCC cells. h CCK-8 assays were performed to test the growth ability of both ccRCC cell lines transfected with the indicated sgRNAs. **p < 0.01. i Colony formation assays were performed to test the colony formation ability of ccRCC cells transfected with the indicated sgRNAs. **p < 0.01; ***p < 0.001. Bars, SEMs. j EdU assays were performed to test the proliferation ability of both ccRCC cell lines transfected with the indicated sgRNAs. *p < 0.05; **p < 0.01. Bars, SEMs. Scale bar, 50 μm. k Mouse xenograft model showing that knockdown of TPM3P9 significantly inhibited tumor growth. **p < 0.01. l, m A mouse xenograft model was established by injection of control or TPM3P9-silenced ACHN cells, with tumor volume (l) and tumor weight (m) shown. Data from 5 mice per group are presented. **p < 0.01. n The body weight of the nude mice was monitored. ns, nonsignificant
TPM3P9 regulates the splicing of the oncogenic RNA TCF7L2The molecular mechanism through which TPM3P9 promotes ccRCC was subsequently explored. Gene set enrichment analysis (GSEA) of the ccRCC proteomic data and TCGA data based on the TPM3P9 expression revealed that TPM3P9 is involved in spliceosome signaling (Fig. 4a). Co-expression network analysis revealed that pathways related to RNA splicing were enriched in proteins co-expressed with TPM3P9 (Fig. 4b and Supplementary Fig. 7a). Thus, we performed RNA sequencing analysis of TPM3P9-overexpressing ACHN and 786-O cells to examine TPM3P9-mediated alternative RNA splicing (Fig. 4c and Supplementary Fig. 7b). The results indicated that exon skipping was the main RNA splicing event associated with TPM3P9. Among the candidate genes, TCF7L2 exhibited the most pronounced changes in exon retention. Specifically, retention of exon 13 in TCF7L2 mRNA was increased by ectopic expression of TPM3P9, leading to increased expression of the long splice variant TCF7L2-L (Fig. 4d and Supplementary Fig. 7c). The RT-PCR results showed that overexpression of the TPM3P9 protein, but not the corresponding mRNA, markedly induced the expression of TCF7L2-L and reduced the expression of TCF7L2-S in ccRCC cells (Fig. 4e). This was further confirmed by qRT-PCR using primers specific for TCF7L2-L (Fig. 4f).
Fig. 4
The microprotein TPM3P9 regulates the oncogenic RNA splicing of TCF7L2. a GSEA of ccRCC proteomic data and TCGA data showing that TPM3P9 is involved in the spliceosome pathway. b Enrichment analysis suggested that the proteins co-expressed with TPM3P9 were related to RNA splicing. c Pie chart based on RNA sequencing showing the distribution of alternative splicing changes following TPM3P9 overexpression in ACHN and 786-O cells. d Schematic representation of TCF7L2 alternative splicing and its splice variants. e RT-PCR validation of the increased expression of the TCF7L2-L variant in cells overexpressing the TPM3P9 protein. f The results of qRT-PCR using a specific primer pair confirmed the increase in the expression of the TCF7L2-L variant upon overexpression of the TPM3P9 protein.***p < 0.001. g Preparation of an antibody specific to the TCF7L2-L variant. h Western blot validation of the successful preparation of the anti-TCF7L2-L antibody and exogenous overexpression of the TCF7L2-L and TCF7L2-S variants. The HA-tag was fused with TCF7L2-L or TCF7L2-S. i Western blot showing the upregulation of the TCF7L2-L variant in cells ectopically expressing TPM3P9-Flag (TPM3P9) but not in those ectopically expressing TPM3P9-mut-Flag (Mut). j, k Knockdown of TCF7L2-L inhibited the ability of TPM3P9 to promote ccRCC cell proliferation. The expression of TCF7L2-L was measured by qRT-PCR (j), and the cell growth ability was confirmed by a CCK-8 assay (k). *p < 0.05; ***p < 0.001. Bars, SEMs. l, m Overexpression of TCF7L2-L reversed the inhibitory effect of TPM3P9 silencing on ccRCC cell growth. The expression of TCF7L2-L was measured by qRT-PCR (l), and the cell growth ability was confirmed by a CCK-8 assay (m). **p < 0.01; ***p < 0.001. Bars, SEMs. n–p Mouse xenograft model showing that overexpression of TCF7L2-L reversed TPM3P9 silencing-mediated inhibition of proliferation in ACHN cells. Tumor volume (n), tumor weight (o), and the increase in tumor volume over time (p) in nude mice. **p < 0.01; ns, nonsignificant. Bars, SD. q The body weight of the nude mice was monitored. ns, nonsignificant
Next, we examined the expression levels of TPM3P9 protein and TCF7L2-L mRNA in 12 ccRCC tissue samples. High TPM3P9 expression was tremendously associated with higher TCF7L2-L mRNA levels in clinical samples (Supplementary Fig. 7d). Furthermore, plasmids encoding TCF7L2-L and TCF7L2-S were constructed (Supplementary Fig. 7e) and an antibody specifically recognizing TCF7L2-L was generated (Fig. 4g). Both plasmids and the antibody were validated by western blot analysis (Fig. 4h). Ectopic expression of TPM3P9 in ccRCC cells upregulated TCF7L2-L protein expression (Fig. 4i). Silencing TPM3P9 significantly decreased TCF7L2-L mRNA expression (Fig. 4j).
To determine whether TPM3P9 promotes cell proliferation through TCF7L2-L, TCF7L2-L was re-expressed in ccRCC cells following TPM3P9 depletion (Fig. 4j). Restoration of TCF7L2-L expression reversed the inhibitory effect of TPM3P9 depletion on ccRCC cell growth (Fig. 4k). On the other hand, TCF7L2-L was knocked down in cells with TPM3P9 overexpressed (Fig. 4l). Silencing TCF7L2-L impeded TPM3P9-mediated cell proliferation (Fig. 4m). TCF7L2-L overexpression facilitated but TCF7L2-L knockdown inhibited ccRCC cell proliferation in vitro (Fig. 4k–m). Furthermore, results from the xenograft model demonstrated that TCF7L2-L overexpression increased xenograft growth and was able to abolish the suppression of tumor growth resulting from TPM3P9 knockout (Fig. 4n–p). The body weights of the nude mice were monitored, and no significant difference was found (Fig. 4q). Taken together, these findings indicate that the microprotein TPM3P9 modulates the splicing of TCF7L2 RNA to generate the oncogenic splice variant TCF7L2-L in ccRCC cells.
TPM3P9 suppresses TCF7L2 exon skipping via interaction with the RRM1 domain of the splicing factor RBM4We next investigated the mechanism by which TPM3P9 regulates TCF7L2 alternative splicing. Since no RNA-binding motif was found in TPM3P9, we hypothesized that TPM3P9 mediates RNA alternative splicing via interaction with splicing factors. RNA pulldown combined with high-resolution mass spectrometry was performed to identify proteins that bind to TCF7L2 pre-mRNA (Fig. 5a). Coomassie Brilliant Blue staining was used to visualize the proteins pulled down by the RNA probes (Fig. 5b). A total of 65 proteins were uniquely identified in the TCF7L2 group (Fig. 5c and Supplementary Table 2). Gene Ontology analysis revealed significant enrichment of the term RNA splicing (Supplementary Fig. 8a). Simultaneously, we conducted immunoprecipitation-mass spectrometry (IP-MS) to identify TPM3P9-interacting proteins (Fig. 5d). Silver staining was performed to detect proteins that specifically bind to TPM3P9 (Fig. 5e). MS analysis identified 139 proteins across four independent biological replicates of samples precipitated using an antibody specific for Flag (Supplementary Fig. 8b–d and Supplementary Table 3). Gene Ontology analysis revealed significant enrichment of the term RNA-binding pathway (Supplementary Fig. 8e). We next compared the TCF7L2 pre-mRNA-binding proteins with the TPM3P9-binding proteins and identified 23 overlapping candidates (Fig. 5f). The protein interaction network revealed the relationships among these candidates (Fig. 5g).
Fig. 5
The microprotein TPM3P9 binds to RBM4 and suppresses TCF7L2 exon skipping. a Diagram showing the workflow of RNA pulldown combined with high-resolution mass spectrometry to identify proteins binding to TCF7L2 pre-mRNA. The diagram was edited using Adobe Illustrator. b Coomassie blue staining showing TCF7L2 pre-mRNA pulled down with RNA probes. The black arrows represent the lanes with significant differences. c Venn diagram showing a total of 65 proteins potentially interacting with TCF7L2 pre-mRNA. d Diagram showing the workflow of Co-IP combined with high-resolution mass spectrometry to identify TPM3P9-interacting proteins. The diagram was edited using Adobe Illustrator. e Silver staining showing proteins specifically bind to TPM3P9; specific bands are highlighted with red arrows. f Venn diagram showing 23 proteins potentially interacting with both TPM3P9 and the TCF7L2 pre-mRNA. g A PPI network of these proteins potentially interacting with both TPM3P9 and the TCF7L2 pre-mRNA was constructed using Cytoscape software. h The PPI network of the five interaction partners closely associated with TPM3P9 and the TCF7L2 pre-mRNA. i RNA pulldown with the TCF7L2 pre-mRNA probe was performed to validate the interaction between TCF7L2 pre-mRNA and RBM4. j Co-IP assays using an anti-Flag antibody were performed to detect the interaction between TPM3P9 and RBM4 in ACHN and 786-O cells. k Co-IP assays using an anti-GFP antibody were performed to detect the interaction between TPM3P9 and RBM4 in ACHN and 786-O cells expressing TPM3P9-Flag
Additionally, we used catRAPID23,24 to predict RNA-binding proteins that may interact with TCF7L2 pre-mRNA (Supplementary Table 4). By intersecting these predicted proteins with the 23 candidate proteins, we found five proteins with strong evidence for interactions with both TPM3P9 and TCF7L2 pre-mRNA (Fig. 5h). Among them, RBM4, an RNA-binding protein involved in the alternative splicing of numerous genes, was chosen for further investigation. We first verified the binding of RBM4 to TCF7L2 pre-mRNA by RNA pulldown experiments, demonstrating that RBM4 but not TPM3P9 was detectable in the precipitates obtained with the TCF7L2 pre-mRNA probe (Fig. 5i). Subsequently co-immunoprecipitation assays and confocal microscopy confirmed the interaction between RBM4 and TPM3P9 in the nucleus of ccRCC cells (Fig. 5j, k and Supplementary Fig. 8f).
RBM4 primarily consists of an N-terminal RNA recognition motif (RRM) domain, responsible for RNA binding, and a C-terminal domain involved in protein-protein interactions.25 We constructed truncations to determine whether the RNA-binding domain of RBM4 is essential for its interaction with TPM3P9. We constructed plasmids encoding GFP-tagged full-length (RBM4-GFP) or GFP-tagged RBM4 truncation (RBM4-N-GFP, and RBM4-C-GFP) (Fig. 6a). These plasmids were co-transfected with the TPM3P9-Flag plasmid into ccRCC cells. Co-immunoprecipitation experiments using antibodies specific for GFP or Flag revealed that RBM4-GFP and RBM4-N-GFP but not RBM4-C-GFP were capable of binding to TPM3P9 (Fig. 6b, c). Given that the N-terminus of RBM4 contains two RNA-binding motifs, RRM1 and RRM2, we further constructed plasmids expressing N-terminal truncations lacking RRM1 (N1-GFP), RRM2 (N2-GFP), or both RRM1 and RRM2 (N3-GFP) (Fig. 6d). As depicted in Fig. 6e, f, both N1-GFP and N3-GFP lost the ability to bind to TPM3P9, indicating the crucial role of RRM1 domain in the RBM4-TPM3P9 interaction.
Fig. 6
The exploration of the binding region of TPM3P9 and RBM4. a Diagram of plasmids encoding GFP-tagged full-length RBM4 (RBM4-GFP) and GFP-tagged RBM4 truncations (RBM4-N-GFP and RBM4-C-GFP). The diagram was edited using Adobe Illustrator. b The indicated GFP-tagged wild-type RBM4 and mutant RBM4 plasmids as well as the TPM3P9-Flag plasmid were transfected into HEK293T cells, and co-immunoprecipitation with an antibody specific to GFP revealed that RBM4-GFP and RBM4-N-GFP, but not RBM4-C-GFP, were capable of binding to TPM3P9. The black arrows represent the destination blots. c The indicated GFP-tagged wild-type RBM4 and mutant RBM4 plasmids as well as the TPM3P9-Flag plasmid were transfected into HEK293T cells, and coimmunoprecipitation with an antibody specific for Flag revealed that RBM4-GFP and RBM4-N-GFP but not RBM4-C-GFP were capable of binding to TPM3P9. The black arrows represent the destination blots. d Diagram of plasmids encoding the RBM4 N-terminal truncations lacking RRM1 (N1-GFP), RRM2 (N2-GFP), or both RRM1 and RRM2 (N3-GFP). The diagram was edited using Adobe Illustrator. e, f The indicated GFP-tagged N-terminal domain deletion mutants of RBM4 were co-transfected with TPM3P9-Flag into HEK293T cells, and co-immunoprecipitation was performed using an antibody specific for Flag (e) or GFP (f); the results showed that both N1-GFP and N3-GFP, without the RRM1 motif, could not bind to TPM3P9. g RNA immunoprecipitation (RIP) showing the binding ability of different RBM4 truncations to TCF7L2 pre-mRNA. h Crosslinking immunoprecipitation coupled with high-throughput sequencing (CLIP-seq) analysis of RBM4 revealed that RBM4 specifically crosslinked to an intron upstream of exon 13 in TCF7L2 pre-mRNA. i The minigene assay and RIP assay using a binding sequence mutant with a mutation in the intron upstream of exon 13 confirmed that RBM4 bound only to the wild-type TCF7L2 pre-mRNA
The binding of RBM4 to TCF7L2 pre-mRNA was further characterized using RNA immunoprecipitation (RIP). We found that RBM4-ΔRRM1 was able to bind to TCF7L2 pre-mRNA. However, the ability to bind TCF7L2 pre-mRNA was lost when RRM2 or both RRM1 and RRM2 domains were absent (Fig. 6g). This indicated that the RRM2 domain of RBM4 was required for its interaction with TCF7L2 pre-mRNA. Analysis of crosslinking immunoprecipitation-high-throughput-sequencing (CLIP-seq) data for RBM426 revealed the specific RBM4-binding site in TCF7L2 pre-mRNA (Fig. 6h), revealing that RBM4 was cross-linked to an intron upstream of exon 13. The results of minigene and RIP assays using a mutated binding sequence in the intron demonstrated that RBM4 bound exclusively to the wild-type TCF7L2 pre-mRNA (Fig. 6i). These findings indicated that TPM3P9 modulates RNA splicing via its interaction with RBM4 in ccRCC cells.
TPM3P9 inhibits RBM4-mediated TCF7L2 RNA splicingWe next determined the role of RBM4 in the splicing of TCF7L2 RNA. Overexpression of RBM4 in ccRCC cells increased the expression of TCF7L2-S but decreased the expression of TCF7L2-L (Supplementary Fig. 9a, b). Furthermore, exogenous expression of RBM4 in ccRCC cells overexpressing TPM3P9 attenuated the upregulation of TCF7L2-L (Fig. 7a, b). The increase in the TCF7L2-L/TCF7L2-S ratio mediated by TPM3P9 overexpression was rescued by overexpression of RBM4 (Fig. 7c). To explore whether TPM3P9 is able to modulate the expression of RBM4, confocal microscopy and western blot analysis were performed. The results showed that TPM3P9 overexpression did not affect the cellular localization or expression level of the RBM4 protein in ccRCC cells (Fig. 7d, e). Considering our previous finding that RBM4 interacts with TPM3P9 and the TCF7L2 pre-mRNA through a similar domain, we next examined whether TPM3P9 modulates the binding of RBM4 to TCF7L2 pre-mRNA. RIP assays showed that RBM4 lost its ability to pull down TCF7L2 pre-mRNA in the presence of TPM3P9 overexpression (Fig. 7f). These findings indicate that TPM3P9 binds to the RRM domain of RBM4 to block RBM4-mediated RNA splicing of TCF7L2.
Fig. 7
The microprotein TPM3P9 inhibits RBM4-mediated TCF7L2 RNA splicing. a Western blot results showing that overexpression of RBM4 dramatically abrogated the TPM3P9-mediated increase in TCF7L2-L protein expression. b qRT-PCR results showing that RBM4 dramatically abrogated the TPM3P9-mediated increase in TCF7L2-L mRNA expression. ***p < 0.001. c RT-PCR results showing that the increase in the TCF7L2-L/TCF7L2-S ratio induced by TPM3P9 overexpression was reversed to the control level when RBM4 was overexpressed. **p < 0.01; ***p < 0.001; ns, nonsignificant. d Immunofluorescence staining showing that TPM3P9 overexpression did not affect the cellular localization or expression of the RBM4 protein. Nuclei were stained with DAPI (blue), TPM3P9 (green), and RBM4 (red). The staining intensity of RBM4 (red) was quantified. Unpaired two-tailed Student’s t-test; ns, nonsignificant. Bars, SEMs; scale bars, 10 μm (left) and 20 μm (right). e Western blot results showing that TPM3P9 overexpression did not affect the expression of the RBM4 protein in ccRCC cells. f RIP assay results showing that TPM3P9 overexpression weakened the binding ability of RBM4 to TCF7L2 pre-mRNA in ccRCC cells. g Overexpression of RBM4 restored the TPM3P9-mediated promotion of ccRCC cell growth. ***p < 0.001. h Mouse xenograft model showing that overexpression of RBM4 significantly inhibited tumor growth promoted by TPM3P9 overexpression. **p < 0.01; ns, nonsignificant. i, j Mouse xenograft model established with ACHN cells. Tumor growth (i), and tumor weight (j) are shown. Data are shown as the mean ± SD for 5 mice per group. Unpaired two-tailed Student’s t-test; **p < 0.01. k The body weight of the nude mice was monitored. ns, nonsignificant. l Co-IP assay results verifying the interaction between RBM4 and TPM3P9 in in vivo tumor samples. m Western blot results showing that RBM4 overexpression abolished the upregulation of TCF7L2-L mediated by TPM3P9 in in vivo tumor samples. n Kaplan–Meier survival analysis results showing that high RBM4 expression was associated with favorable overall survival in ccRCC patients in the SYSUCC cohort (p < 0.05, log-rank test). o Kaplan–Meier survival analysis showing that high RBM4 expression was associated with favorable disease-free survival in ccRCC patients in the SYSUCC cohort (p < 0.05, log-rank test). p Immunohistochemical data revealing the correlation between TPM3P9 and RBM4 expression in ccRCC patients. Scale bars, 50 μm. q Kaplan–Meier analysis of overall survival revealed that in the SYSUCC cohort, ccRCC patients with both high TPM3P9 and low RBM4 expression had the worst prognosis, while patients with both low TPM3P9 and high RBM4 expression had the best prognosis (p < 0.05, log-rank test). r Kaplan–Meier analysis of disease-free survival showed that in the SYSUCC cohort, ccRCC patients with both high TPM3P9 and low RBM4 expression had the worst prognosis, while patients with both low TPM3P9 and high RBM4 expression had the best prognosis (p < 0.05, log-rank test)
We further explored the impact of RBM4 on the ability of TPM3P9 to promote cell growth. Our in vitro and in vivo experiments demonstrated that overexpression of TPM3P9 in ccRCC cells increased cell viability and promoted tumor growth (Fig. 7g–j). Conversely, the ability of TPM3P9 to promote ccRCC cell proliferation and tumor growth was markedly suppressed by overexpression of RBM4 (Fig. 7g–j). The body weights of the nude mice remained unchanged (Fig. 7k). The results of Co-IP and western blot analysis of tumor samples from the in vivo model confirmed the interaction between TPM3P9 and RBM4 (Fig. 7l), and showed that TPM3P9 upregulated the expression of TCF7L2-L, an effect that was abolished by RBM4 overexpression (Fig. 7m). Collectively, these data suggest that TPM3P9 exerts its pro-tumor effect by modulating RBM4-mediated RNA splicing.
The expression of RBM4 in ccRCC tissues and its clinical significance were subsequently examined. Analysis of the network database revealed that RBM4 expression was significantly lower in ccRCC tissues than in non-tumor tissues (Supplementary Fig.
留言 (0)