Public Data Retrieval and Collection of Gene Sets Related to PMN
In order to acquire transcriptome datasets related to PMN, transcriptome data searches were conducted by accessing the gene expression omnibus of the National Center for Biotechnology Information (NCBI). The search used the keywords "PMN" or "Idiopathic Membranous Nephropathy." The selected dataset identifier was GSE216841, which comprised samples from 12 PMN patients and 8 healthy controls, all kidney tissue samples analyzed using the Affymetrix Human Genome U133 Plus 2.0 Array (Affymetrix, USA) for gene expression profiling.
Differential Analysis
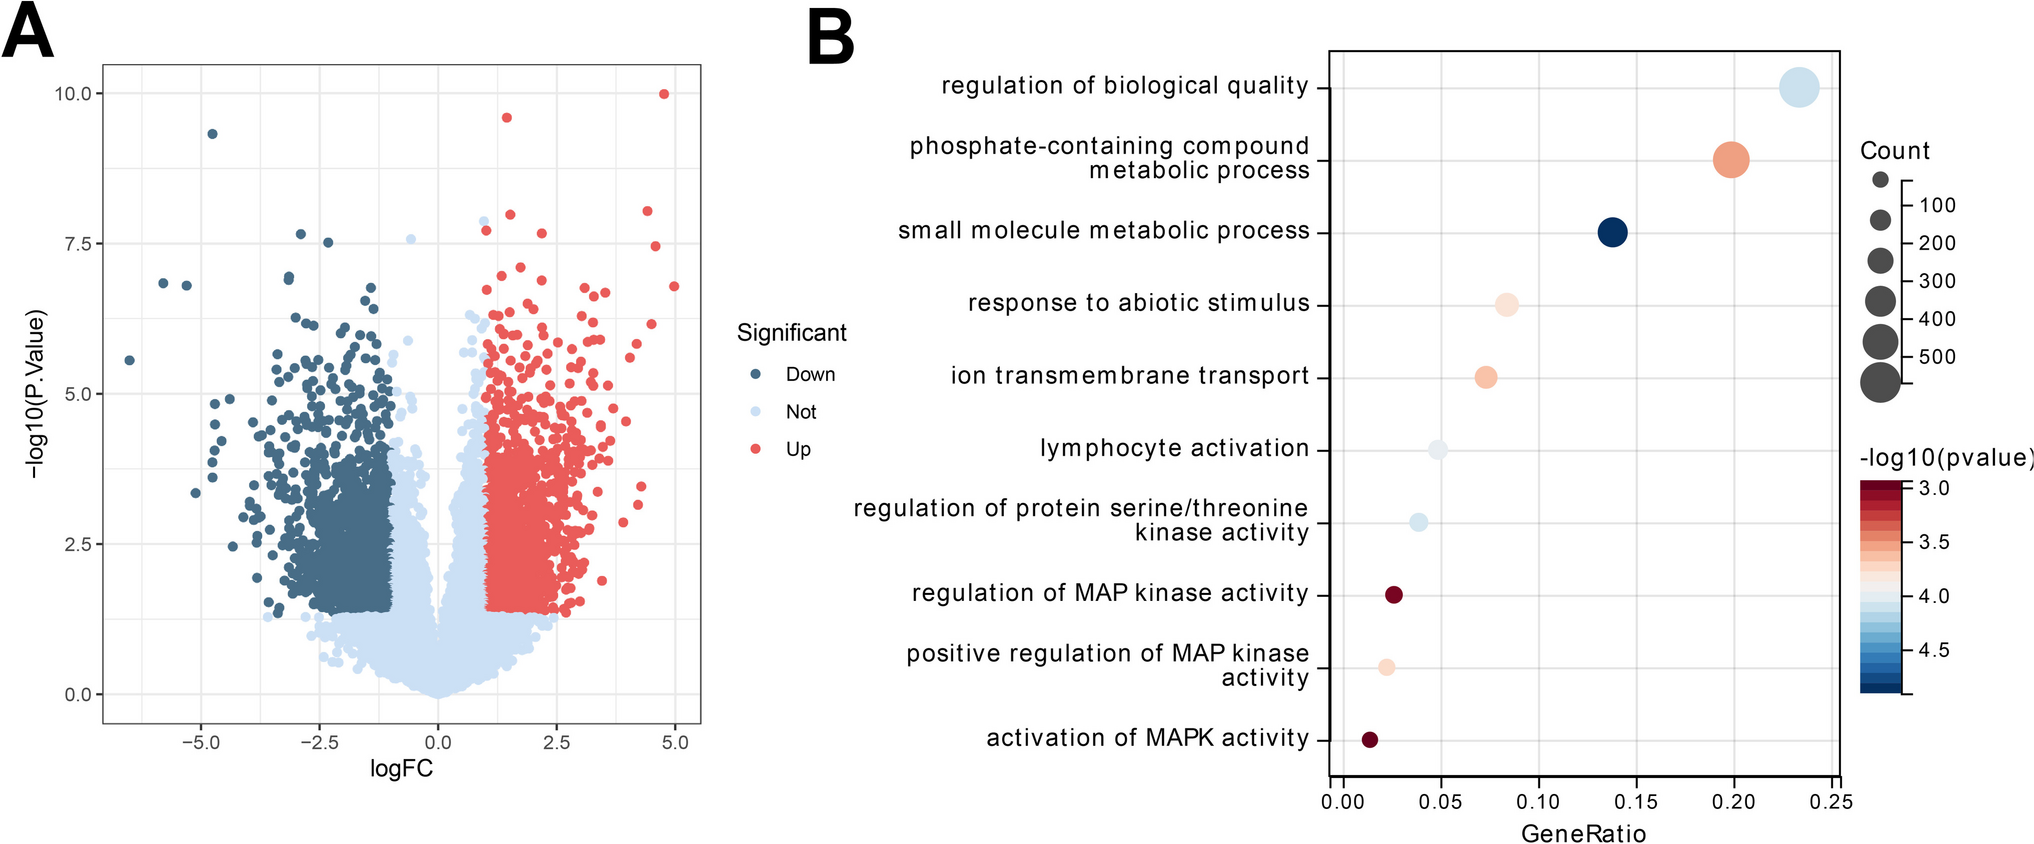
Differential analysis was conducted using the R package "limma", with healthy samples as the control group and PMN samples as the experimental group. The sequencing data was analyzed for differential gene expression using the "limma" package in R software, with the criteria of │logFC│ > 1 and p-value < 0.05 indicating differential gene expression. The results of the differential analysis were visualized using the "ggplot2" package in R, generating volcano plots.
Key genes related to pyroptosis were retrieved by searching the GeneCards online database. The relevant genes obtained were intersected using the "VennDiagram" package in R software and illustrated in a Venn diagram.
Enrichment Analysis
In our study of gene set functional enrichment analysis, gene ontology (GO) annotations from the R package org.Hs.eg.db (version 3.1.0) were employed as the background to map genes to the background set. Enrichment analysis was subsequently performed using the R package clusterProfiler (version 3.14.3) to ascertain the enrichment of gene sets. The minimum gene set size was set to 5 and the maximum gene set size was set to 5000. The GO analysis encompassed biological processes (BP), molecular function (MF), and cellular component (CC) analysis, culminating in identifying the cellular functions, signaling pathways significantly influenced by candidate target genes, and pathways enriched with disease-associated differentially expressed genes. For gene set functional enrichment analysis, the latest gene annotations for KEGG Pathway were retrieved using the KEGG REST API as the background to mapping genes to the background set. Again, the R package clusterProfiler (version 3.14.3) was utilized to analyze the enrichment of the gene set. Notably, a p-value of < 0.05 was deemed a significant condition for enrichment.
Construction of Protein–Protein Interaction (PPI) Networks
The filtered PPI network among factors was established using the STRING database (version 11.0, https://string-db.org/), aiming to identify crucial cellular signaling axes. Initially, selected cell death-related factors were used as query inputs, with the confidence threshold set at 0.7 to ensure the accuracy of interaction information within the network. Topological analysis of the network revealed that TRAF6 holds a central position in the PPI network, suggesting its potential role as a key signaling axis in the process of cell death.
Establishment of a PMN Model
A total of 36 female SD rats (8 weeks old) were purchased from Beijing Weitonglihua Experimental Animal Technology Co., Ltd. (Experimental Animal Production License Number: SCXK (Beijing) 2021–0006). The rats were housed in specific pathogen-free level animal facilities in individual cages with a humidity of 60% to 65% and a temperature of 22 to 25 °C. Following one week of acclimatization, the experimental procedures were initiated after assessing the rats' health status. The experimental protocol and animal usage scheme received approval from the relevant ethical committee.
For immunization, rats were emulsified with an equal volume of complete Freund's adjuvant (F5881, Sigma) containing 1 mg of cBSA (9058, Nanjing Wobo Biological Co., Ltd.). Two weeks post-immunization, rats were intravenously injected with cBSA at a dose of 16 mg/kg, administered three times a week at a one-day interval, and designated as the PMN group. After 4 weeks, the animals were euthanized, and we collected blood, urine, and kidney samples for analysis [23].
Animal Model Grouping and Treatment
A Slow Virus Treatment was conducted on a PMN rat model that was constructed through a 4-week cBSA treatment. The commercial TRAF6 silencing slow virus (sc-156004-V, Santa Cruz Biotechnology) was titrated to 109 TU/mL. The slow virus was administered via tail vein injection, with the PMN + sh-TRAF6 group rats receiving 5 × 10⁶ TU (Transduction Units) on the first day after modeling, and the animals were euthanized 14 days post-modeling. Blood, urine, and kidney samples were collected for analysis and subsequent experiments.
Based on the known TAK1 sequence in NCBI, Shanghai Hanheng Biotechnology Co., Ltd. (Shanghai, China) was commissioned to construct oe-NC, oe-TAK1 into the slow virus vector pHBLV-CMV-MCS-EF1-Puromycin, with a slow virus titer of 1 × 10⁸ TU/ml. The sh-TRAF6 and oe-TAK1 slow viruses were mixed in proportion, and the PMN + sh-TRAF6 + oe-TAK1 group rats received a mixture of sh-TRAF6 and oe-TAK1 slow viruses via tail vein injection on the first day after modeling, with each rat receiving 5 × 10⁶ TU. The animals were euthanized 14 days post-modeling, and samples were collected for analysis and further processing for subsequent experiments.
VX765 was purchased from MCE (HY-13205, MCE), dissolved in DMSO to prepare a stock solution with a concentration of 10 mg/mL, stored at −20 °C, and then added to physiological saline to achieve a concentration of 100 mg/kg for intragastric administration. In the PMN + sh-TRAF6 + oe-TAK1 group rats on the first day post-modeling success, the animals were treated by daily intragastric administration for 14 days before being euthanized, and blood, urine, and kidney samples were collected for analysis.
The rats were grouped as follows: 1) Normal group (rats without any treatment); 2) PMN group (rats induced with cBSA through tail vein injection to induce membranous nephropathy); 3) PMN + sh-NC + oe-NC group (rats in the PMN group infected with oe-NC, sh-NC slow viruses); 4) PMN + sh-TRAF6 + oe-NC group (rats in the PMN group infected with oe-NC, sh-TRAF6 slow viruses); 5) PMN + sh-TRAF6 + oe-TAK1 group (rats in the PMN group infected with oe-TAK1, sh-TRAF6 slow viruses); 6) PMN + sh-TRAF6 + oe-TAK1 + VX765 group (rats in the PMN group infected with oe-TAK1, sh-TRAF6 slow viruses and then stimulated with VX765). Each group consisted of six rats.
Biochemical Indicators Analysis
The urinary protein levels in rats were detected using the Coomassie Bright Blue assay (P0006, Beyotime). Rat serum was separated from fresh blood using an automated biochemical analyzer (7180 Autoanalyzer; Hitachi, Tokyo, Japan) for biochemical testing, including serum creatinine (SCr), blood urea nitrogen (BUN), albumin (ALB), total cholesterol (T-CHOL), triglycerides (TG), high-density lipoprotein (HDL), and low-density lipoprotein (LDL).
Renal Tissue Electron Microscopy Examination
Renal tissue pieces of approximately 1 mm3 from each animal were fixed in 2.5% glutaraldehyde (Sigma-Aldrich, USA) at 4 °C for over 4 h. The samples were then washed three times with phosphate-buffered saline (PBS) and post-fixed in 1% osmium tetroxide (catalog number 1.24505, Sigma-Aldrich, USA) at room temperature for 1 h. Subsequently, staining with uranyl acetate (CAS number 6159–44-0, Shanghai Magi Biological Co., Ltd) and lead citrate (CAS number 512–26-5, Beijing Hyde Biological Technology Co., Ltd) was carried out before preparing ultrathin Sects. (70 nm thick). The stained specimens were observed after drying, and transmission electron micrographs were captured using an H-7500 transmission electron microscope (Hitachi Ltd., Tokyo, Japan). The average width of foot processes was calculated using the DigitalMicrograph software (Gatan, Inc., Pleasanton, CA, USA) as (π/4) × (total length of glomerular basement membrane (GBM) / total number of foot processes).
Western Blot Analysis
Cells and tissues were lysed on ice for 30 min in RIPA buffer (P0013B, Beyotime, Shanghai, China) with 1% PMSF, followed by centrifugation at 14,000 × g at 4 °C. Protein concentration was determined using the BCA method (P0012S, Beyotime, Shanghai, China). After denaturing 50 µg of protein at 100 °C for 10 min, electrophoresis and transfer to a PVDF membrane were performed. The membrane was blocked with 5% non-fat milk for 1 h and incubated overnight at 4 °C with primary antibodies (TRAF6, TAK1, Ubiquitin, Cleaved Caspase-1, GSDMD-N, β-Tublin). After washing, an HRP-conjugated secondary antibody was applied, and signal detection was performed using the ECL system (32209, Thermo Fisher Scientific). Grayscale analysis was conducted using ImageJ software. The experiment was repeated three times.
Quantitative Real-Time PCR (qRT-PCR)
Total RNA from cells and kidney tissue was extracted using Trizol reagent (Invitrogen, USA) and assessed for concentration and purity using a Nanodrop 2000 spectrophotometer. RNA was reverse transcribed into cDNA using the PrimeScript RT reagent kit (Takara, Japan). qRT-PCR was performed with the Fast SYBR Green PCR kit (Takara) on an ABI PRISM 7300 system, with GAPDH as the reference gene. The 2−ΔΔCt method was used to analyze relative gene expression levels, and each reaction had three technical replicates. The experiment was repeated three times. Primers were synthesized by Shanghai Shenggong Biological Company (Table S1).
Differentiation and Validation of Human Podocytes
The human podocyte line was obtained from Xiamen Yimo Biological Technology Co., Ltd. (IMP-H062). The cells were seeded onto culture plates coated with type I collagen and cultured in RPMI-1640 medium (11875093, USA) supplemented with 10% FBS (26140079, USA), 100 U/ml penicillin, and 100 μg/ml streptomycin (15140122, USA). Cells were maintained in a proliferative state at 33 °C with 5% CO2. Upon transfer to 37 °C, cell proliferation ceased, and differentiation began. Under the 33 °C culture conditions, the medium was changed every two days. Once cells reached 70% confluency, they were transferred to 37 °C with 5% CO2 to undergo differentiation for 10–12 days. Differentiation status was confirmed by immunofluorescence staining for podocalyxin (1:200, Abcam, UK). For human podocyte lines, ITS (C0341-10 ml, Beyotime) was added at a 1:100 ratio to the standard culture medium. Podocytes were treated with 50 nM C3a (HY-P7862, MCE) for 1 h to establish a complement-induced podocyte injury model (PMN group) [24, 25].
Commercial TRAF6 silencing lentivirus (sc-36717-V) was purchased from Santa Cruz Biotechnology (Shanghai) and titrated to 109 TU/mL. Podocytes were seeded at 1 × 10⁶ cells per well in a 6-well plate, incubated for 24 h, infected with the lentivirus, and further experiments were conducted 72 h post-infection.
Based on the known TAK1 sequence in NCBI, Shanghai Hanheng Biotechnology Co., Ltd. (Shanghai, China) constructed oe-NC and oe-TAK1 into the lentiviral vector pHBLV-CMV-MCS-EF1-Puromycin and stably knocked down TRAF6 in podocytes seeded at 1 × 10⁵ cells per well in a 6-well plate. After 24 h of routine culture, when the cell confluence reached around 75%, the medium containing an appropriate amount of packaged lentivirus (MOI = 10, working titer approximately 5 × 10⁶ TU/mL) and 5 μg/mL polybrene (Merck, TR-1003, USA) was added for infection. The lentiviral titer was 1 × 10⁸ TU/ml. The medium was replaced with a medium containing 4 μg/mL puromycin (Invitrogen, A1113803) 72 h later, and cells were cultured for at least 14 days. Puromycin-resistant cells were expanded in a medium containing 2 μg/mL puromycin (Invitrogen, A1113803) for 9 days before transferring to a puromycin-free medium to obtain stable podocytes overexpressing TAK1 [26].
VX765 was purchased from MCE (HY-13205, MCE), dissolved in DMSO to prepare a 10 mg/mL stock solution, stored at −20 °C, and added to the cell culture medium at a concentration of 20 μM to stimulate podocytes for 48 h before subsequent experiments.
The cells were divided into the following groups: 1) Control group (normal podocytes); 2) PMN group (podocytes treated with C3a); 3) PMN + sh-NC + oe-NC group (PMN group cells overexpressing the negative control and infected with shRNA negative control); 4) PMN + sh-TRAF6 + oe-NC group (PMN group cells overexpressing the negative control and infected with shTRAF6); 5) PMN + sh-TRAF6 + oe-TAK1 group (PMN group cells overexpressing TAK1 and infected with shTRAF6); 6) PMN + sh-TRAF6 + oe-TAK1 + VX765 group (PMN group cells overexpressing TAK1 and infected with shTRAF6, followed by stimulation with VX765).
Immunoprecipitation Assay
For immunoprecipitation, the Pierce™ Co-Immunoprecipitation Kit (26,149, USA) was used following the manufacturer's instructions. Pre-cleaning of lysates containing 1 μg total protein was performed using a suitable isotype IgG antibody (ab6721, diluted at 1:2000). Subsequently, the pre-cleared lysates were mixed with 2 mg of anti-TRAF6 antibody (ab137452, Abcam) and gently shaken at 41 °C overnight. Protein G agarose beads (Thermo) were added to each tube, followed by further incubation at 41 °C with gentle shaking. The immunocomplexes were washed with cold radioimmunoprecipitation assay buffer, and the antibody-selected proteins were eluted from the agarose beads by boiling in SDS sample buffer (0.1 M Tris–HCl, 10% glycerol, 2% SDS, 0.05% bromophenol blue, and 0.1 M DTT) for 5 min. Similar conditions using the IgG antibody (ab6721) were employed for each gel's control lane. Subsequently, each sample was resolved on a 10% SDS-PAGE gel, and Western blotting with anti-TAK1 antibody (PA5-17507, Thermo Fisher Scientific) was conducted to confirm the physical interaction between the two proteins in the immunocomplex.
ELISA Experiment
Kidney tissues were extracted from rats and homogenized in 5–10 ml pre-chilled PBS. The resulting homogenate was further processed by sonication or repeated freeze–thaw cycles, followed by centrifugation at 850 × g for 15 min at 4 °C to collect the supernatant for subsequent experiments. For cell preparation, cells were initially digested with trypsin, harvested by centrifugation, and sonicated. After centrifuging at 1500 × g for 10 min at 4 °C, the supernatant was collected for later use. Following the instructions provided in the rat IL-6 ELISA kit (PI326) and rat TGF-β1 ELISA kit (PT878), as well as the human IL-6 ELISA kit (PI330) and human TGF-β1 ELISA kit (PT880), monoclonal antibodies against IL-6 and TGF-β1 were coated on a 96-well microplate. The plate was then incubated overnight at 4 °C, followed by a 1-h blocking step at room temperature, and washed with PBS. Subsequent steps were carried out according to the kit instructions. The optical density (OD) values were measured at a wavelength of 450 nm using an enzyme immunoassay reader (A51119500C, Thermo Fisher, USA).
Cell Counting Kit-8 (CCK-8) Experiment
The CCK-8 (C0037, Beyotime) was utilized in this experiment. Cells were seeded in a 96-well plate. After a 48-h incubation period, 10 μL of CCK-8 solution was added to each well. Subsequently, the cells were further incubated for 1–2 h, followed by the measurement of cell optical density at a wavelength of 450 nm. The experiment was repeated thrice.
Immunofluorescence Staining
Differentiated and undifferentiated podocytes were fixed on glass slides using 4% formaldehyde (F1635, Sigma-Aldrich) at room temperature for 15 min. Immunofluorescence staining was performed using a specific antibody against the podocyte differentiation marker PODXL (PA1-46169, Thermo Fisher). Cells treated with the PODXL antibody were then incubated with Alexa Fluor® 488-conjugated secondary antibody (ab150077, Abcam, UK). Nuclear staining was performed using DAPI (C1005, Beyotime). The specimens were imaged at 400 × magnification using an inverted Olympus FV1000 laser scanning confocal microscope (Olympus).
Reactive Oxygen Species (ROS) and Cell Viability Assay
Hoechst 33342 and PI Staining: Cells were cultured at 37 °C and stained with propidium iodide (PI) (3.34 μg/mL, HY-D0815, MCE) for 20 min, followed by incubation with Hoechst 33342 (10 μg/mL, HY-15559, MCE) for 20 min for nuclear staining at 37 °C. Microscopic images were captured using a confocal microscope (LSM710; Carl Zeiss Meditec AG, Oberkochen, Germany).
ROS Detection: Cell ROS levels were assessed using a 2',7'-dichlorofluorescin diacetate (DCFH-DA) probe (HY-D0940, MCE, USA). A stock solution of H2DCFDA was prepared at 10 mM in DMSO and further diluted before use. Cells were incubated with PBS solution containing 5 μM H2DCFDA at 37 °C in the dark for 30 min, followed by PBS wash and the addition of fresh culture medium. Fluorescence microscopy images were captured immediately.
Immunohistochemistry of Human Tissue Samples
Human renal tissue samples, including 10 cases each of PMN and healthy controls, were collected and fixed in 4% paraformaldehyde at room temperature for 24 h. The samples were dehydrated using an ethanol gradient (75%, 85%, 95%, and absolute ethanol, each for 1 min), followed by two 1-min immersions in xylene. The tissues were embedded in molten paraffin, sectioned into 3–4 µm thick slices, and subsequently deparaffinized and hydrated in xylene and ethanol. Antigen retrieval was performed by immersing the samples in 10 mM sodium citrate buffer (pH 6.0) and heating at 92 °C for 40 min. After washing twice with PBS, the sections were blocked with 5% BSA at 37 °C for 30 min. Primary antibodies, including rabbit anti-TRAF6 (ab33915, Abcam, USA), anti-TAK1 (PA5-17507, Thermo Fisher), anti-Ubiquitin (E4I2J, 43124S, Cell Signaling Technology), anti-Cleaved Caspase-1 (PA5-99390, Thermo Fisher), and anti-GSDMD-N (AF4012, Affinity Bioscience), were incubated at room temperature for 1 h. Following PBS-T washing, HRP-conjugated goat anti-rabbit IgG (ab205718, Abcam, UK) was applied as the secondary antibody. Staining was visualized using a DAB substrate kit (Beyotime, P0203), and the tissue sections were imaged using the EVOS cell imaging system.
Statistical Analysis Methods
The data were obtained from at least three independent experiments, and the results are presented as mean ± standard deviation (Mean ± SD). A two-sample independent t-test was used to compare the two groups. For comparisons involving three or more groups, a one-way analysis of variance (ANOVA) was conducted, followed by hoc Tukey's HSD test. For data not following a normal distribution or exhibiting inhomogeneous variances, either the Mann–Whitney U test or the Kruskal–Wallis H test was employed. All statistical analyses were conducted using GraphPad Prism 9 (GraphPad Software, Inc.) and the R programming language. The significance level for all tests was set at 0.05, and a two-tailed p-value less than 0.05 was considered statistically significant.


留言 (0)