Chemicals and Antibodies
KR was acquired from MedChemExpress (USA) (Catalog# HY-N2279, purity: 99.47%). Specific pathogen-free (SPF) C57BL/6 mice were sourced from Charles River Laboratories (CRL, USA). Fetal bovine serum (FBS), penicillin/streptomycin, and α-modified minimum essential medium (α-MEM) were procured from Newzerum (Nanjing, China). Recombinant RANKL and M-CSF proteins were obtained from R&D Systems (USA). The Cell Counting Kit-8 (CCK-8) assay was performed using a kit obtained from Dojindo (Japan, Catalog# CK04). A sterile bovine serum stock solution was supplied by Yaoyang Biotechnology Co., Ltd. (Shanghai, China). Primary and secondary antibodies targeting p-AKT, p-GSK-3β, AKT, GSK-3β, and c-Fos were obtained from Cell Signaling Technology (CST, USA). Antibodies for Nrf2, HO-1, CAT, NOX1, p-PI3K, and PI3K were sourced from Abcam (UK), while antibodies for β-actin, Nfatc1, Ctsk, and Keap1 were provided by Proteintech Group (Wuhan, China). Intracellular levels of reactive oxygen species (ROS) were quantified using the ROS Assay Kit—Highly Sensitive DCFH-DA from DOJINDO (Shanghai, China). The fluorescent staining kit for cyclopeptide was acquired from Solarbio (Beijing, China), and the TRAP/ALP Double Staining Kit was procured from Takara Bio (Catalog# MK300, Japan).
Cell Viability Assay
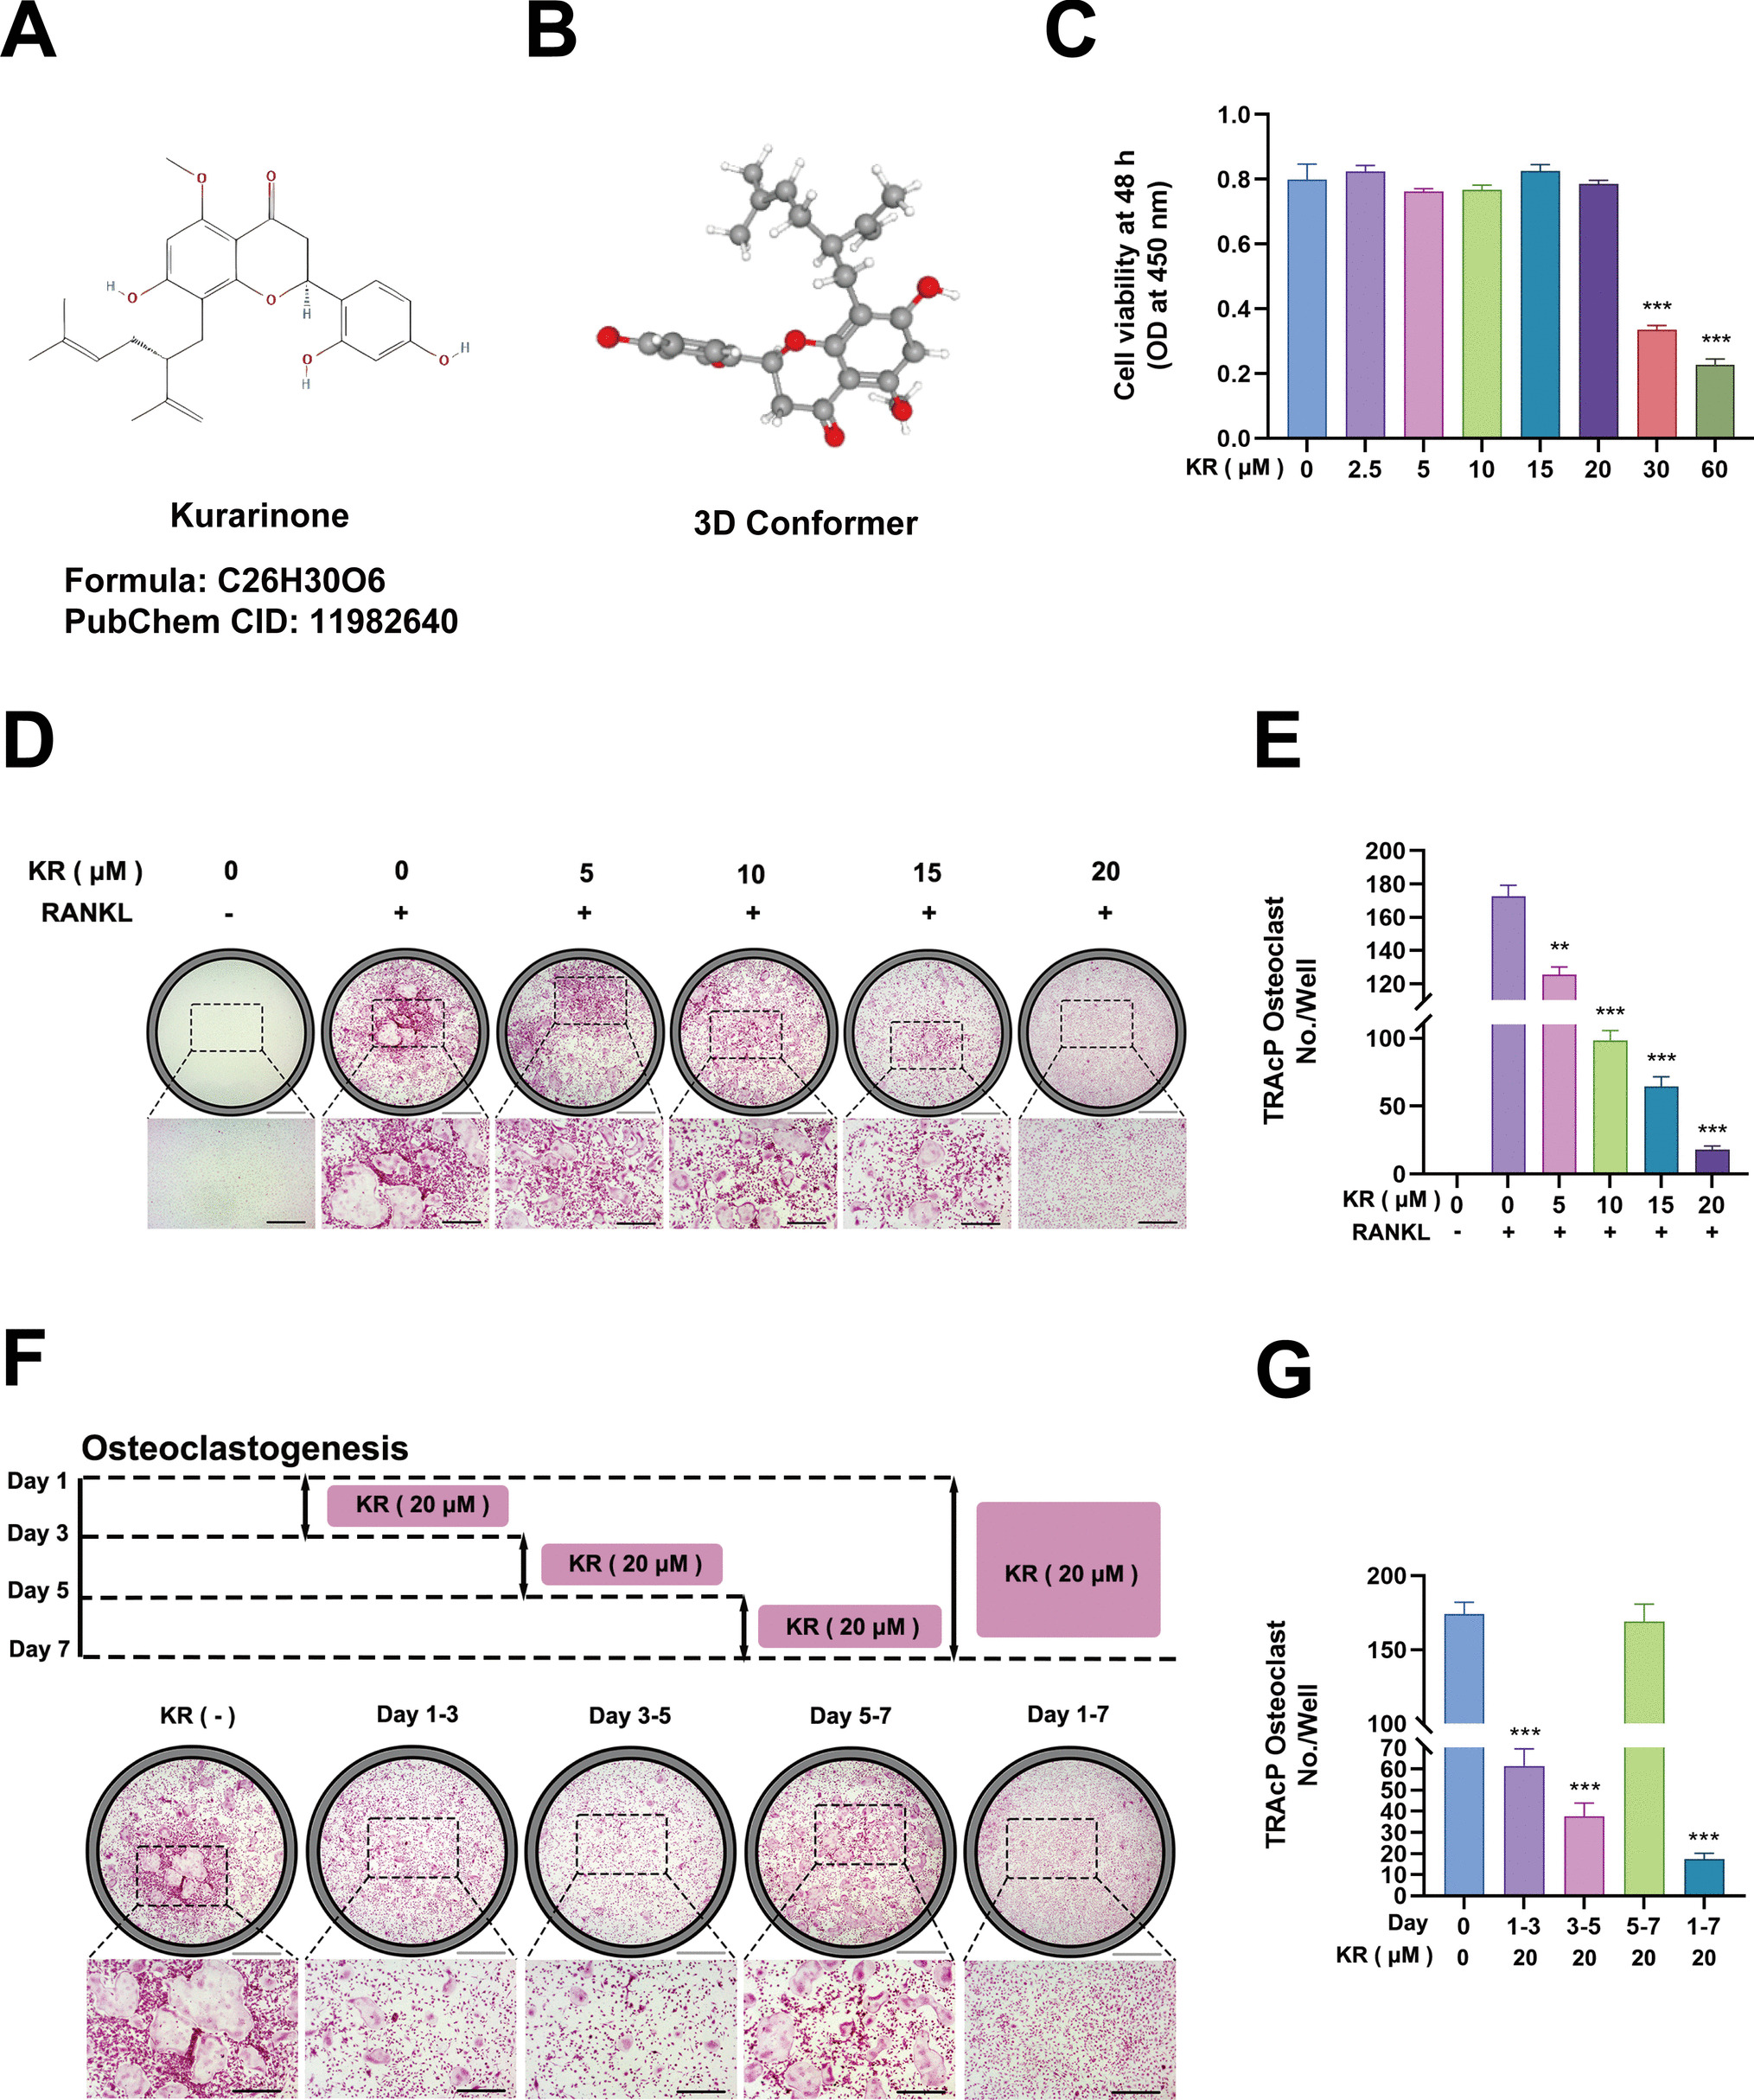
BMMs were plated in 96-well plates at a density of 1 × 10⁴ cells per well, utilizing 100 µL of complete culture medium. Following overnight incubation at 37 °C within a humidified environment containing 5% CO₂, the cells were exposed to varying concentrations of KR working solutions (0, 2.5, 5, 10, 15, 20, 30, and 60 µM) for 48 h. Upon completion of the incubation period, 10 µL of Cell Counting Kit-8 reagent was incorporated into each well, and the plates were subjected to an additional 2-h incubation at 37 °C. The optical density (OD) of each well was subsequently assessed at 450 nm using a Microplate Reader (Varioskan LUX, Thermo Fisher, Singapore). Wells containing only culture medium, devoid of cells, were utilized as blank controls, while untreated cells were designated as negative controls. All measurements were executed in triplicate, and the mean OD values were computed to evaluate cell viability.
Primary Osteoclast Culture and TRAP Staining
Male C57BL/6 SPF mice, aged between 4 to 6 weeks, were utilized to extract bone marrow-derived macrophages (BMM) from their tibial and femoral bones. The collected cells were cultured overnight in a complete medium comprising 10 ng/mL M-CSF. After a 24-h incubation period, non-adherent cells were harvested and subsequently cultured for an additional two days in a complete medium containing 30 ng/mL M-CSF. Following this, the cells underwent digestion and were plated into 24-well plates with the complete medium that included 30 ng/mL M-CSF. Upon cell adhesion, osteoclast differentiation was triggered by utilizing a complete medium supplemented with 30 ng/mL M-CSF, 50 ng/mL RANKL, and varying concentrations of KR (0, 5, 10, 15, and 20 μM). The influence of KR on osteoclastogenesis was monitored over a 5 to 7-day induction period, with a particular focus on the time-dependent effects observed at 20 μM KR. To evaluate the effect of KR on LPS-induced osteoclast differentiation, RAW264.7 cells were plated at a density of 2 × 10³ cells per well in 96-well plates. The positive control group was administered LPS (100 ng/mL) exclusively, whereas the experimental groups received LPS (100 ng/mL) in conjunction with various concentrations of KR (5, 10, and 20 μM). Following the induction of giant multinucleated osteoclasts, the cells were fixed with 4% paraformaldehyde for 15 min at room temperature. TRAP staining was executed following the manufacturer's guidelines using the TRAP Staining Kit (Takara Bio, Cat# MK300, Japan). Representative fields were captured utilizing a Zeiss Axio Observer inverted fluorescence microscope coupled with an Axiocam 208 camera (Zeiss, Germany). Image processing and merging were performed using Photoshop software, while ImageJ software (Bethesda, MD, USA) facilitated the quantitative statistical analysis of mature osteoclasts. TRAP-positive multinucleated cells containing three or more nuclei were classified as osteoclasts. Data were compiled from three independent experiments, with each group consisting of three replicates.
F-Actin Ring Staining Assay
BMMs were plated at a concentration of 1 × 10⁵ cells per well in 24-well plates and subsequently exposed to KR at varying concentrations of 0, 10, and 20 μM. Following a 6-day incubation period and were then fixed using 4% paraformaldehyde for 10 min at room temperature, treated with 0.1% Triton X-100 for 10 min to achieve permeabilization, and subsequently blocked with horse serum for 60 min. To visualize F-actin rings, a cyclopeptide staining kit was utilized, with nuclei being counterstained with DAPI for an additional 10 min. Imaging was conducted using a Zeiss Axio Observer inverted fluorescence microscope, which was paired with an Axiocam 208 camera (Zeiss, Germany), ensuring that exposure and gain settings remained consistent across all samples. The proportion of the F-actin ring area was determined by calculating the ratio of the F-actin ring area to the overall osteoclast area within the designated region of interest (ROI), which was then multiplied by 100%. The areas of F-actin rings were delineated using ImageJ software (Bethesda, MD, USA) with a predetermined color threshold, while the total osteoclast areas were assessed by tracing cell boundaries based on F-actin and nuclear staining.
Bone Resorption Pit Assay
BMMs were plated at a density of 1 × 10⁴ cells per well within 96-well plates that incorporated bovine bone slices. Control wells, which were also seeded with BMMs at the same density but excluded bone slices, were established concurrently. Following an overnight incubation period to facilitate cell adhesion, osteoclast differentiation was stimulated using culture medium supplemented with KR at concentrations of 0, 10, and 20 μM. The cells were maintained in culture until mature osteoclasts were identifiable in the control wells, after which they underwent an additional incubation period of 48 h. To remove excess cells from the bone slices, an ultrasound treatment was employed, after which the samples were fixed, thoroughly rinsed with double-distilled water (ddH₂O), and allowed to air-dry. Representative images of the bone resorption pits were acquired utilizing a scanning electron microscope (SEM) (JEOL, ARM200F, Japan). Quantitative analysis of the bone resorption pits was conducted employing ImageJ software (Bethesda, MD, USA). For each group, five random fields of view were documented.
Assessment of Mitochondrial Membrane Potential and Intracellular Reactive Oxygen Species
BMMs in their logarithmic growth phase were plated at a density of 1 × 10⁴ cells per well in 96-well plates. After allowing sufficient time for cell adhesion and proliferation, the cells were cultured for 48 h, either with or without the application of KR treatment, and subsequently, 100 µL of DCFH-DA probe (diluted at 1:1000, Beyotime, Shanghai, China) or 500 nM TMRE working solution (Beyotime, Shanghai, China) was introduced into each well, processing for 30 min. Following this, 100 µL of Hoechst 33,342 live cell stain solution was added to each well and allowed to incubate for an additional 10 min. Representative images were obtained using an inverted fluorescence microscope, facilitating the assessment of intracellular reactive oxygen species (ROS) levels as well as mitochondrial membrane potential (MMP), which was detected using a fluorescence microplate reader. Excitation and emission wavelengths were set to 485 nm and 535 nm average gray value of the intracellular fluorescence was quantified employing ImageJ software (Bethesda, MD, USA).
Flow Cytometry
BMMs were plated at a density of 1 × 10⁶ cells per well in 6-well plates. Following cell adhesion, the cells were cultured for 48 h in an osteoclast induction medium, with or without the addition of KR at concentrations of 0, 10, and 20 μM. Once approximately 90% cell fusion was achieved, subjected to a 5-min digestion with trypsin solution. The digestion process was promptly halted by the addition of a complete culture medium supplemented with serum. Subsequently, the cells were centrifuged, and the supernatant was removed. The harvested cells were resuspended in a medium containing 10 μmol/L of the CM-H₂DCFDA probe (1:1000 dilution, Beyotime, Shanghai, China), processing for 45 min. Subsequently, the cells were washed and analyzed using a NovoCyte D3000 flow cytometer (Agilent, USA). The quantitative analysis and graphical representation of the findings were conducted utilizing NovoExpress software (Agilent, USA).
Real-Time Quantitative RT-PCR Analysis
BMMs should be grown in a 6-well plate. Following cell adhesion, KR (0, 5, 10, and 20 μM) was introduced into the osteoclast induction medium, to trigger the differentiation of osteoclasts. When the positive control group (RANKL + and KR-) showed big multinucleated osteoclasts under a microscope after 5–7 days. Subsequently, the cells were subjected to stimulation with LPS for 24 h. Total RNA extraction was performed utilizing TRIZOL (Ambion, USA), followed by cDNA synthesis conducted with the ALL-in-one First-Strand Synthesis MasterMix kit (Yeasen, Shanghai, China). The cDNA samples were then analyzed using ChamQ Blue Universal SYBR qPCR Master Mix (Novizan, Nanjing, China) for quantitative real-time PCR (qRT-PCR). The amplification protocol included an initial denaturation step at 95 °C for 2 min, followed by 40 cycles consisting of 15 s at 95 °C for denaturation and 15–30 s at 60 °C for annealing and extension. The expression levels of key inflammatory genes, genes associated with the reactive oxygen species (ROS) oxidative stress pathway (NOX1, Keap1, Nrf2, HO-1, CAT), as well as transcription factors that facilitate osteoclast differentiation (Nfatc1, c-Fos) and their corresponding downstream osteoclast markers (Ctsk, MMP9, TRAP, Acp5) were evaluated using the Bio-Rad CFX Duet (Bio-Rad, USA). The specific sequences for each primer are detailed in Supplement Table 1.
Western Blotting
BMMs were cultured in 6-well plates at a density of 5 × 10⁵ cells per well to investigate the influence of varying concentrations of KR on osteoclast differentiation and oxidative stress levels. In the standard protocol for inducing osteoclast differentiation, the positive control group received treatment with RANKL (50 ng/mL) exclusively, while the experimental groups were administered RANKL in conjunction with different concentrations of KR (0, 5, 10, and 20 μM). To assess whether KR exerts an inhibitory effect on osteoclast differentiation through the PI3K/AKT/GSK-3β signaling pathway, the experimental groups were treated with RANKL and KR at intervals of 0, 5, 10, 20, 30, and 60 min. Protein samples were subsequently extracted at the specified time points from both the control group (RANKL + and KR-) and the experimental group (RANKL + and KR at 20 μM). With the aid of a BCA reagent kit (Solarbio, Beijing, China), the protein concentrations were determined and appropriately normalized. After adjusting for total protein amounts of 20 μg and 30 μg for loading, a stacking gel was subjected to a constant voltage of 90 V for 40 min, followed by a separating gel run at 150 V for 30 min. The proteins were subsequently transferred to a methanol-activated PVDF membrane (400 mA for 40 min). Following the blocking of the protein, the appropriate primary antibody was added to the sealed container and incubated at 4 °C overnight. The next day, the secondary antibody was incubated at room temperature for one hour. Following membrane washing. Making Use of ChemiDoc TM Using ImageJ software, the XRS + system (Bio-Rad, Hercules, USA) takes pictures and analyzes them in grayscale. Use GraphPad Prism (v9.0.0, California, USA) to perform quantitative statistical analysis.
Packaging and Transfection of Lentivirus
Design shRNA interference fragments targeting Mouse Cat and construct these fragments into a viral vector using molecular biology techniques. The virus is purchased from OBiO Technology (Shanghai, China). Insert the pSLenti-U6-shRNA-CMV-mCherry-F2A-Puro-WPRE interference vector with the shRNA sequence to be constructed. Infect RAW264.7 cells with the vector at the optimal multiplicity of infection (MOI), which was determined to be 60 from preliminary experiments. After 72 h, prepare a working solution of puromycin at the appropriate concentration according to the reagent instructions and incorporate it into the culture medium to facilitate the selection of cell lines that have been stably transfected.
Molecular Docking of KR with CAT
The RCSB PDB database provided the crystal structure of the CAT protein. Protein crystals and ligand compound KR were pre-processed using Schrödinger's software to predict the optimal binding site and wrapped to obtain the active site of CAT protein. The best precision XP docking was utilized to molecularly dock the processed ligand compound KR with the active site of CAT protein. These active sites were then subjected to MM-GBSA. These active sites were examined by MM-GBSA, and the lower the binding free energy, the stronger the binding stability of the ligand to the protein.
Establishment of an LPS-Induced Inflammatory Bone Resorption Model in Mouse Cranial Bone
Forty-eight male mice (C57/BL6, SPF, 8 weeks old) were grouped as follows: Vehicle group (120 µL/day of solvent), LPS group (lipopolysaccharide LPS 5 μg / g alternating with 120 µL/day of solvent), low concentration drug treatment group (LPS 5 μg / g alternating with KR 15 μg / g), and high concentration drug treatment group (LPS 5 μg / g alternating with KR 30 μg / g). Iodine was used to disinfect the cranial region after 3% isoflurane was inhaled by the mice to induce anesthesia. The injection point was determined at the midpoint of the line connecting both eyeballs, and the needle was inserted just above the surface of the skull. The drug was slowly injected along the midline of the skull, and the needle was carefully withdrawn while applying pressure with a cotton swab to prevent leakage of the drug. On the 15th day, after inhalation anesthesia, the mice were sacrificed using cervical dislocation. Excess soft tissue around the cranial bone was removed, and the intact cranial bones were preserved in 4% paraformaldehyde. (To prepare a 100 mM stock solution of KR, dissolve the compound in an organic solvent mixture composed of DMSO, PEG300, 5% Tween-80, and 45% normal saline. Dilute the stock solution 1:100 with PBS to obtain a 1 mM KR working solution. For the vehicle control group, use the same organic solvent mixture diluted equivalently with PBS, without the addition of KR.)
Micro-CT Scanning and Analysis
Micro-computed tomography (Micro-CT) was conducted utilizing an NMC-200 system (NEMO) with a scanning resolution of 10 μm to capture and analyze prepared mouse cranial samples. The scanning parameters were set as follows: tube current at 0.09 mA, tube voltage at 90 kV, pixel size of 0.026 mm, scanning precision of 10 μm, and a CT threshold of 1103.19. Data acquisition was conducted using Cruiser software, while 3D image reconstruction was carried out with Recon software (Bruker, Massachusetts, USA) employing the FDK reconstruction algorithm. Quantitative analysis focused on the central area of the skull where fissures appeared. The areas of bone resorption and the ratio of bone volume to total volume (BV/TV) were computed and subsequently compared among the various experimental groups.
Histomorphological Analysis
The calvarial samples obtained underwent a decalcification process utilizing 10% ethylenediaminetetraacetic acid (EDTA) until they softened enough to allow penetration with a needle without resistance. Following this, all tissue specimens were embedded in paraffin and sliced into sections measuring 4–5 μm. These sections underwent staining with hematoxylin and eosin (H&E), TRAcP and were subjected to immunohistochemical staining. Finally, after capturing the stained sections using a high-resolution slide scanner (3DHISTECH Pannoramic MIDI, Hungary), statistical analyses were conducted using ImageJ and GraphPad Prism software. The parameters analyzed included BV/TV values for each sample, the number of TRAcP( +) cells in five random fields of view, the ratio of osteoclast numbers to the overall bone surface length in the designated region of interest (ROI) (Oc.N/BS), and the average optical density across five random fields of view per section (n = 5 per group).
Statistical Analysis
All statistical evaluations were conducted utilizing GraphPad Prism software (version 9.0.0, California, USA). The assessment of data distribution normality was carried out employing the Shapiro–Wilk test. Based on the specifics of the experimental design, one-way analysis of variance (ANOVA), two-way ANOVA, or independent samples t-tests were employed to discern variations among groups. Each experiment was conducted independently a minimum of three times (n = 3 for each group). The data are represented as the mean ± standard deviation (SD). A p-value of less than 0.05 was deemed statistically significant.


留言 (0)