
記住我


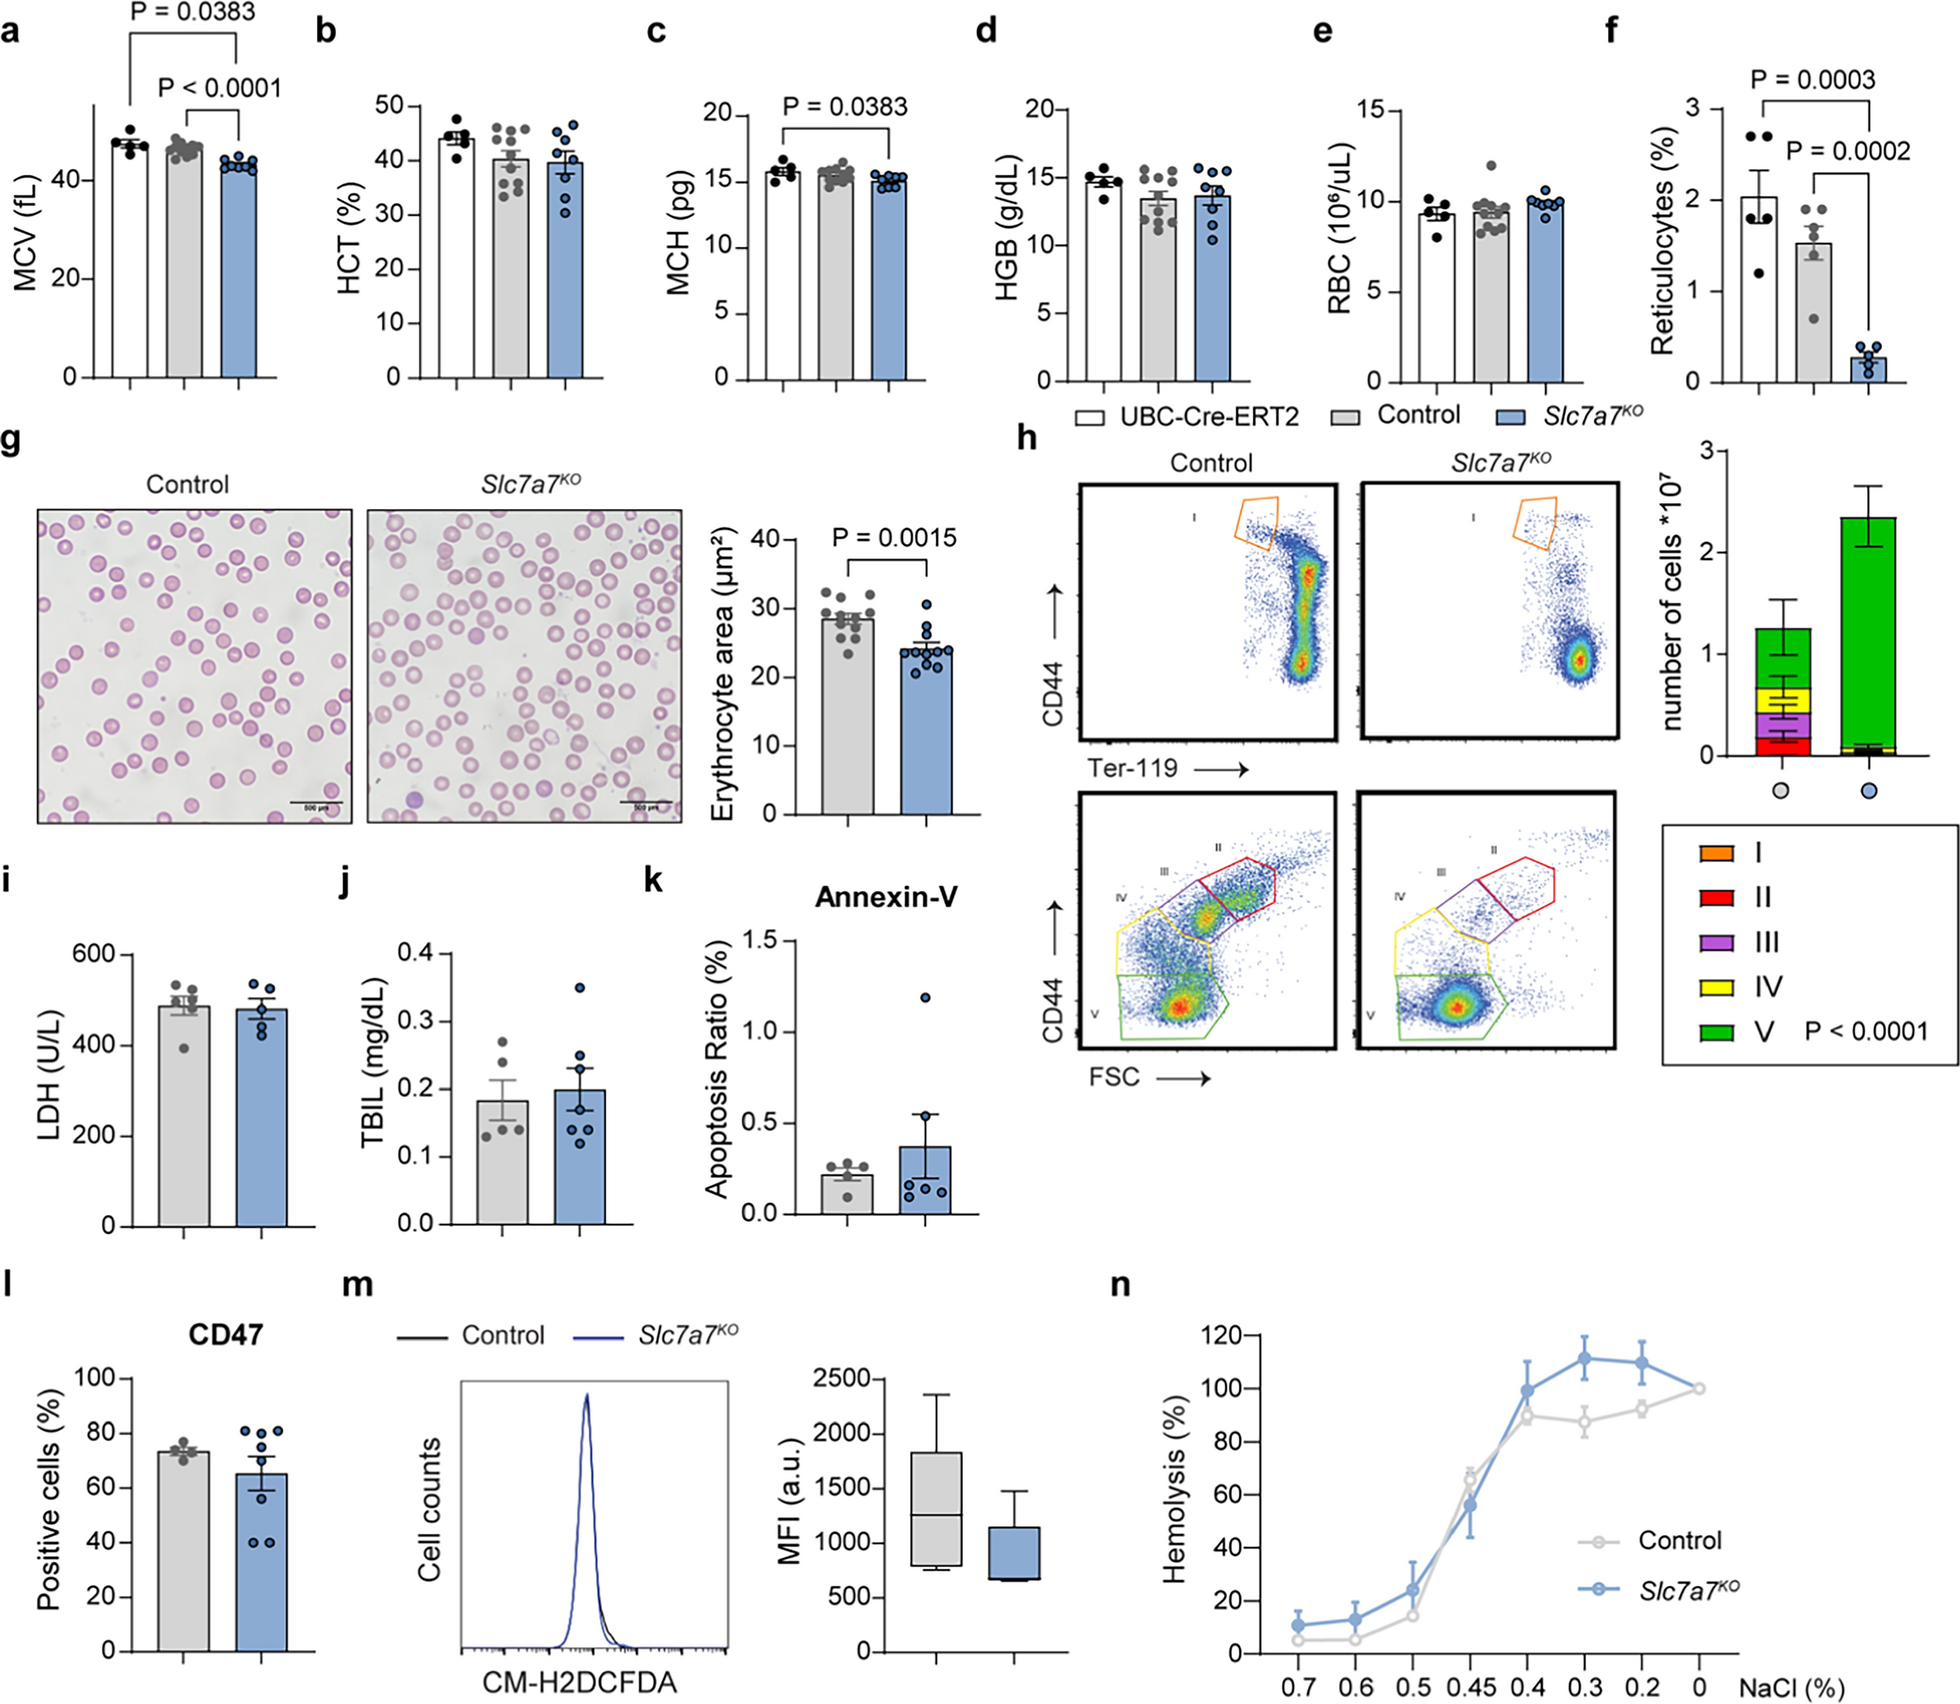

Lysinuric protein intolerance (LPI) in humans has been associated with microcytic and normochromic anemia (Estève et al. 2017; Contreras et al. 2021; Mauhin et al. 2017). To investigate the underlying mechanisms, we examined a mouse model with ubiquitous Slc7a7 ablation (Slc7a7fl/fl and UBC-Cre-ERT2 mice, herein referred to as Slc7a7 knockout mice) (Bodoy and Sotillo 2019) and compared them with control mice (Slc7a7 LoxP/LoxP without the UBC-Cre-ERT2 protein). At 12 weeks of age, the mice were fed a tamoxifen diet for 7 days. The mice were then maintained on a low-protein diet for 20 days, resulting in a 50% survival rate in those lacking Slc7a7 (Bodoy and Sotillo 2019). Blood analysis revealed significantly lower mean corpuscular volume, reduced hematocrit, and a trend toward lower mean corpuscular hemoglobin and erythrocyte hemoglobin content, although red blood cell (RBC) counts remained unchanged (Supplementary Table 1). Owing to high mortality after 20 days, we shortened the low-protein diet duration to 10 days, which resulted in a 100% survival rate. All subsequent experiments were conducted using this adjusted timeframe. Under this adjusted protocol, the mean corpuscular volume reduction was the most prominent change, likely reflecting an early effect of Slc7a7 ablation (Fig. 1a–e). To rule out a possible confounding effect of the tamoxifen diet on the expression of the Cre protein, we also used UBC-Cre-ERT2 mice. Control studies confirmed that these effects were not due to tamoxifen-induced Cre expression (Fig. 1a–f).
Fig. 1
Impaired erythropoiesis and red blood cell fitness in Slc7a7 knockout mice. a–f Complete blood count analysis of only UBC-Cre-ERT2, control and Slc7a7KO mice after 10 days on a low-protein diet. Hemoglobin (Hb), hematocrit (Hct), mean corpuscular hemoglobin (MCH), mean corpuscular volume (MCV), red blood cell count (RBC) and reticulocyte count are shown. g Representative brightfield images from three independent experiments of blood smears from control and Slc7a7KO mice. The quantification of the erythrocyte area is presented in the adjacent bar graph. h Flow cytometry analysis of bone marrow erythropoiesis. Bone marrow cells were labeled with antibodies against CD44 and Ter-119 to identify erythroid progenitors across five maturation stages (I–V). Slc7a7KO mice presented a significant increase in Stage V precursors (P < 0.0001), whereas Stages I–IV were not significantly different, although there is a noticeable trend towards reduction. The data are presented as the means ± SEMs and were analyzed via two-way ANOVA. Representative results from four independent experiments are shown. i Lactate dehydrogenase and j total bilirubin levels in the serum of control and Slc7a7KO mice. k Annexin-V and l CD47 levels in RBCs from control and Slc7a7KO mice. m Mean fluorescence intensity of RBCs from control and Slc7a7KO mice in response to CM-H2DCFDA. n Percentages of hemolysis in control and Slc7a7KO mice in response to increasing concentrations of NaCl (0–0.7%). Unless specified, all the data are presented as the means ± SEMs. Statistical analysis was performed via a two-tailed unpaired Student’s t test. Each data point represents an individual animal
Next, we evaluated erythrocyte size through histological analysis of peripheral blood, which revealed a reduced erythrocyte area in Slc7a7 knockout mice (Fig. 1g), along with fewer circulating reticulocytes (Fig. 1f), indicating possible impaired erythropoiesis (Klei et al. 2017). When erythrocyte maturation markers were examined, we observed that Slc7a7 knockout mice presented a tendency to diminished absolute numbers of erythroblast precursors at stages II-IV (per femur and tibiae). In contrast, mature erythroid precursors (stage V) were significantly enriched (Fig. 1h). This striking defect in early-stage precursors was confirmed via the use of two independent markers, CD44 (Fig. 1h) and Cd71 (Chen et al. 2009), both of which have similar outcomes (Supplementary Fig. 1a). Reduced RBC production is often accompanied by iron accumulation, as erythropoiesis is one of the most iron-demanding processes in organisms (Muckenthaler et al. 2017). Similarly, Slc7a7 knockout mice presented significantly increased iron deposits in the liver and spleen, as observed through Perls Prussian blue staining and direct spectrophotometric analysis of tissue biopsies (Supplementary Fig. 1b-d).
To investigate whether reduced erythropoiesis stemmed from increased RBC destruction, we measured the serum lactate dehydrogenase and total bilirubin levels, both of which were comparable between control and Slc7a7 knockout mice (Fig. 1i-j), ruling out hemolytic anemia. Additionally, Annexin-V and Cd47 analyses of markers associated with RBC clearance (Boas et al. 1998; Burger et al. 2012), representing “eat-me” and “don’t-eat-me” signals, respectively, revealed no significant differences in RBC fitness between genotypes (Fig. 1k-l). Furthermore, reactive oxygen species production was similar across genotypes in freshly isolated RBCs, and no differences were observed in RBC osmotic fragility upon exposure to increasing NaCl concentrations, indicating comparable membrane stability (Fig. 1m-n). Collectively, these findings suggest that the reduced number of RBC precursors in Slc7a7 knockout mice is not attributable to decreased RBC survival or fitness.
In adult mice, erythropoiesis occurs predominantly in the bone marrow. However, in the event of defective erythropoiesis, the spleen can take over erythroid production (Cenariu et al. 2021). Histological analyses indicated that control and Slc7a7 knockout mice presented minimal levels of extramedullary erythropoiesis in the red pulp of the spleen. Even if a decrease in the size and cellularity of the red pulp was detected (Supplementary Fig. 1e), flow cytometry analysis indicated that Slc7a7 knockout mice did not show signs of compensatory erythropoiesis under basal conditions or after acute hemolytic anemia caused by phenylhydrazine (Supplementary Fig. 1f–g).
Loss of Slc7a7 in myeloid and erythroblast cell lineages has a minimal effect on bone marrow erythropoiesisGiven the pronounced erythroid maturation arrest in Slc7a7 knockout mice, we sought to understand the role of Slc7a7 in erythrocyte differentiation and function. We first evaluated the viability and differentiation potential of hematopoietic stem cells from both control and knockout mice via the use of sorted Lin−Sca1+cKit+ cells in colony-forming unit assays. The results revealed no significant differences between genotypes in their capacity to generate erythrocytes or other hematopoietic lineage cells, such as granulocytes or monocytes (Fig. 2a). Next, we determined that in control mice, Slc7a7 is expressed in erythroid precursors and its expression decreases as maturation progresses (Fig. 2b). We then investigated whether Slc7a7 expression was significantly diminished in Slc7a7 knockout mice. Gene expression analysis revealed a dramatic reduction of approximately 90% in Slc7a7 levels in erythrocyte precursors (Ter119+ sorted population) from Slc7a7 knockout mice (Fig. 2c).
Fig. 2
Slc7a7 intrinsic expression does not drive deficient erythropoiesis in Slc7a7 knockout mice. a Colony-forming unit assays of 12,500 Lin−Sca-1+c-Kit+ cells isolated from control and Slc7a7KO mice. The colony types included granulocyte/monocyte (G/M/GM), granulocyte (G), monocyte (M), megakaryocyte/erythroid (Mk/E), and mixed granulocyte-erythroid-monocyte-megakaryocyte (GEMM) CFUs (n = 4). b Real-time PCR analysis of Slc7a7 expression in sorted erythroid progenitors (highlighting stage-specific expression I–IV) from control mice. c Real-time PCR analysis of Slc7a7 expression across erythroid progenitor stages (IV, III, II, I) in control and Slc7a7KO mice. d Schematic representation of bone marrow transplantation in control (CD45.1) and Slc7a7KO (CD45.2) mice. The experimental setup involves transplantation of wild-type cells into Slc7a7KO recipients and vice versa, followed by tamoxifen and a low-protein diet. e Left: Representative dot plots showing the gating strategy for erythroid progenitors in bone marrow, identifying five clusters (I–V). Right: Quantification of erythroid progenitor populations. Clusters I–III showed no significant differences, whereas reductions were observed in Cluster II (P = 0.0027) and Cluster V (P < 0.0001) in Slc7a7KO mice. Representative data from three independent experiments are shown. Statistical analysis was performed via two-way ANOVA. f Complete blood count analysis of the transplanted mice. Slc7a7KO recipients transplanted with wild-type cells (filled circles) and wild-type recipients transplanted with Slc7a7KO cells (empty circles) presented significant differences in the mean corpuscular volume (MCV, P = 0.027) but no significant changes in HGB, RBC, or MCH. j Schematic representation of Slc7a7-specific ablation in myeloid cells via Lyz2Cre (Slc7a7LysM) and erythroid cells via ErGFPCre (Slc7a7EpoR). k Quantification of erythroid precursor populations (Stages I–V) in Slc7a7LysMKO, Slc7a7EpoRKO, and their respective control mice. The data are from n = 7 (Lyz2Cre) and n = 3 (EpoR) mice. Statistical analysis was performed via two-way ANOVA. Unless specified, all the data are presented as the means ± SEMs. Statistical analysis was performed via a two-tailed unpaired Student’s t test. Each data point represents a single animal
The preservation of cell viability and differentiation ex vivo led us to investigate whether the defects observed in the whole-body knockout models stemmed from intrinsic or extrinsic factors. To address this, we employed a bone marrow transplant strategy in which bone marrow cells from wild-type (CD45.1+) mice were transplanted into irradiated Slc7a7 knockout (CD45.2+) mice, while Slc7a7 knockout bone marrow cells (CD45.2+) were transplanted into irradiated wild-type mice (CD45.1+). At 8 weeks posttransplantation, a tamoxifen diet was administered for 1 week, after which the mice were maintained on a low-protein diet for 10 days before blood parameters were examined (Fig. 2d, Supplementary Fig. 2a-b). Slc7a7-deficient hematopoietic cells presented normal erythopoietic differentiation profiles and mean corpuscular volume when they were transplanted into wild-type mice (Fig. 2e–i). These results suggest that deficiency in erythroid precursors is driven by extrinsic factors. In support of this hypothesis, wild-type cells transplanted into the Slc7a7 knockout mice did not improve the erythropoiesis defects.
To further confirm that the erythropoiesis defect arises from an extrinsic factor, we generated two independent knockout mouse models that specifically target Slc7a7 expression in the erythroid and myeloid lineages. The first relies (Slc7a7EpoRKO) on the use of the erythropoietin receptor promoter to drive Cre recombinase expression specifically in erythroid progenitors (ErGFPCre) (Heinrich et al. 2004), whereas the second (Slc7a7LysMKO) uses the lysozyme 2 promoter (Lyz2Cre) (Clausen et al. 1999) and targets the whole myeloid cell lineage, including erythrocytes (Fig. 2j). Analysis of these models revealed a 95% reduction in Slc7a7 transcript levels in the erythroid progenitors of Slc7a7EpoRKO mice (Supplementary Fig. 2c). Furthermore, both Slc7a7 transcript and protein expression in the bone marrow-derived macrophages of Slc7a7LysMKO mice were effectively ablated, confirming the successful knockout of Slc7a7 in myeloid cells (Supplementary 2d and 2f). In line with the results of the bone marrow transplant experiments, Slc7a7EpoRKO and Slc7a7LysMKO mice presented erythroid maturation processes similar to those of control mice (Fig. 2k, Supplementary Fig. 2e). These results collectively suggest that Slc7a7 plays a minimal intrinsic role in red RBC maturation, reinforcing the hypothesis that erythropoiesis defects in Slc7a7 knockout models are driven primarily by extrinsic factors.
Reduced circulating erythropoietin levels are associated with impaired erythropoiesis and diminished kidney functionOur findings indicate that a systemic factor, rather than a deficiency of Slc7a7 in hematopoietic stem cells, underlies the erythroid differentiation defects observed in Slc7a7 whole-body KO mice. Erythropoietin, a crucial hormone synthesized and secreted by the kidneys, is a key regulator of erythrocyte production (Goodnough et al. 2000). Intriguingly, we noted significantly decreased levels of circulating erythropoietin in Slc7a7 whole-body knockout mice (Fig. 3a), accompanied by reduced Epo gene expression and protein levels in the kidney (Fig. 3b-c), which are typically associated with kidney damage and chronic kidney disease (Batchelor et al. 2020; Weiss et al. 2019). Considering the prevalence of kidney disease among LPI patients (Contreras et al. 2021), we hypothesized that Slc7a7 deficiency might lead to kidney dysfunction, resulting in diminished erythropoietin levels and impaired RBC maturation. Confirming this hypothesis, assessments of kidney function in Slc7a7 knockout mice revealed clear signs of early-stage chronic kidney disease, characterized by decreased serum albumin and total protein levels, elevated blood urea nitrogen levels (Fig. 3d–f) and a reduced glomerular filtration rate (Webster et al. 2017), as previously reported (Bodoy and Sotillo 2019).
Fig. 3
Slc7a7 knockout mice exhibit impaired kidney function associated with reduced erythropoietin levels and metabolic dysfunction. a Circulation of erythropoietin serum levels and b kidney erythropoietin content in control and Slc7a7KO mice (blue). c Real-time PCR analysis of Epo transcript levels in total kidneys from control and Slc7a7KO mice. d Serum albumin, e total protein and f blood urea nitrogen from control and Slc7a7KO mice. g Left: Representative images of α-SMA staining (brown) in kidney sections from control and Slc7a7KO mice. Right: Quantification of the positive area of α-SMA staining in control and Slc7a7KO mice. Scale bar: 250 μm. h Real-time RT‒PCR analysis of Acta2 in kidney tissue. i High-resolution respirometry of kidney cortex tissue from control and Slc7a7KO mice. All the data are presented as the means ± SEMs. Statistical analysis was performed via a two-tailed unpaired Student’s t test. Each data point represents an individual animal
We further explored potential causes of reduced erythropoietin production, such as fibrosis, by conducting histological analyses of α-SMA and Sirius Red in kidney sections. Notably, Slc7a7 knockout mice presented increased areas of Sirius Red and α-SMA staining, the latter of which was also confirmed at the mRNA level via Acta 2 transcript analysis (Supplementary Fig. 3a and Fig. 3h). These findings suggest that diminished kidney function is a likely mechanism for reduced erythropoietin production.
Two lines of evidence support major metabolic dysfunction in the kidneys of Slc7a7 knockout mice. First, high-resolution respirometry revealed a substantial decrease in oxygen consumption in the renal cortex of Slc7a7 knockout mice compared with controls (Fig. 3i), despite no changes in the mitochondrial content (Supplementary Fig. 3b). Second, there was a drastic reduction in the expression of key glucose utilization genes (Hk2, Pgk1, and Ldha) (Supplementary Fig. 3c), with an over 90% decrease in Hk2 mRNA levels, which was mirrored at the protein level (Supplementary Fig. 3d). These results suggest significant metabolic dysfunction and functional impairments in the kidneys of Slc7a7 knockout mice.
Slc7a7 deficiency leads to decreased erythropoietin synthesis independent of transcriptional eventsGiven that Slc7a7 is expressed in proximal tubule cells (Bauch et al. 2003) (Fig. 4a) and that renal erythropoietin-producing cells (REPCs and/or Norn cells) are closely located to tubule epithelial cells (Kobayashi et al. 2022), we next wondered whether Slc7a7 is specifically expressed in REPCs. Using publicly available single-cell RNA sequencing datasets (Kragesteen et al. 2023), we verified that Slc7a7 is expressed in REPC (Supplementary Fig. 4a). Next, to explore the potential molecular mechanism underlying reduced erythropoietin production, we investigated the expression of hypoxia-inducible factor-2 (HIF-2), the critical transcription factor involved in Epo transcriptional regulation (Kobayashi et al. 2022). Surprisingly, our analysis revealed similar levels of HIF-2 in histological preparations (Fig. 4b). Hypoxi-probe staining also revealed comparable oxygenation in both groups (Supplementary Fig. 4b), suggesting that decreased erythropoietin production is unlikely to be due to altered HIF-2 levels caused by tissue hypoxia.
Fig. 4
The regulation of erythropoietin production in Slc7a7 knockout mice involves hypoxia-independent pathways. a Immunofluorescence staining of y+LAT1 protein (Red, Slc7a7) revealed positive localization on the basolateral side of proximal convoluted tubules in kidney sections from control and Slc7a7KO mice. DAPI (blue) was used to stain the nuclei. Scale bar: 100 μm. Representative images from 3 independent mice per genotype are shown. b Left: Immunohistochemical staining of HIF-2 (brown) in kidney sections from control and Slc7a7KO mice. Right: Quantification of the HIF-2-positive area revealed no significant differences between genotypes. Scale bar: 250 μm. c Schematic representation of the experimental protocol used to evaluate the effect of dimethyloxalylglycine (DMOG, 500 mg/kg) on erythropoietin production in control and Slc7a7KO mice. The mice were treated with tamoxifen for 7 days followed by a 10-day low-protein diet, with DMOG administered 5 h prior to sacrifice. d Real-time RT‒PCR analysis of Epo gene expression in kidney tissue after DMOG administration. e Serum erythropoietin concentrations in control and Slc7a7KO mice after DMOG treatment. All the data are presented as the means ± SEMs. Statistical analysis was performed via a two-tailed unpaired Student’s t test. Each data point represents a single animal
Interestingly, inhibiting prolyl hydroxylases (Fig. 4c), which control HIF stability under normoxic conditions (Haase 2011), significantly increased Epo expression in the kidneys of knockout mice (Fig. 4d), although circulating erythropoietin levels remained notably lower (Fig. 4e). These findings indicate that potential posttranscriptional modifications affect erythropoietin stability or translation through alterations in kidney function.
Citrulline supplementation rescues defective RBC productionWe next asked whether restoring partially the circulation levels of arginine and hyperammonemia via citrulline treatment, as previously described (Bodoy and Sotillo 2019), could ameliorate kidney dysfunction and consequently rescue the impaired RBC maturation process (Fig. 5a). Notably, normalizing the metabolic milieu improved renal function (Bodoy and Sotillo 2019), as reflected by normalized levels of blood urea nitrogen and circulating albumin, with a trend toward normalized total protein levels in the serum (Fig. 5b–d). Additionally, kidney oxygen consumption (Fig. 5e) and histological analysis via α-SMA and Sirius Red staining were comparable to those of control mice (Fig. 5f, Supplementary Fig. 5a), suggesting that metabolic correction alleviated kidney impairments.
Fig. 5
Metabolic milieu correction by citrulline improves renal function. a Graphical scheme of citrulline treatment in control and Slc7a7KO mice. b Blood urea nitrogen, c albumin and d total protein in serum from control and Slc7a7 knockout mice treated with citrulline. e Mitochondrial respiratory capacity in mitochondrial extracts from the cortex of control and Slc7a7KO mice as previously described. f Left: Representative photographs of α-SMA-stained kidney sections. Right: Quantification of the positive area of α-SMA staining in control and Slc7a7KO mice treated with citrulline. g ELISA of serum erythropoietin in mice treated with citrulline. h Percentages of erythroblast populations in control and Slc7a7KO mice untreated, treated with citrulline or with erythropoietin. The data are presented as the means ± SEMs. Two-way ANOVA. i MCV, j HCT, k MCH, l HGB and m RBC counts in the whole blood of control and Slc7a7KO untreated mice (solid bars), control and Slc7a7KO mice treated with citrulline (polka dots), and control and Slc7a7KO mice treated with erythropoietin (checkered pattern). n Graphical scheme of erythropoietin administration in control and Slc7a7KO mice. Unless specified, all the data are presented as the means ± SEMs. Statistical analysis was performed via a two-tailed unpaired Student’s t test. Each data point represents a single animal
Following citrulline treatment, we evaluated the serum erythropoietin levels and erythrocyte maturation process. The serum erythropoietin levels were similar between the genotypes (Fig. 5g), which was correlated with a similar erythrocyte maturation process (Fig. 5h, Supplementary Fig. 5b). Despite these normalized processes, the mean corpuscular volume and mean corpuscular hemoglobin content were significantly different between control and Slc7a7 knockout mice treated with citrulline (Fig. 5i–m), suggesting that the remaining metabolic derangement (hypolysinemia, residual hyperargininemia and hyperammonemia) might compromise full RBC maturation.
Given that persistent erythropoiesis alterations are potentially linked to underlying kidney dysfunction and reduced erythropoietin levels, as citrulline eases kidney complications and ameliorates the hematological dysfunctions, we investigated whether direct erythropoietin administration could improve RBC differentiation (Fig. 5n). To test this hypothesis, we administered erythropoietin (500 U/kg) daily for three consecutive days, which effectively restored the levels of erythropoietic precursors (Fig. 5h, Supplementary Fig. 5c) and normalized whole blood counts (Fig. 5i–m). Notably, this treatment also mitigated iron overload in the spleen (Supplementary Fig. 5d), indicating effective iron utilization. These findings provide crucial insights into the hematologic disturbances observed in Slc7a7 knockout mice, mirroring the anemia typically observed in chronic kidney disease among patients with LPI. These findings suggest that targeted treatments that restore metabolic balance and directly supplement crucial hormones such as erythropoietin may offer significant therapeutic benefits.
留言 (0)