Rat PCOS model
Female prepuberal Sprague–Dawley rats (three-week-old) were purchased from Pengyue (Jinan, China). All rats were maintained under controlled conditions at an ambient temperature of 22–24 °C with 65 ± 5% humidity and a 12 h light/dark cycle for 7 days to acclimate to the environment. The experimental protocol of our study was performed in accordance with the Guide for the Care and Use of Laboratory Animals and approved by Affiliated Hospital of Shandong University of Traditional Chinese Medicine (SDSZYY-SZYYCK-YXLLSP-099).
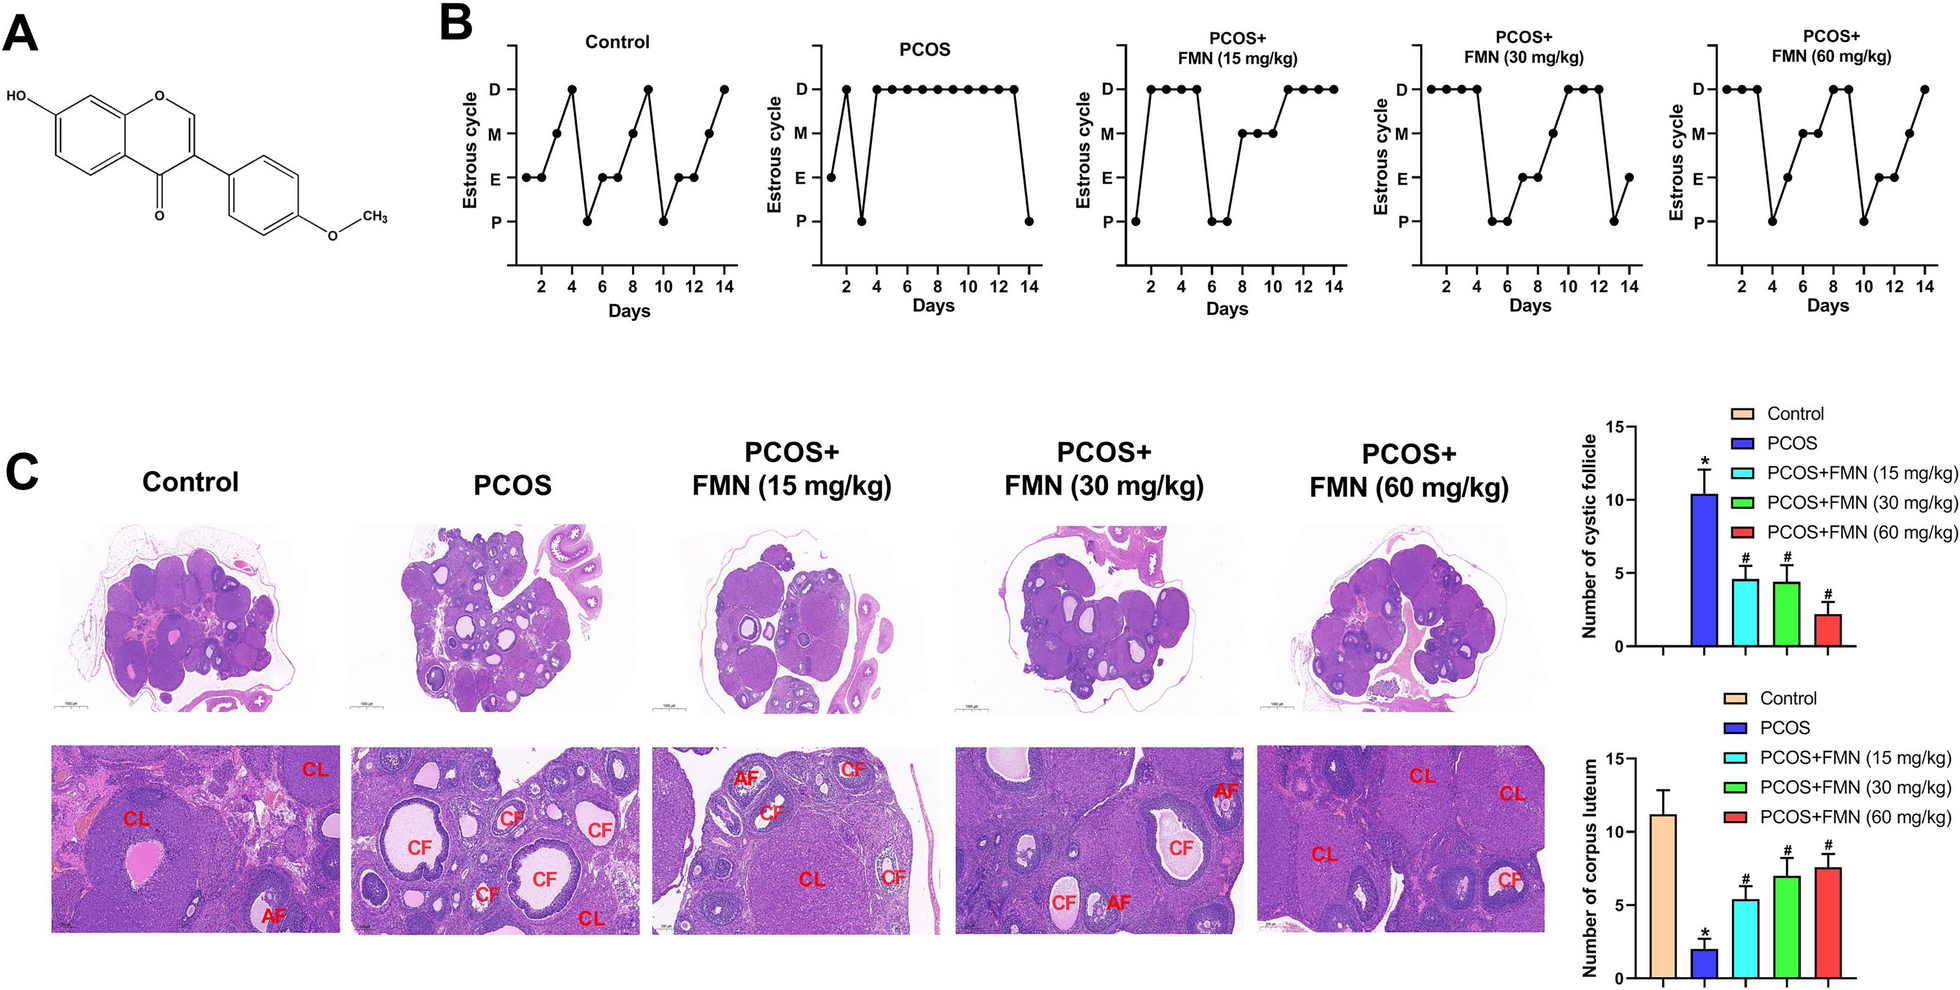
Fifty rats were randomly assigned into five groups of 10 rats each: Control, PCOS, PCOS + FMN (15 mg/kg), PCOS + FMN (30 mg/kg), and PCOS + FMN (60 mg/kg). Rats subcutaneously injected with DHEA (60 mg/kg/day) for consecutive 21 days were assigned to the PCOS group, while those administered sesame oil were designated as the control group. After 21 days of DHEA treatment, FMN (15, 30 and 60 mg/kg) (Liu et al. 2021a) was administrated into the PCOS rats by oral gavage once daily for another 21 days. The control group and the PCOS group were given an equal volume of normal saline for 21 days. Finally, all rats were sacrificed, and ovarian tissue samples were collected. DHEA was procured from Sigma-Aldrich (MO, USA). FMN was supplied by Yuanye (shanghai, China).
Estrous cycle detection
The oestrous cycle is constituted by proestrus (P), estrus (E), metestrus (M), and dioestrus (D). Vaginal smear analysis was performed daily between 9:00 to 10:00 A.M. from day 8 after FMN treatment until the end of the experiments. A sterile cotton swab dipped in normal saline gently scraped the cells on the vagina wall of the rats and evenly smeared them on the slide in a clockwise direction. The cycle stages were determined by visual inspection of cells under a microscope (NIKON, Japan).
Detection of hormone levels
The levels of luteinizing hormone (LH), follicle-stimulating hormone (FSH), testosterone, and estradiol (E2) in serum were analyzed utilizing their responding ELISA kits based on the steps of instructions (Rat LH ELISA kit, SEKR-0091, Solarbio; Rat FSH ELISA kit, SEKR-0090, Solarbio; Testosterone ELISA kit, SEKSM-0003, Solarbio; Rat E2 ELISA kit, SEKR-0107, Solarbio).
Insulin resistance assay
Fasting serum insulin (FINS) levels were determined using an insulin ELISA kit (SEKR-0033, Solarbio). Moreover, a blood glucose content assay kit (BC2495, Solarbio) was applied for measuring fasting blood glucose (FBG) level. Subsequently, the homeostasis model assessment of insulin resistance (HOMA-IR) was calculated using the formula: HOMA-IR = (FBG × FINS)/22.5.
Histological analysis
Ovarian tissues were fixed in formalin for 24 h, and subsequently embedded by paraffin. Serial paraffin Sects. (4 μm thick) were stained according to the methods of hematoxylin–eosin staining.
For TUNEL staining, 4 μm-thick section was deparaffinized and dehydrated with gradient ethanol, followed by incubation using proteinase K for 20 min. Next, the section was incubated with TUNEL reaction solution at 37 °C for 1 h in darkness. Visualization was performed using 3,3′-diaminobenzidine (DAB, Sigma, USA), and TUNEL-positive cells were imaged under a microscope (NIKON, Japan).
Detection of GSH, SOD and CAT contents
Supernatants from cell culture media and ovarian tissues were collected, and protein concentrations were detected utilizing BCA kit. Glutathione (GSH) content was determined applying a Reduced GSH Content Assay Kit (Solarbio, Beijing, China). Superoxide Dismutase (SOD) and Catalase (CAT) Activity Assay Kits (Solarbio) were utilized for evaluating the activities of SOD and CAT.
RNA extraction and real-time PCR
Total RNA from KGN cells and ovarian tissues was extracted employing TRIzol reagent (Invitrogen, USA). One microgram of RNA was converted to cDNA utilizing a Revert Aid First Strand cDNA Synthesis kit (Thermo Scientific, USA). Then, the expression of indicated genes was quantified by real-time PCR with the UltraSYBR One Step RT-qPCR kit (Cwbio, Jiangsu, China), using β-actin as the endogenous control. The primer sequences were as follows: TNF-α-rat F, GATCGGTCCCAACAAGGAGG, R,
CTTGGTGGTTTGCTACGACG; IL-1β-rat F,
ATAGCAGCTTTCGACAGTGAGG, R, TCTGGACAGCCCAAGTCAAG; IL-6-rat F, AGAGACTTCCAGCCAGTTGC, R, TGCCATTGCACAACTCTTTTC; β-actin-rat F, GCCTTCCTTCCTGGGTATGG, R, AATGCCTGGGTACATGGTGG; TNF-α-human F, GCCCATGTTGTAGCAAACCC, R, GGAGGTTGACCTTGGTCTGG; IL-1β-human F, GCCCTAAACAGATGAAGTGCT, R, GGTGGTCGGAGATTCGTAGC; IL-6-human F, ATGAACTCCTTCTCCACAAGCG, R, TGTTACTCTTGTTACATGTCTCCTT; β-actin-human F, GATTCCTATGTGGGCGACGA, R, AGGTCTCAAACATGATCTGGGT.
Western blotting
Ovarian tissues and KGN cells were lysed using RIPA buffer (Santa Cruz Biotechnology, USA). The protein (25 μg) was denatured and resolved by 10% SDS-PAGE, transferred onto a nitrocellulose membrane, and incubated with primary antibodies including Bcl-2 (1:500, Cat.26593-1-AP, Proteintech, USA), Bax (1:1000, Cat.50599-2-Ig, Proteintech, USA), cleaved caspase 3 (1:500, Cat.#9661, Cell Signaling, USA), NLRP3 (1:500, Cat.ab263899, Abcam, UK), ASC (1:500, Cat.ab309497, Abcam, UK), caspase 1 (1:500, Cat.#83383, Cell Signaling, USA), GAPDH (1:5000, Cat.10494-1-AP, Proteintech, USA) overnight at 4 °C. After washing with PBST three times, the nitrocellulose membrane was incubated with HRP-conjugated anti-rabbit IgG (1:5000,Cat.ab270144, Abcam, UK) at room temperature for 120 min. A t last, protein bands were visualized by the ECL Western Blotting Substrate (Solarbio, Beijing, China).
Cell culture and treatment
Human granulosa cells (KGN) were provided by Procell (Wuhan, China). The cells were grown in DMEM/F12 medium (HuanKai Biology, Guangdong, China) in the presence of 10% fetal bovine serum (Thermo Fisher Scientific, USA) and 1% penicillin/streptomycin (Sigma, USA) in a humidified incubator with 5% CO2 at 37 °C. The KGN cells were subsequently treated with DHT (500 nM, Selleck, USA) for 24 h as a PCOS cell model, as described previously (Ji et al. 2022; Dilaver et al. 2019; Zhou et al. 2020). FMN (12.5, 25, and 50 μmol/L) (Liu et al. 2021a) or Nigericin (a activator of NLRP3, MCE, USA) was administered for 24 h following DHT treatment. The control group and DHT group were given an equal volume of DMSO for 24 h.
Evaluation of cell viability
KGN cell viability was observed utilizing CCK-8 (Beyotime, Shanghai, China). After different treatments, KGN cells were planted into 96-well plates and cultivated for 24 h. Subsequently, cells were incubated with CCK-8 solution (10 µL/well) at room temperature for 1.5 h. Finally, the absorbance at 450 nm was detected and recorded employing a microplate reader.
Cell apoptosis assay
KGN cells were suspended in 100 μL binding buffer. Next, Annexin V-FITC (5 μL, BD Biosciences, USA) and propidium iodide (10 μL, Beyotime, Shanghai, China) were added to cell suspension and the mixture was incubated in darkness for 15 min. Finally, flow cytometry was employed for determining apoptotic rate.
Immunofluorescent staining
Cells were fixed in 70% ethanol for 10 min at room temperature permeabilized with 0.1% Triton-100 in PBS for 20 min. After blocking with 5% bovine serum albumin in PBS, KGN cells were incubated with NLRP3 antibody (1:50, cat.27458-1-AP, Proteintech, USA) for 2 h at room temperature with gentle shaking. Subsequent secondary antibody was applied on the slide for 30 min. Followed by washed in PBS, KGN cells were stained using DAPI in darkness for 5 min. Finally, Slides were examined under a fluorescence microscope (NIKON, Japan).
Bioinformatics analysis
Molecular docking is regarded as a key technique for structure-based research and drug development. FMN molecular structure was downloaded from the PubChem database for the subsequent MOE molecular docking. Moreover, the structure of NLRP3 protein was obtained from the RCSB PDB database and downloaded in PDB format. Next, MOE molecular docking software was used for molecular docking of FMN with NLRP3. In addition, KEGG enrichment analysis was used to explore the enriched pathways of FMN.
Statistical analysis
Data are presented as the mean ± SEM of biological replicates. Statistical analyses were performed using GraphPad Prism 8.0 software. Statistical significance was tested using one-way ANOVA with Tukey’s post hoc test and P values of less than 0.05 were considered significant.


留言 (0)