Obesity-related SAP mouse model establishment
All animal experiments were approved by the Ethical Committee of the Laboratory Animal Center of Sun Yat-sen University (2023000734). Four-week-old male C57BL/6 mice were purchased from Zhuhai BesTest Bio-Tech Co. Ltd (Zhuhai, China). The mice were housed in a standard laboratory environment with a temperature of 22 ± 2 ℃, humidity of ± 10%, and a light/dark cycle of 12 h. Mice were fed a regular diet (10 kcal% fat) or a high-fat diet (60 kcal% fat, Ready Biotechnology, Shenzhen, China) with sufficient water for 16 weeks. To further induction of SAP in obese mice, their body weight needed to be at least 30% heavier than that of mice fed a regular diet. SAP was induced using caerulein (CAE) (MedChemExpress, California, USA) and lipopolysaccharide (LPS) (Biosharp, Hebei, China). The CAE and LPS were dissolved in sterile saline and kept in an icebox. Mice received intraperitoneal injections of 50 µg/kg/h CAE, administered a total of 7 times. Following the last CAE injection, 10 mg/kg LPS was immediately administered. The control group was administered saline based on body weight. Blood, pancreatic, and colon tissues were collected 24 h after the induction of pancreatitis.
Measurement of intestinal permeability in vivo
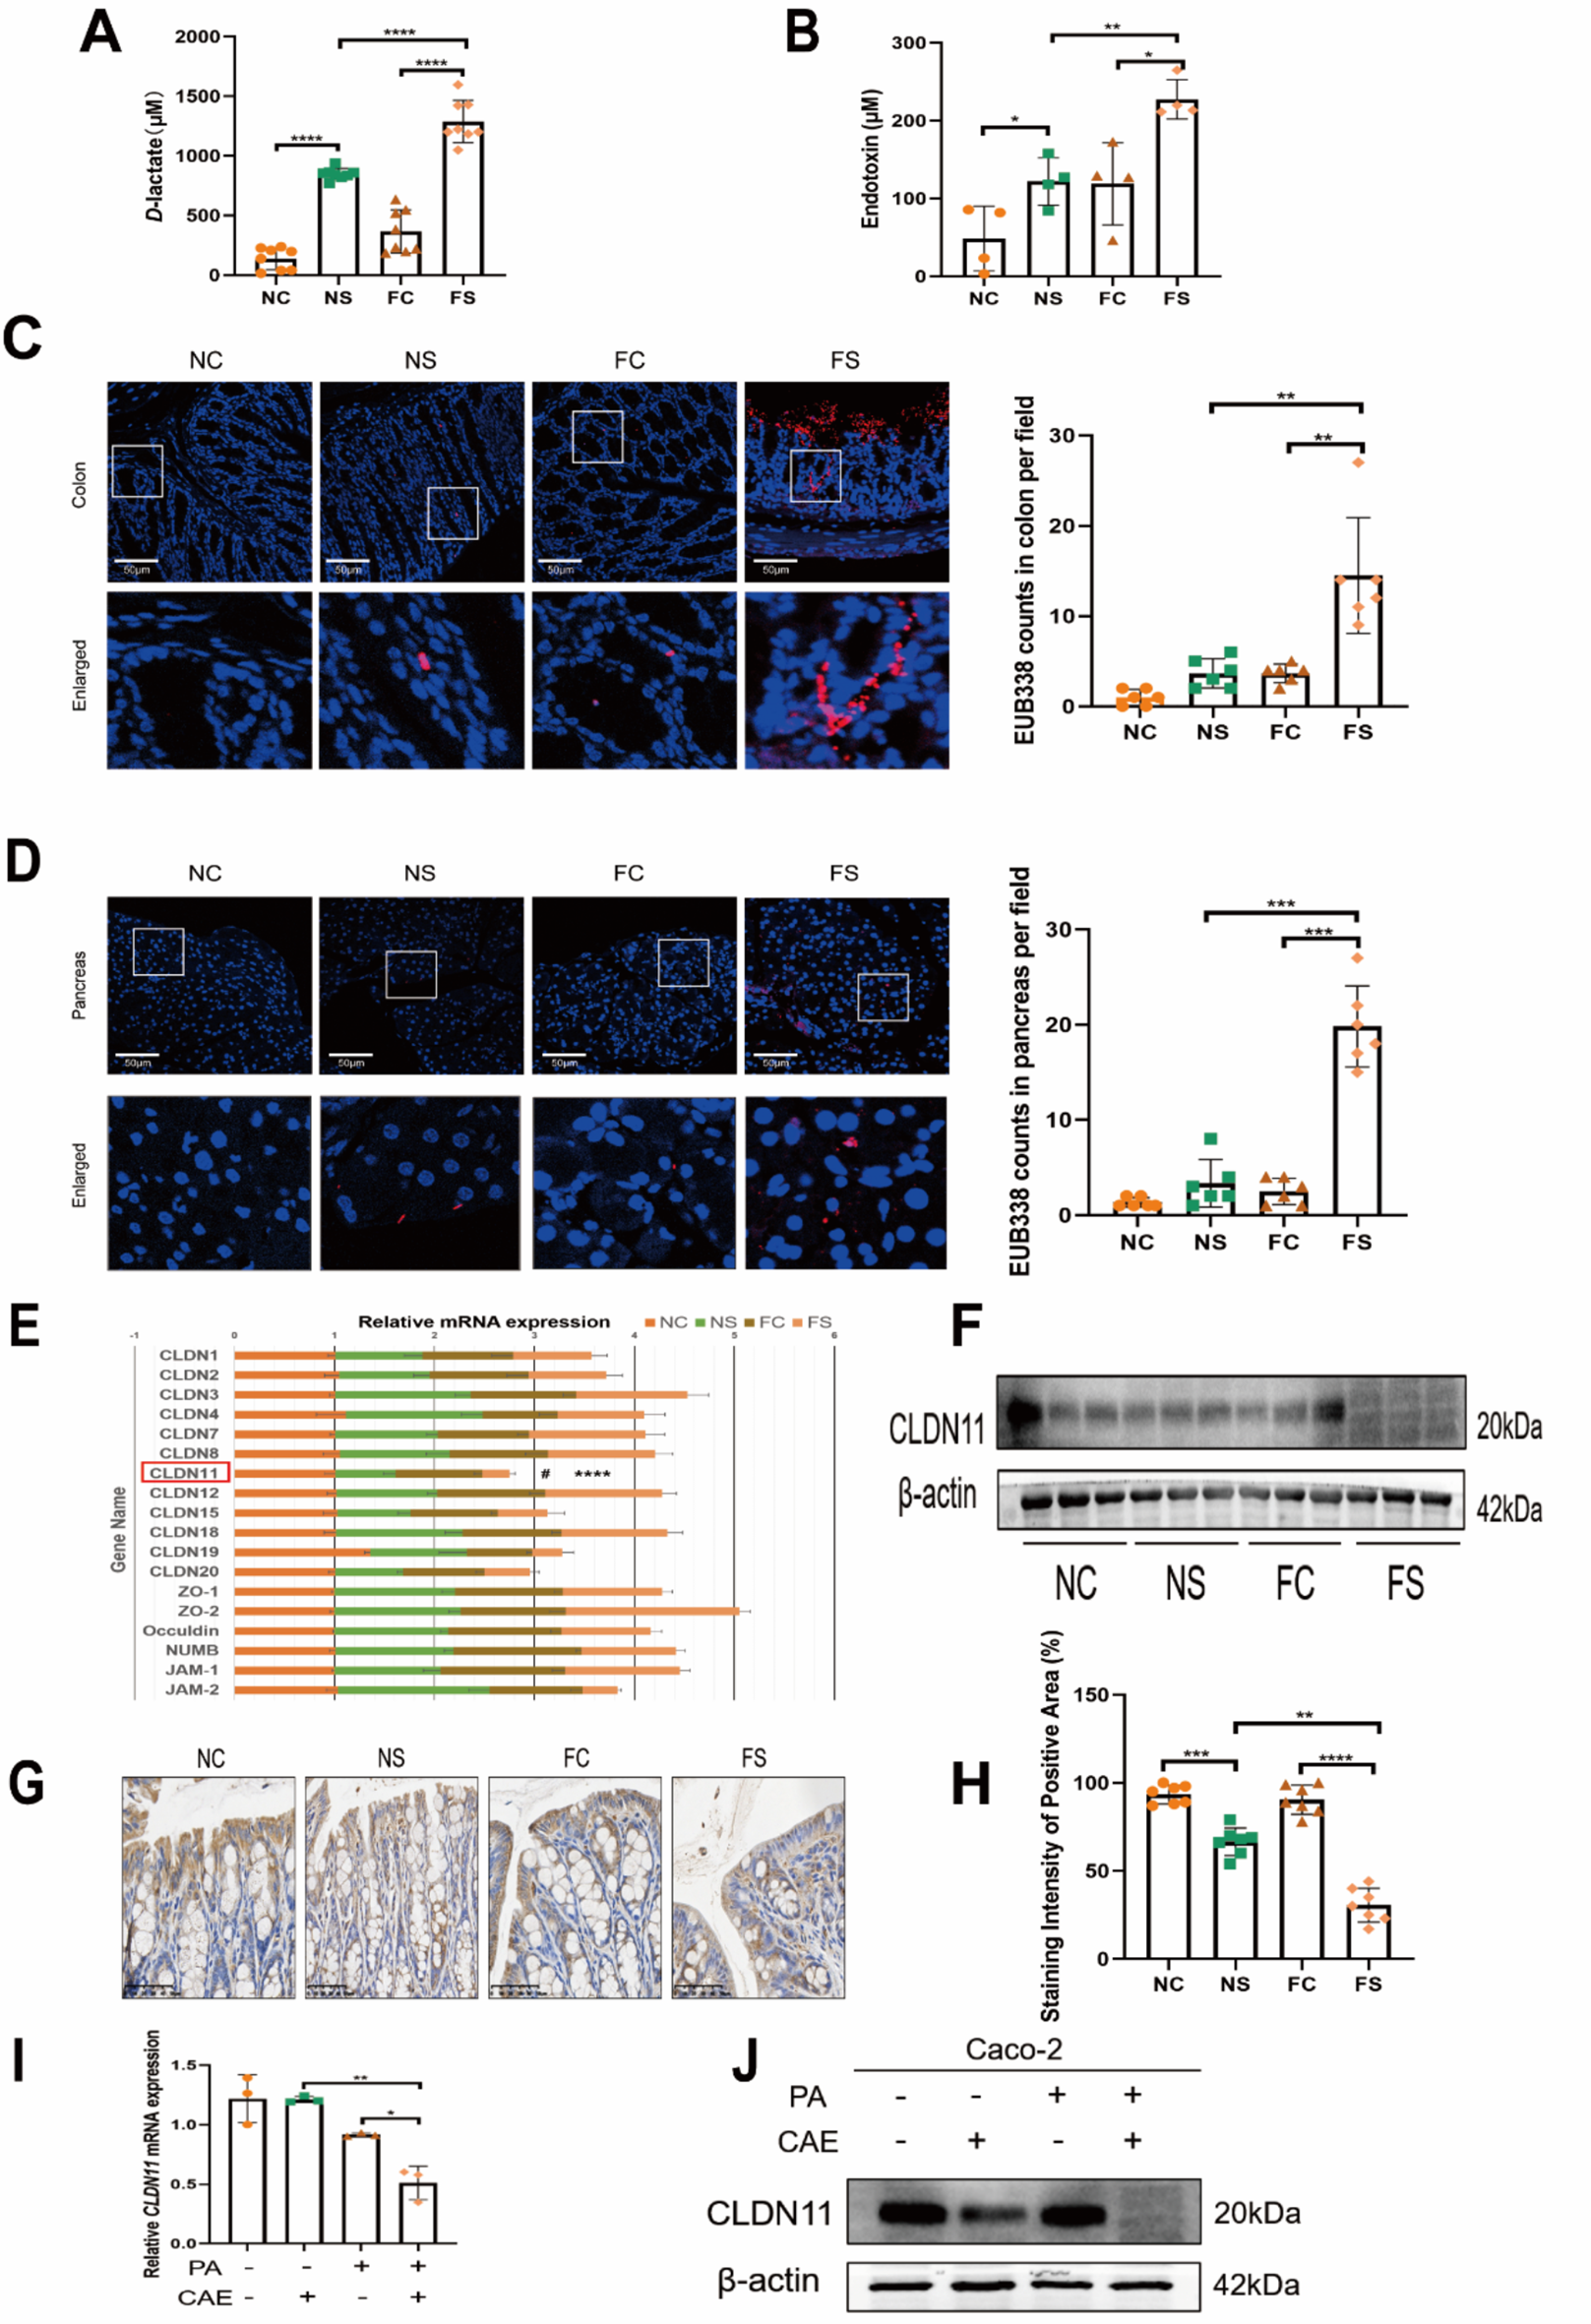
A fully functional intestine acts as a barrier against bacterial metabolites such as D-lactate and endotoxins, preventing them from entering the bloodstream. The presence of these metabolites in the bloodstream is indicative of increased intestinal permeability. Therefore, D-lactate and endotoxin were used to detect intestinal permeability according to the manufacturer’s protocols (AAT Bioquest, California, USA).
Bacterial translocation
Fluorescence in situ hybridization was used to determine bacterial translocation. Pancreas and colon tissue sections were dewaxed (56 ℃ 30 min; xylene three times, 5 min each), dehydrated (70%, 80%, 90%, and 100% ethanol, 5 min each), and air dried. Pre-hybridization solution was applied to the tissue sections and incubated at 37 ℃ for 30 min. The bacterial universal probe (EUB338: 5’-Cy3-GCTGCCTCCCGTAGGAGT-3’ [Mei et al. 2022]) was mixed with a hybridization solution in a 1:39 ratio to prepare the hybridization reaction solution. Tissue slices were then added the hybridization reaction solution, denatured at 73 ℃ for 8 min, and then incubated at 37 ℃ overnight in a hybrid oven (Advanced Cell Diagnostics, California, USA). A laser confocal microscope (Olympus, Tokyo, Japan) was used to capture the images.
Quantitative real-time polymerase chain reaction (qPCR)
Total RNA was extracted from tissues and cultured cells using RNA extraction reagent (Accurate, Changsha, China). RNA concentration was measured using a Nanodrop spectrophotometer (Thermo Scientific, Massachusetts, USA). RNA was reverse transcribed into cDNA according to the manufacturer’s protocol. Quantitative PCR was performed to examine gene expression using a LightCycler 480 fluorescence qPCR machine (Thermo Scientific). β-actin was used as internal references; primer sequences of target genes and β-actin are listed in Supplemental Table S1.
Western blotting (WB)
Total protein was extracted from tissues and cultured cells using a cell lysis buffer (Beyotime, Shanghai, China) and a protease inhibitor cocktail (Thermo Scientific). The protein concentration was measured using a bicinchoninic acid protein assay (Thermo Scientific). Proteins were then electrophoresed on 12.5% sodium dodecyl sulfate-polyacrylamide gel electrophoresis and transferred onto polyvinylidene fluoride membranes. The membranes were blocked with 5% skim milk and incubated overnight with primary antibodies at 4 ℃. Antibodies are listed in Supplemental Table S2. Subsequently, the membranes were washed with Tris-buffered saline containing Tween 20 and incubated with horseradish peroxidase-conjugated anti-rabbit/mouse IgG antibodies for 1 h. Protein bands were visualized using a chemiluminescence imaging system (Thermo Scientific). Protein levels were normalized to β-actin as an internal reference.
Immunohistochemistry (IHC) and immunofluorescence (IF)
For IHC staining, colon tissue sections were dewaxed (56 ℃ for 30 min; xylene three times, 5 min each), hydrated (100%, 95%, and 75% ethanol, 5 min each), and washed with double distilled water 3 times. Based on the primary antibodies’ instructions, appropriate antigen retrieval solutions (Tris-ethylenediaminetetraacetic acid or citrate sodium) were used. Endogenous peroxidase activity was blocked. The primary antibodies were incubated overnight at 4 ℃, and anti-species secondary antibodies were incubated for 30 min. Finally, the slices were stained with a hematoxylin solution.
For double IF staining, sections were incubated with primary antibodies overnight at 4 ℃, followed by specific fluorescence-conjugated secondary antibodies. Antibodies are listed in Supplemental Table S2.
Cell culture and co-culture cell system
The human colon adenocarcinoma cell line Caco-2 and human pancreatic carcinoma cell line PANC-1 were purchased from the American Type Culture Collection (ATCC, Virginia, USA). The Caco-2 and PANC-1 cells were cultured in Dulbecco’s modified Eagle’s medium with 10% fetal calf serum and placed in a 37 ℃, 5% CO2 incubator (Thermo Scientific).
A Caco-2 and PANC-1 co-culture system was established using a 0.4 μm polyester transwell chamber and a matching 6-well plate. The PANC-1 cells with 10 nM CAE and 0.5 mM palmitic acid (PA) (Sigma-Aldrich, Missouri, USA) were incubated in the co-culture system with Caco-2 cells. The control group was incubated with equal amounts of saline and fatty acid-free bovine serum albumin.
Stable Caco-2 cell lines establishment
To construct CLDN11 and IGF2BP3 overexpression (OE) plasmids, the coding sequences of human CLDN11 and IGF2BP3 were amplified and cloned into the pLVX-puro lentivirus vector (#118692, Addgene, Massachusetts, USA). An empty vector served as a control. To construct CLDN11, IGF2BP3, methyltransferase like protein 3 (METTL3), and methyltransferase like protein 14 (METTL14) knockdown plasmids, short hairpin RNAs were cloned into a pLKD-puro lentivirus vector (#8453, Addgene). A control short hairpin RNA was also used. The short hairpin RNA sequences are listed in Supplemental Table S3. According to the manufacturer’s protocols, the plasmids were transfected into HEK293T cells using Lipofectamine™ 3000 (Invitrogen, California, USA). After 48 h of transfection, the lentivirus supernatant was collected, filtered using 0.22 μm filters (Millipore, Massachusetts, USA), and used to transfect Caco-2 cells. The transfected cells were selected with 10 µg/mL puromycin (Solarbio, Beijing, China) for 1 week.
Transepithelial resistance (TER) and fluorescein isothiocyanate-dextran 4 kDa (FD4) permeability assessment
TER was performed to assess paracellular permeability in vitro. Caco-2 cells were seeded in the upper chamber of a 6-well Transwell chamber at a density of 5 × 10⁴ cells per well. Millicell ERS-2 (Millipore) was used to perform the TER assessment. A Caco-2 cell monolayer model with TER ≥ 200Ω × cm2 was considered successfully established.
FD4 (Sigma-Aldrich) was used to assess the permeability of the Caco-2 cell monolayer. When the Caco-2 cell monolayer model matured, 1 mL Opti-MEM (Gibco, California, USA) containing FD4 (2 mg/mL) was added to the upper chamber and 2 mL Opti-MEM to the lower chamber. The fluorescence intensity in the lower chamber was measured using a spectrophotometer (PerkinElmer).
Adeno-associated virus9 (AAV9) construction and injection
The exogenous gene CLDN11 was cloned into an AAV9 vector. The recombinant plasmid carrying the CLDN11 gene, along with the helper plasmids Ad Helper Vector and pAAV-rep/capVector, were co-transfected into HEK293T packaging cells. After 72 h of transfection, the supernatant and cell pellets were collected separately. The virus in the culture supernatant was precipitated using PEG8000, and the virus in the cell pellet was collected after cell lysis. The virus obtained from both the cell pellet and the supernatant was pooled together. Virus purification was performed using iodixanol density gradient centrifugation. After purification, the collected viral solution was further concentrated by ultrafiltration. The viral titer was determined by qPCR, the virus specificity was confirmed by PCR, and the viral purity was assessed using silver staining. The successfully constructed AAV was properly stored in a -80 °C freezer until use. During the establishment of the obesity model and the 2 to 3 weeks prior to the induction of pancreatitis, 9 × 10¹¹ physical particles of AAV9 was administered via tail vein injection into the mice. After injection, the mice were housed in standard animal experimental facilities.
Detection of biochemical indicators and pro-inflammatory cytokines
According to the manufacturer’s protocols (Jiangsu Meimian Industrial Co., Ltd), mice bloods were processed into serum after centrifugation. Serum was then used to detect biochemical indicators (AMY [amylase], TG [triglyceride], and TC [total cholesterol]) and pro-inflammatory cytokines (TNF-α, interleukin-6 [IL-6], interleukin-1β [IL-1β], and interferon-γ [IFN-γ]). Pancreatic samples were used to examine myeloperoxidase (MPO) activities, which were normalized to protein content.
Histopathological assessment
Pancreas and colon tissues fixed with 4% paraformaldehyde were embedded into paraffin blocks and sectioned into 4 μm thick sections for hematoxylin and eosin staining. Interstitial edema, acinar necrosis, bleeding, fat necrosis, and inflammatory cell infiltration in the pancreatic tissue were scored based on the scoring system for experimental acute pancreatitis (Schmidt et al. 1992).
Prediction of protein-CLDN11 mRNA pairs
The protein-CLDN11 mRNA pairs were predicted using catRAPID (http://service.tartaglialab.com/page/catrapid_group). The model structure of IGF2BP3 protein was downloaded from the Uniprot database (https://www.uniprot.org), and the mRNA sequence of CLDN11 was acquired from the PubMed database (http://pubmed.nubi.nlm.nih.gov). We employed the FASTA sequence of Rdkit for peptide-based modeling, the Experimental-Torsion Basic Knowledge Distance Geometry algorithm for conformational search, MMFF94 for structure optimization, and Hdock for global search and hybrid strategy to dock molecules. Finally, PyMOL and LigPlot 2.1 were utilized for visualization.
Transfection of IGF2BP3 small interfering RNA (siRNA)
IGF2BP3 siRNA and control siRNA dry powder were dissolved in RNase-free water to 20 µmol/L and stored at − 20 ℃. The Caco-2 cells were seeded at a density of 50% in the absence of antibiotics. Transfection complexes were formed using Opti-MEM, Lipofectamine RNAiMAX reagent (Thermo Scientific), and siRNA. Fresh medium was replaced after incubation for 8 h, and interference effects were detected after 72 h. The siRNAs are listed in Supplemental Table S3.
RNA immunoprecipitation (RIP)
The RIP assay was performed according to the manufacturer’s instructions (Bersin Bio, Guangzhou, China). Briefly, at least 2 × 10⁷ Caco-2 cells were harvested and lysed. An IGF2BP3 antibody (2 µg) was added to the cell lysate, rotated overnight at 4 ℃, and immobilized on magnetic beads at 4 ℃ for 1 h. After washings for five times, the beads were treated with proteinase K at 55 ℃ for 1 h. The co-precipitated RNAs were used for qPCR to calculate the relative enrichment.
RNA pulldown assay
The RNA pulldown assay was performed according to the manufacturer’s instructions (Bersin Bio). A biotin-labeled CLDN11 full-length probe was synthesized (Focobio, Guangzhou, China). A positive probe (Focobio), which binds to HuR (an RNA-binding protein commonly expressed in various cells) was used, while a negative probe (Focobio) served as a control. The probes were combined with streptavidin-labeled magnetic beads and mixed with Caco-2 cell lysis buffer for 2 h. The magnetic beads were collected and treated with an elution buffer. The collected proteins were identified by WB.
CLDN11 mRNA stability
To determine the stability of CLDN11 mRNA under the downregulation of IGF2BP3, Caco-2 cells were treated with 10 µg/mL actinomycin D (Abmole Bioscience, Texas, USA) for 0, 3, 6, and 9 h. Samples were collected on time, and RNA extraction and qPCR were performed. The expression of CLDN11 mRNA was calculated and normalized to β-actin.
N6-methyladenosine(m6A) RNA methylation assessment
The m6A RNA methylation was detected according to the manufacturer’s instructions (EpigenTek, NewYork, USA). For this assay, 100 ng of total RNA was bound to assay wells and incubated at 37 ℃ for 90 min. Subsequently, m6A RNA capture antibody, detection antibody, enhancer solution, and fluorescence developer solution were added sequentially. Finally, relative fluorescence was measured and read on a fluorescence microplate reader (PerkinElmer) at 530EX/590EM nm.
Pro-inflammatory cytokines treatment in vitro and anti-TNFα therapy in vivo
The Caco-2 cells were seeded at a density of 3 × 10⁵ cells/well on 6-well plates and treated for TNF-α, IL-6, IL-1β, and IFN-γ for 24 h. Following treatment, the total RNA and proteins were collected from the cells for further analysis. One week before SAP induction, mice were intraperitoneally injected three times with 10 mg/kg infliximab (Meilunbio, Dalian, China) or isotype control IgG (Bio X cell, New Hampshire, USA).
Statistical analysis
All statistical analyses were performed using SPSS Statistics software (version 27.0; IBM, Illinois, USA). A Student’s t-test was used to analyze the differences between the two groups. Data are presented as mean ± standard error of the mean. Statistical graphs were drawn using GraphPad Prism version 10.2 (GraphPad Software, California, USA).
Role of the funding source
Funders of this study did not play any role in the study design, data collection and analyses, or writing.


留言 (0)