
記住我

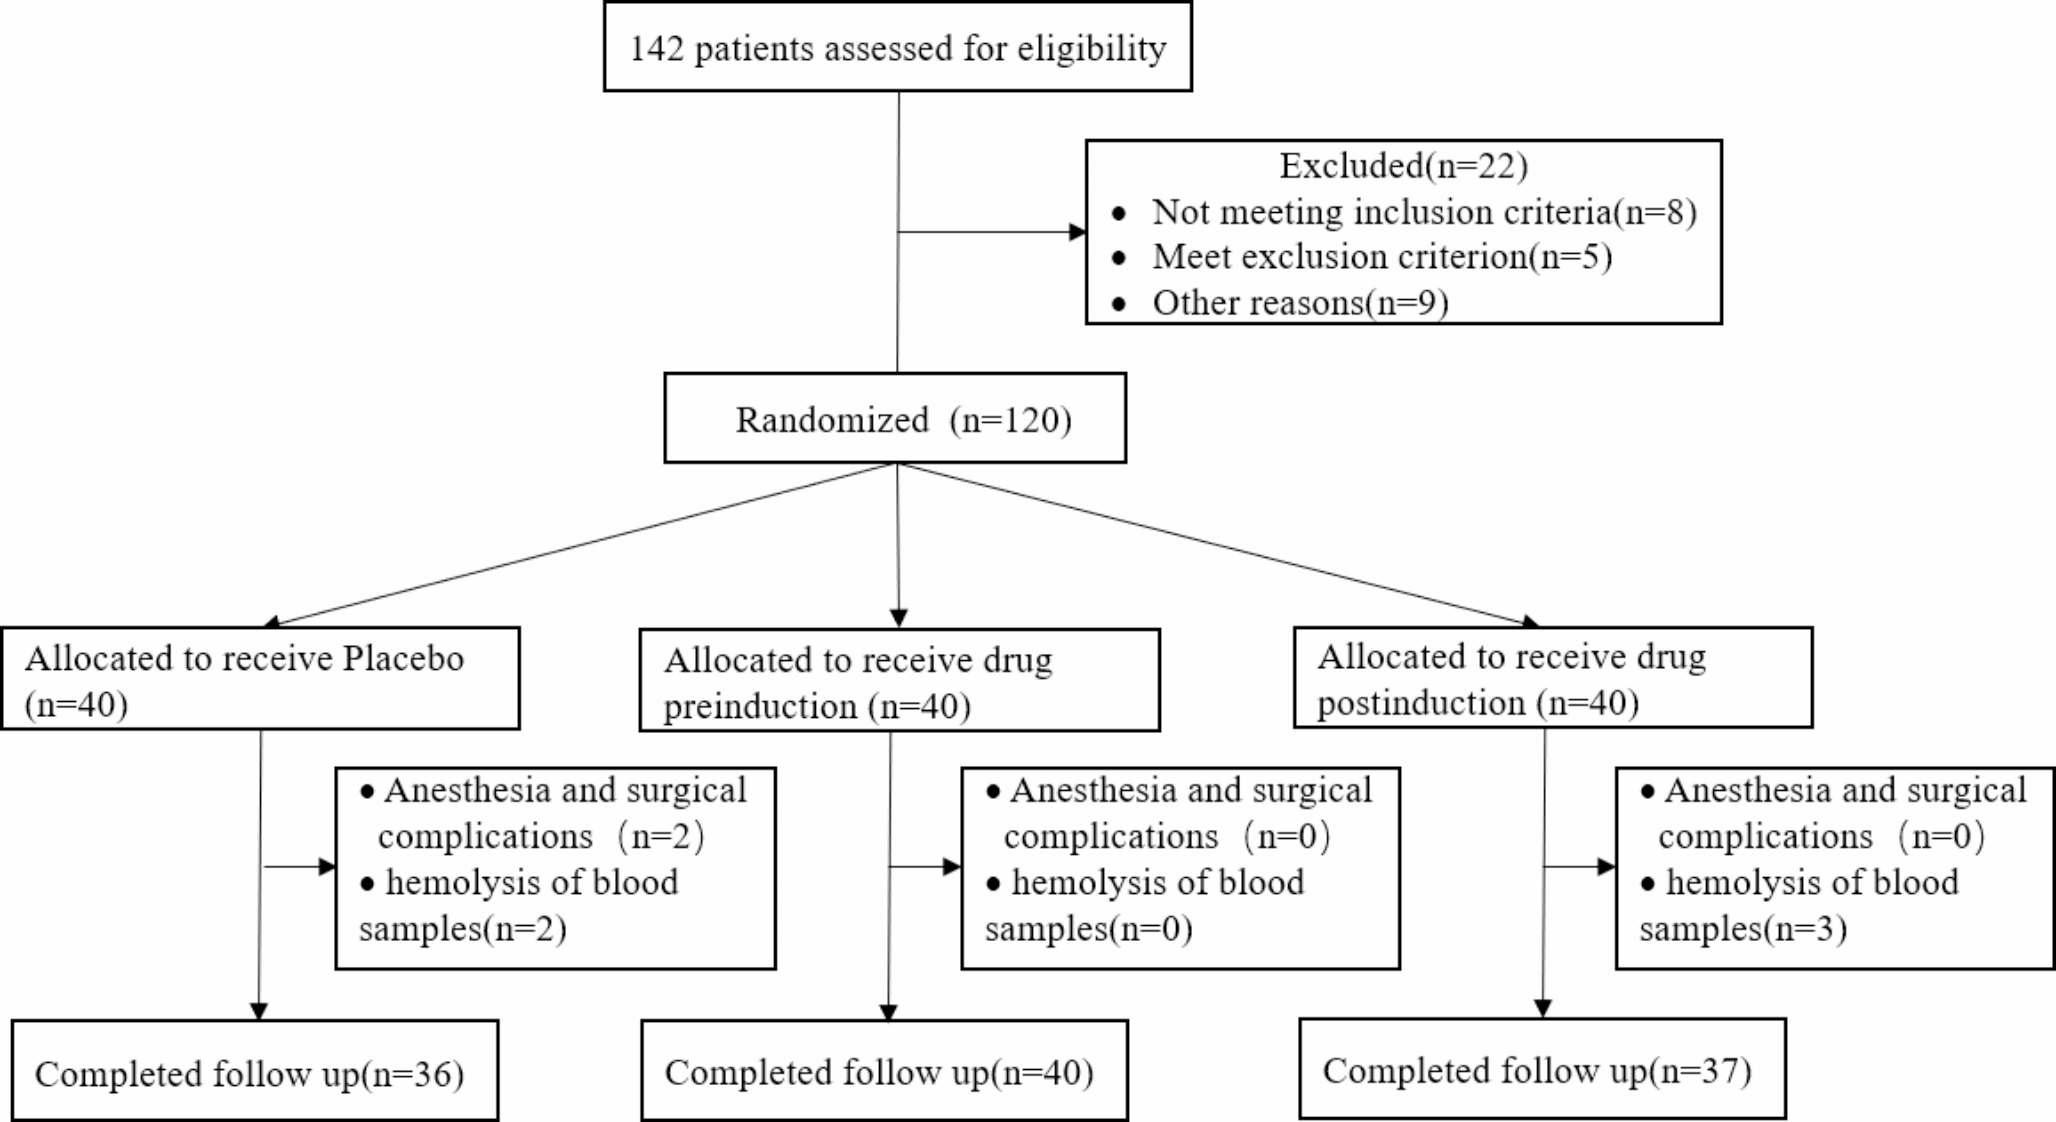


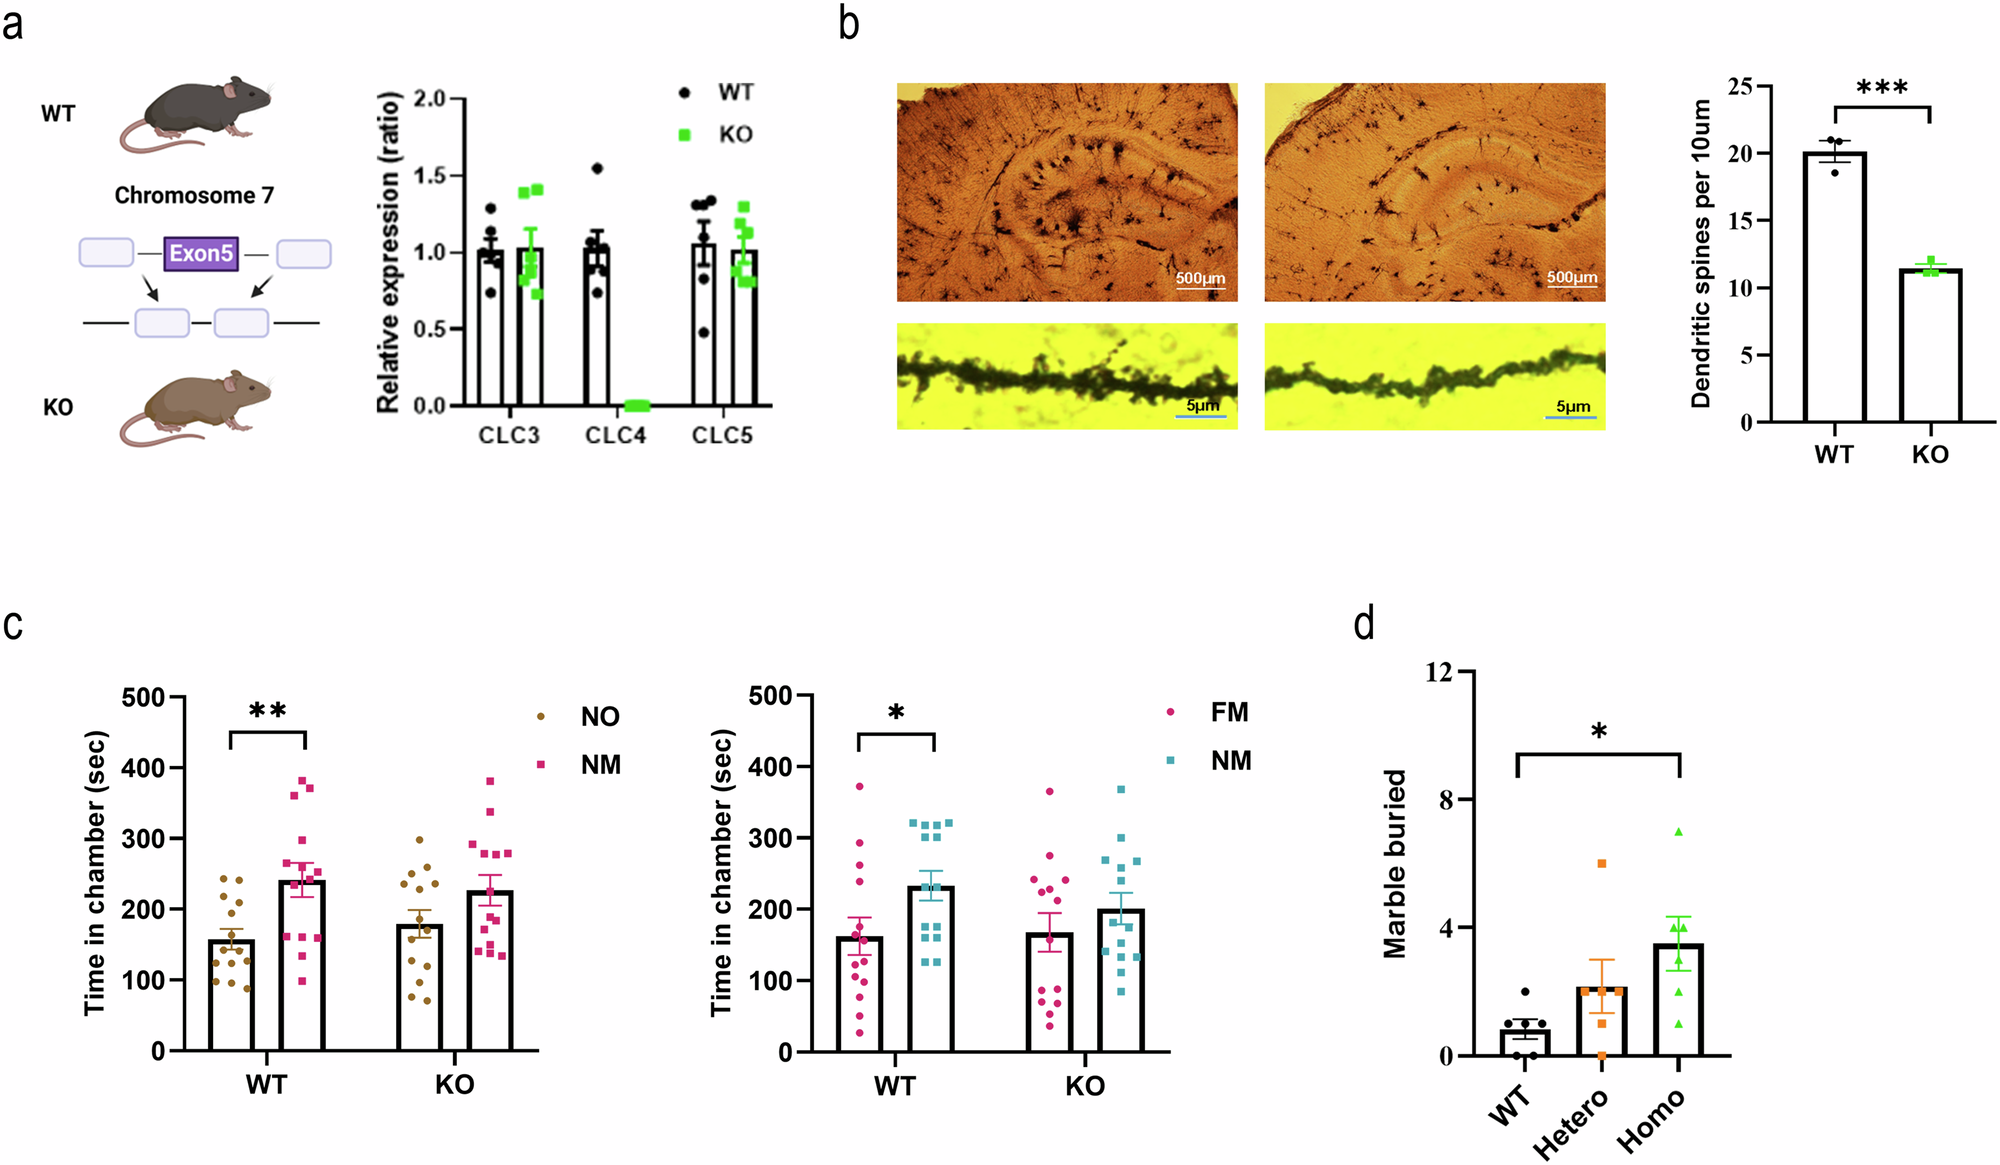
To generate Clcn4 knockout (KO) mice, exon 5 of the Clcn4 gene on chromosome 7 was deleted and we measured the mRNA expression of Clcn3, Clcn4, and Clcn5 by using real-time PCR with specific probes (Fig. 1a). There was no difference in the mRNA expression of Clcn3 (WT, 1.02 ± 0.08; KO, 1.03 ± 0.12, n = 6) and Clcn5 (WT, 1.06 ± 0.14; KO, 1.02 ± 0.09, n = 6) between wild-type (WT) and Clcn4 KO mice, but Clcn4 mRNA expression (WT, 1.03 ± 0.12; KO, 0 ± 0, p < 0.01, n = 6) was completely suppressed in Clcn4 KO mice. The distribution of pyramidal neurons and the number of spines in the hippocampus were examined through Golgi staining (Fig. 1b) at postnatal day (PND) 7. The number of dendritic spines per 10μm was decreased in Clcn4 KO compared to WT (WT, 20.2 ± 0.80; KO, 11.4 ± 0.33, n = 3, p < 0.001; Fig. 1b).
Fig. 1: Generation of Clcn4 KO and analysis of ASD related behavior.
a To generate Clcn4 KO, exon 5 of the Clcn4 gene on chromosome 7 was deleted. Clcn4 mRNA expression mice were completely suppressed in Clcn4 KO when measured by qPCR. Clcn4 KO showed downregulation of Clcn4 but not Clcn3 or Clcn5. b The distribution of pyramidal neurons and the number of spines in the hippocampus were examined through Golgi staining. The number of dendritic spines per 10μm decreased in Clcn4 KO compared to WT. c The three-chamber test was performed at 8 weeks of age. In the social approach, WT mice spent significantly more time in the novel mouse (NM) -containing chamber than in the novel object (NO)-containing chamber (left panel), but there was no difference in the Clcn4 KO group. In social novelty, the WT spent a significantly longer time in the novel mouse (NM)-containing chamber than in the familiar mouse (FM)-containing chamber (right panel), but there was no difference in the Clcn4 KO group. d The marble burying test was performed at 8 weeks of age. Clcn4 KO showed a significant increase in the number of marbles buried, suggesting increased stereotypic behavior. All data were analyzed by t-test and are presented as the mean ± SEM (*p < 0.05, **p < 0.01, ***p < 0.001).
Clcn4 KO showed ASD associated behaviorsAt very early time points, we did not observe a developmental delay in motor ability in Clcn4 KO compared to WT except for a decreasing in score in the surface righting test on PND 7 (Fig. S3). To explore the effects of Clcn4 deficiency on ASD associated behaviors, the three-chamber test (WT, n = 14; KO, n = 14) and the marble burying test (WT, n = 7; KO, heterozygote n = 7, homozygote n = 7) was performed when the mice were 8 weeks of age. The three-chamber test is a method for evaluating social behavior in mouse models of ASD (Fig. 1c). In the social approach phase, WT spent significantly more time in the novel mouse (NM)- containing chamber than in the novel object (NO)-containing chamber (WT, NM 241 ± 24 s, NO 157 ± 14 s; n = 14, p < 0.01), but there was no difference in the Clcn4 KO group (KO, NM 227 ± 22 s, NO 179 ± 20 s; n = 14; Fig. 1c; left panel). Regarding social novelty, the WT mice spent a significantly longer time in the novel mouse (NM)-containing chamber than in the familiar mouse (FM)-containing chamber (WT, NM 233 ± 21 s, FM 162 ± 26 s; n = 14, p = 0.043), but there was no difference in the Clcn4 KO group (KO, NM 201 ± 22 s, FM 168 ± 27 s; n = 14, Fig. 1c; right panel). The results of this experiment indicate that there is a reduction in social interaction in Clcn4 KO compared to WT. The marble burying test is a behavioral method for repetitive behavior. We conducted the marble burying test with 7 animals but decided to present results from only 6 animals in the final data set, as one animal was identified as an outlier and excluded from the analysis. Clcn4 KO showed a significant increase in the number of marbles buried (WT, 0.83 ± 0.3; KO, heterozygote, 2.16 ± 0.83, n = 6, homozygote 3.5 ± 0.84, n = 6, WT vs Homo, p < 0.05), suggesting increased stereotypic behavior (Fig. 1d) [33].
Risperidone reversed behavioral deficits in Clcn4 KO miceRisperidone was utilized to examine the predictive validity of the Clcn4 KO as a model for human ASD. We tested whether risperidone could reverse ASD associated behavior in Clcn4 KO. Risperidone was administered according to a predetermined schedule for 2 weeks at 5 weeks of age and validated by behavioral experiments (Fig. 2a). In Y maze test, the spontaneous alternation was significantly decreased in Clcn4 KO compared with WT, and risperidone treated Clcn4 KO showed a significant improvement in the spontaneous alternation (WT, 60.7 ± 1.8; KO, 47.4 ± 2.4; KO+Ris, 66.1 ± 2.7; n = 17; WT vs KO, p < 0.001; KO vs KO+Ris, p < 0.0001, Fig. 2b). In passive avoidance test, the latency time for dark room avoidance was significantly decreased in Clcn4 KO compared with WT, and risperidone treated Clcn4 KO showed a significant increase in the latency time for dark room avoidance (WT, 138.3 ± 32.6; KO, 15.8 ± 8.7; KO+Ris, 66.2 ± 17.2; n = 5; WT vs KO, p < 0.01; KO vs KO+Ris, p < 0.05, Fig. 2c). In the social approach phase of three chamber test, all three groups (WT, KO, KO+Ris) of mice spent significantly more time in the NM chamber than in the NO chamber (Fig. 2d, right panel). In social novelty, WT tended to spend more time in the NM-containing chamber than in the FM-containing chamber (WT, NM 274 ± 16 s, FM 191 ± 13 s; n = 8, p < 0.01), but there was no difference in the Clcn4 KO group (KO, NM 249 ± 21 s, FM 229 ± 25 s; n = 9). After risperidone treatment, Clcn4 KO spent significantly more time in the NM-containing chamber than in the FM-containing chamber. After risperidone treatment, Clcn4 KO spent significantly more time in the NM-containing chamber than in the FM-containing chamber (KO+Ris, NM 284 ± 21 s, FM 196 ± 17 s; n = 8, p < 0.01, Fig. 2d, left panel). The Clcn4 KO group also showed a significant increase in marble burying behavior, which was decreased after risperidone treatment (WT, 5.8 ± 1.0, n = 10; KO, 9.1 ± 1.2, n = 8; KO+Ris, 6.3 ± 0.5; n = 9; WT vs KO, p < 0.05; KO vs KO+Ris, p < 0.05, Fig. 2e). These results suggest that the effects of Clcn4 KO can be ameliorated by risperidone treatment, adding predictive validity to Clcn4 KO as model for human ASD.
Fig. 2: Risperidone treatment reversed behavioral deficits in Clcn4 KO.
a Risperidone was administered according to a predetermined schedule for 2 weeks. Next, we tested whether the antipsychotic drug risperidone reversed cognitive impairment and ASD associated behavior in Clcn4 KO. b In Y-maze test, the spontaneous alternation was significantly decreased in Clcn4 KO compared with WT, and risperidone treated Clcn4 KO showed a significant improvement in the spontaneous alternation. c In passive avoidance test, the latency time for dark room avoidance was significantly decreased in Clcn4 KO compared with WT, and risperidone treated Clcn4 KO showed a significant improvement in the latency time for dark room avoidance. d In the social approach phase of three chamber test, all three group (WT, KO, KO+Ris) spent significantly more time in the NM chamber than in the NO chamber (left panel). After risperidone treatment, Clcn4 KO spent significantly more time in the NM-containing chamber than in the NO-containing chamber. In social novelty, WT mice tended to spend more time in the NM-containing chamber than in the FM-containing chamber (right panel). After risperidone treatment, Clcn4 KO spent significantly more time in the NM-containing chamber than in the FM-containing chamber. e The Clcn4 KO group showed a significant increase in marble burying behavior, which decreased after risperidone treatment. All data were analyzed by t-test or one-way ANOVA are presented as the mean ± SEM. (*p < 0.05, **p < 0.01, ***p < 0.001, ****p < 0.001).
Clcn4 KD in mNPCs showed downregulation of the neuronal development genesTo explore the effects of Clcn4 deficiency, RNA sequencing was performed on mNPCs. Among 14,208 expressed genes (FPKM > 1) in either WT or Clcn4 KD mNPC, 2446 and 2661 genes were significantly increased and decreased in Clcn4 KD mNPC compared to WT, respectively (Fig. 3a). We then analyzed the gene ontology (GO) terms and KEGG pathways of the differentially expressed genes (DEGs). The GO terms related to trans-synaptic signaling (p = 8.13E-34), the regulation of transmembrane transport (p = 6.31E-17), modulation of chemical synaptic transmission (p = 4.24E-27), neuron projection development (p = 2.99E-31), regulation of neuron projection development (p = 1.16E-21), and regulation of membrane potential (p = 1.34E-19) were significantly decreased expression in Clcn4 KD compared to WT (Fig. 3b). The GO terms related to skeletal muscle development, vascular system development, and cell adhesion were significantly enriched in genes that were increased in Clcn4 KD compared to WT (Fig. 3c).
Fig. 3: Differentially expressed genes (DEGs) in Clcn4 KD mNPCs.
a To explore the effects of Clcn4 deficiency, RNA sequencing was performed on mNPCs. Hierarchical clustering of three WT and KD lines based on differentially expressed RNA transcripts (2.0 FC, nbinomWaldTest test p < 0.01) from DESeq2. The expression level of each gene in a single sample is depicted according to the color scale. Volcano plot of DEGs in KD. The Y-axis displays the -log10 p-value for each gene, while the X-axis displays the log2 fold change for that gene relative to KD. b–f Top 10 enriched GO terms for DEGs. b GO term enrichment analysis for downregulated genes in WT and KD, (c) upregulated genes. d Hierarchical clustering of three KD and KD+Ris lines based on differentially expressed RNA transcripts (2.0 FC, nbinomWaldTest test p < 0.01) from DESeq2. The expression level of each gene in a single sample is depicted according to the color scale. Volcano plot of DEGs in KD. The Y-axis displays the -log10 p-value for each gene, while the X-axis displays the log2 fold change for that gene relative to KD. e GO term enrichment analysis for downregulated genes in KD and KD+Ris, f upregulated genes. Node size represents gen ratio; node color represents -log10 p-value. GO, gene ontology.
In Clcn4 KD versus Clcn4 KD+Ris comparison, 212 and 266 genes significantly increased and decreased in Clcn4 KD+Ris compared to Clcn4 KD (Fig. 3d). The GO terms related to the regulation of vascular permeability (p = 1.35E-04) and the skeletal system development (p = 1.29E-07) were decreased in Clcn4 KD+Ris compared to Clcn4 KD (Fig. 3e). The expression of genes associated with the regulation of potassium ion transmembrane transport (p = 8.71E06), the regulation of membrane potential (p = 3.31E-05), post-translational protein phosphorylation (p = 1.05E-07), and the development of neuronal projections (p = 0.0024) significantly increased in Clcn4 KD+Ris compared to Clcn4 KD (Fig. 3f).
From the gene expression data, we formulated schematic hypothesis of CLCN4 function in the synapse (Fig. S4). We postulated that CLCN4 dysfunction causes aberration in synaptic plasticity through signaling pathways such as MAPK/ERK, which are essential for processes like dendritic spine formation, protein clustering at synapses, and neurotransmitter release.
Expression and phosphorylation of synaptic proteins decreased in Clcn4 KOWe examined the protein expression and phosphorylation of SYNAPSIN 1, PSD95, CREB, ERK in Clcn4 KO. The phosphorylation of SYNAPSIN at Ser9, Ser549, and Ser609 was significantly reduced in the cortex (Ser9: WT, 100 ± 1.5; KO, 61.0 ± 6.1; Ser549: WT, 100 ± 1.2; KO, 68.1 ± 1.2; Ser609: WT, 100 ± 3.0; KO, 60.8 ± 3.0; p < 0.01, p < 0.001) and hippocampus (Ser9: WT, 100 ± 2.8; KO, 40.0 ± 6.7; Ser549: WT, 100 ± 2.8; KO, 51.3 ± 5.5; Ser609: WT, 100 ± 0.6, KO, 54.0 ± 4.9; p < 0.01, p < 0.001) of CLCN4 KO (Fig. 4a).
Fig. 4: Expression and phosphorylation of synaptic proteins is decreased in Clcn4 KO.
To investigate the expression changes of SYNAPSIN 1, PSD95, CREB and ERK along with the phosphorylation of these proteins in Clcn4 KO, the brain tissues were evaluated by immunoblotting. a There was no difference in the expression of SYNAPSIN 1 between Clcn4 KO and WT. The phosphorylation of SYNAPSIN 1 at Ser9, Ser549, and Ser609 was significantly reduced in the cortex and hippocampus in Clcn4 KO compared to WT. b In the cortex of Clcn4 KO, the expression level of PSD95 was decreased, but its phosphorylation level was not changed. However, both the phosphorylation and the expression levels of PSD95 were significantly decreased in the hippocampus of Clcn4 KO. CREB activation was markedly reduced and ERK activity decreased in the cortex and hippocampus in Clcn4 KO compared to WT. c After treatment with risperidone, the levels of p-SYNAPSIN 1 (Ser9), SYNAPSIN 1, p-PSD95, PSD95, CDK5 and β-ACTIN in the cortex of the Clcn4 KO and WT were assessed. The phosphorylation of SYNAPSIN 1 at Ser9 in the cortex was also restored in Clcn4 KO by risperidone administration, and PSD95 phosphorylation was increased in risperidone treated Clcn4 KO compared to WT and untreated Clcn4 KO. Risperidone reversed the reduction in expression of CDK5 and PSD95. All data were analyzed by t-test or one-way ANOVA are presented as the mean ± SEM. (*p < 0.05, **p < 0.01, ***p < 0.001).
In the cortices of Clcn4 KO, the protein expression level of PSD95 was decreased (WT, 100 ± 0.6; KO, 63.7 ± 4.1, p < 0.001), but its phosphorylation level was not changed (WT, 100 ± 1.5; KO, 76.2 ± 9.0). Both the phosphorylation level (WT, 100 ± 2.7; KO, 50.8 ± 2.1; p < 0.001) and the expression level of PSD95 (WT, 100 ± 4.1; KO, 68.0 ± 5.8; p < 0.05) were significantly decreased in the hippocampus of Clcn4 KO. Clcn4 KO exhibited a marked reduction in ERK activity (cortex: WT, 100 ± 1.2; KO, 33.0 ± 4.6; hippocampus: WT, 100 ± 2.9; KO, 56.1 ± 2.6; p < 0.001) and CREB (cortex: WT, 100 ± 6.8; KO, 36.9 ± 4.3, p < 0.01; hippocampus: WT, 100 ± 11.5; KO, 55.7 ± 7.3, p < 0.05) (Fig. 4b).
After treatment with risperidone, the levels of p-SYNAPSIN 1 (Ser9), SYNAPSIN 1, p-PSD95, PSD95, CDK5 and β-ACTIN in the cortex of the Clcn4 KO and WT were assessed (Fig. 4c). The phosphorylation of SYNAPSIN 1 at Ser9 in the cortex was also restored in Clcn4 KO by risperidone administration (WT, 100 ± 0.88; KO, 68.1 ± 5.8; KO+Ris, 110.0 ± 10.0; p < 0.01), and PSD95 phosphorylation was increased in risperidone treated Clcn4 KO compared to WT and untreated Clcn4 KO (WT, 100 ± 5.4; KO, 112 ± 2.5; KO+Ris, 131.6 ± 5.4; p < 0.05). Risperidone reversed the reduction in expression of CDK5 (WT, 100 ± 1.9; KO, 75.8 ± 4.3; KO+Ris, 110.7 ± 6.9; WT vs KO, p < 0.01, KO vs KO+Ris, p < 0.05) and PSD95 (WT, 100 ± 2.2; KO, 77.4 ± 1.8; KO+Ris, 107.5 ± 3.3; p < 0.01).
Clcn4 KO neurons show decreased expression of neuronal cell markers and phosphorylation of synaptic proteinsTo examine the involvement of Clcn4 in neuronal cell viability and morphology, primary cortical neurons from Clcn4 KO pups were harvested and immune-stained with MAP2 (Fig. 5a). In Clcn4 deleted neurons, cell viability decreased by 50% (KO, 51.21 ± 4.54% vs WT, p < 0.001, n = 3) (Fig. 5b). Risperidone (5 and 10 μM) restored the viability of neurons from Clcn4 KO in a dose-dependent manner (KO+Ris 5 μM, 64.25 ± 5.85% vs WT, p < 0.001, KO+Ris 10 μM, 72.07 ± 2.44% vs WT, p < 0.01, n = 3; Fig. 5b). The number of MAP2-positive neurons were decreased in Clcn4 KO cortical neurons but restored after risperidone treatment to WT level (WT, 28.2 ± 1.3; KO, 23.2 ± 1.7; KO+Ris, 27.6 ± 1.6; WT vs. KO p < 0.05; KO vs KO+Ris p < 0.05, n = 14; Fig. 5c). In Sholl analysis, the distance from soma of Clcn4 deleted neurons, was significantly shorter compared to WT, but the length of the dendrites after risperidone treatment was restored to WT level (WT, 120.7 ± 12.47; KO, 57.14 ± 7.944; KO+Ris, 87.86 ± 12.54; WT vs. KO, p < 0.001, KO vs KO+Ris, p < 0.05, n = 14; Fig. 5d, e).
Fig. 5: Risperidone restores protein expression and morphology in Clcn4 KO neuronal cultures.
a Primary cortical neurons from Clcn4 KO pups were harvested and immune-stained with MAP2. b In Clcn4 deleted neurons, cell viability decreased by 50% compared to WT. Five and 10 µM risperidone restored the viability of neurons from Clcn4 KO in a dose-dependent manner. c The number of MAP2-positive neurons decreased in KO cortical neurons compared to WT but restored after risperidone treatment. d In Sholl analysis, the length of the dendrites of Clcn4 KO neurons, was significantly shorter compared to WT, but the length of the dendrites after risperidone treatment was restored to WT level. e Sholl analysis showed that the neurite complexity of Clcn4 KO neurons was decreased. Risperidone treatment restored the neurite complexity of Clcn4 KO neurons to normal levels. f SYNAPSIN 1 expression was not different between neuronal lysates from Clcn4 KO and those from WT mice at DIV7 and DIV14, but the phosphorylation of SYNAPSIN 1 at Ser9 and Ser549 was significantly reduced in neurons from Clcn4 KO at DIV14. g At DIV7, risperidone treatment increased SYNAPSIN 1 Ser9 phosphorylation in Clcn4 KO compared to untreated KO. Additionally, PSD95 expression, but not phosphorylation, was elevated in risperidone-treated KO compared to WT and untreated KO. All data were analyzed by t-test or one-way ANOVA are presented as the mean ± SEM. (*p < 0.05, **p < 0.01, ***p < 0.001).
We examined the protein expression of SYNAPSIN 1 and PSD95 in DIV7 and DIV14 cells (Fig. 5f). The phosphorylation of SYNAPSIN 1 at Ser9 and Ser549 was significantly reduced in neurons from Clcn4 KO at DIV14 (Ser9: WT, 100 ± 7.5; KO, 47.8 ± 8.5, n = 6, p < 0.001; Ser549: WT, 100 ± 9.5; KO, 69.3 ± 8.1, n = 6, p < 0.05; Fig. 5f). PSD95 expression was decreased at DIV7 but restored at DIV14. The phosphorylation level of PSD95 was not changed at DIV7 (WT, 100 ± 11.3; KO, 99.5 ± 8.2, n = 3), but it was dramatically reduced at DIV14 (WT, 100 ± 19.2; KO, 25.2 ± 7.1, n = 6, p < 0.01; Fig. 5f). Next, to confirm the recovery of SYNAPSIN 1 activity after risperidone treatment, the phosphorylation levels of SYNAPSIN 1 were examined by immunoblotting. Synapsin1 phosphorylation at Ser9 (WT, 100 ± 6.1; KO, 75.8 ± 6.3; KO+Ris, 141.2 ± 4.86; n = 3; KO vs KO+Ris, p < 0.01) was increased in risperidone treated Clcn4 KO compared with untreated Clcn4 KO. Furthermore, the expression level but not the phosphorylation level of PSD95 (WT, 97.3 ± 2.2; KO, 75.3 ± 1.8; KO+Ris, 104.7 ± 3.2; n = 3; WT vs KO, p < 0.01; KO vs KO+Ris, p < 0.01) was markedly increased in risperidone treated Clcn4 KO compared to WT and untreated Clcn4 KO (Fig. 5g).
Risperidone reversed morphological changes in human neurons resulting from CLCN4 KDTo investigate the effects of CLCN4 gene deficiency in human cells, experiments were conducted using human NPCs (hNPCs) from hESCs. In both NPCs and differentiated neurons, CLCN4 mRNA was expressed, but the expression level of CLCN4 mRNA gradually increased upon neuronal differentiation (neuron vs. NPCs at Day 3, 2.34 ± 0.34 p < 0.05; Day 6, 3.13 ± 0.33, p < 0.01; Day13, 4.04 ± 0.33, p < 0.001), indicating that the biological roles of CLCN4 are more important in neurons than in NPCs (Fig. 6a). hNPCs expressed SOX2 and NESTIN, and differentiated neurons expressed TUJ1 and MAP2 (Fig. 6b). Real-time PCR and immunocytochemistry showed that CLCN4 expression levels were decreased by CLCN4 KD (Ctrl, 1.00 ± 0.00, CLCN4 KD, 0.75 ± 0.03, p < 0.01, Fig. 6c; Ctrl, 100 ± 14.9, CLCN4 KD, 0 ± 0, p < 0.01, n = 3, Fig. 6d).
Fig. 6: The effect of CLCN4 KD on human neurogenesis and reversal of the CLCN4 KD phenotype by risperidone.
a CLCN4 mRNA expression was increased upon neuronal differentiation. b Representative images of hESC-derived NPCs and neurons. SOX2 and NESTIN were used as NPC markers, and TUJ1 and MAP2 were used as neuron markers for immunocytochemistry. c Real-time PCR showed that CLCN4 mRNA levels were decreased by CLCN4 KD. d Representative images of control (Ctrl) and CLCN4 KD. The number of CLCN4-positive neurons decreased in CLCN4 KD compared to Ctrl (e) CLCN4 KD were immunostained with MAP2 (f) Sholl analysis showed that the neurite complexity of CLCN4 KD neurons was decreased. Risperidone treatment restored the neurite complexity of CLCN4 KD to normal levels. All data were analyzed by t-test or one-way ANOVA are presented as the mean ± SEM. (Ctrl vs. shCLCN4; *p < 0.05, **p < 0.01, ***p < 0.001).
CLCN4 KD neurons showed less complex neurite structures than Ctrl (Ctrl, n = 16, CLCN4 KD, n = 24, Fig. 6f). Next, we treated CLCN4 KD with risperidone and Sholl analysis showed that risperidone treatment rescued the decrease in neurite complexity in CLCN4 KD (CLCN4 KD, n = 24, CLCN4 KD+Ris, n = 12, Fig. 6f). We also treated Ctrl neurons with risperidone and conducted Sholl analysis for Ctrl+vehicle and the Ctrl+Ris groups, and no significant differences were observed between the two groups (Fig. S5). This finding suggests that the involvement of the CLCN4 gene in neurite morphology may extend beyond animal models to human neurons. This is evidenced by the observed neurite defects in human neurons resulting from CLCN4 dysfunction.
留言 (0)