
記住我
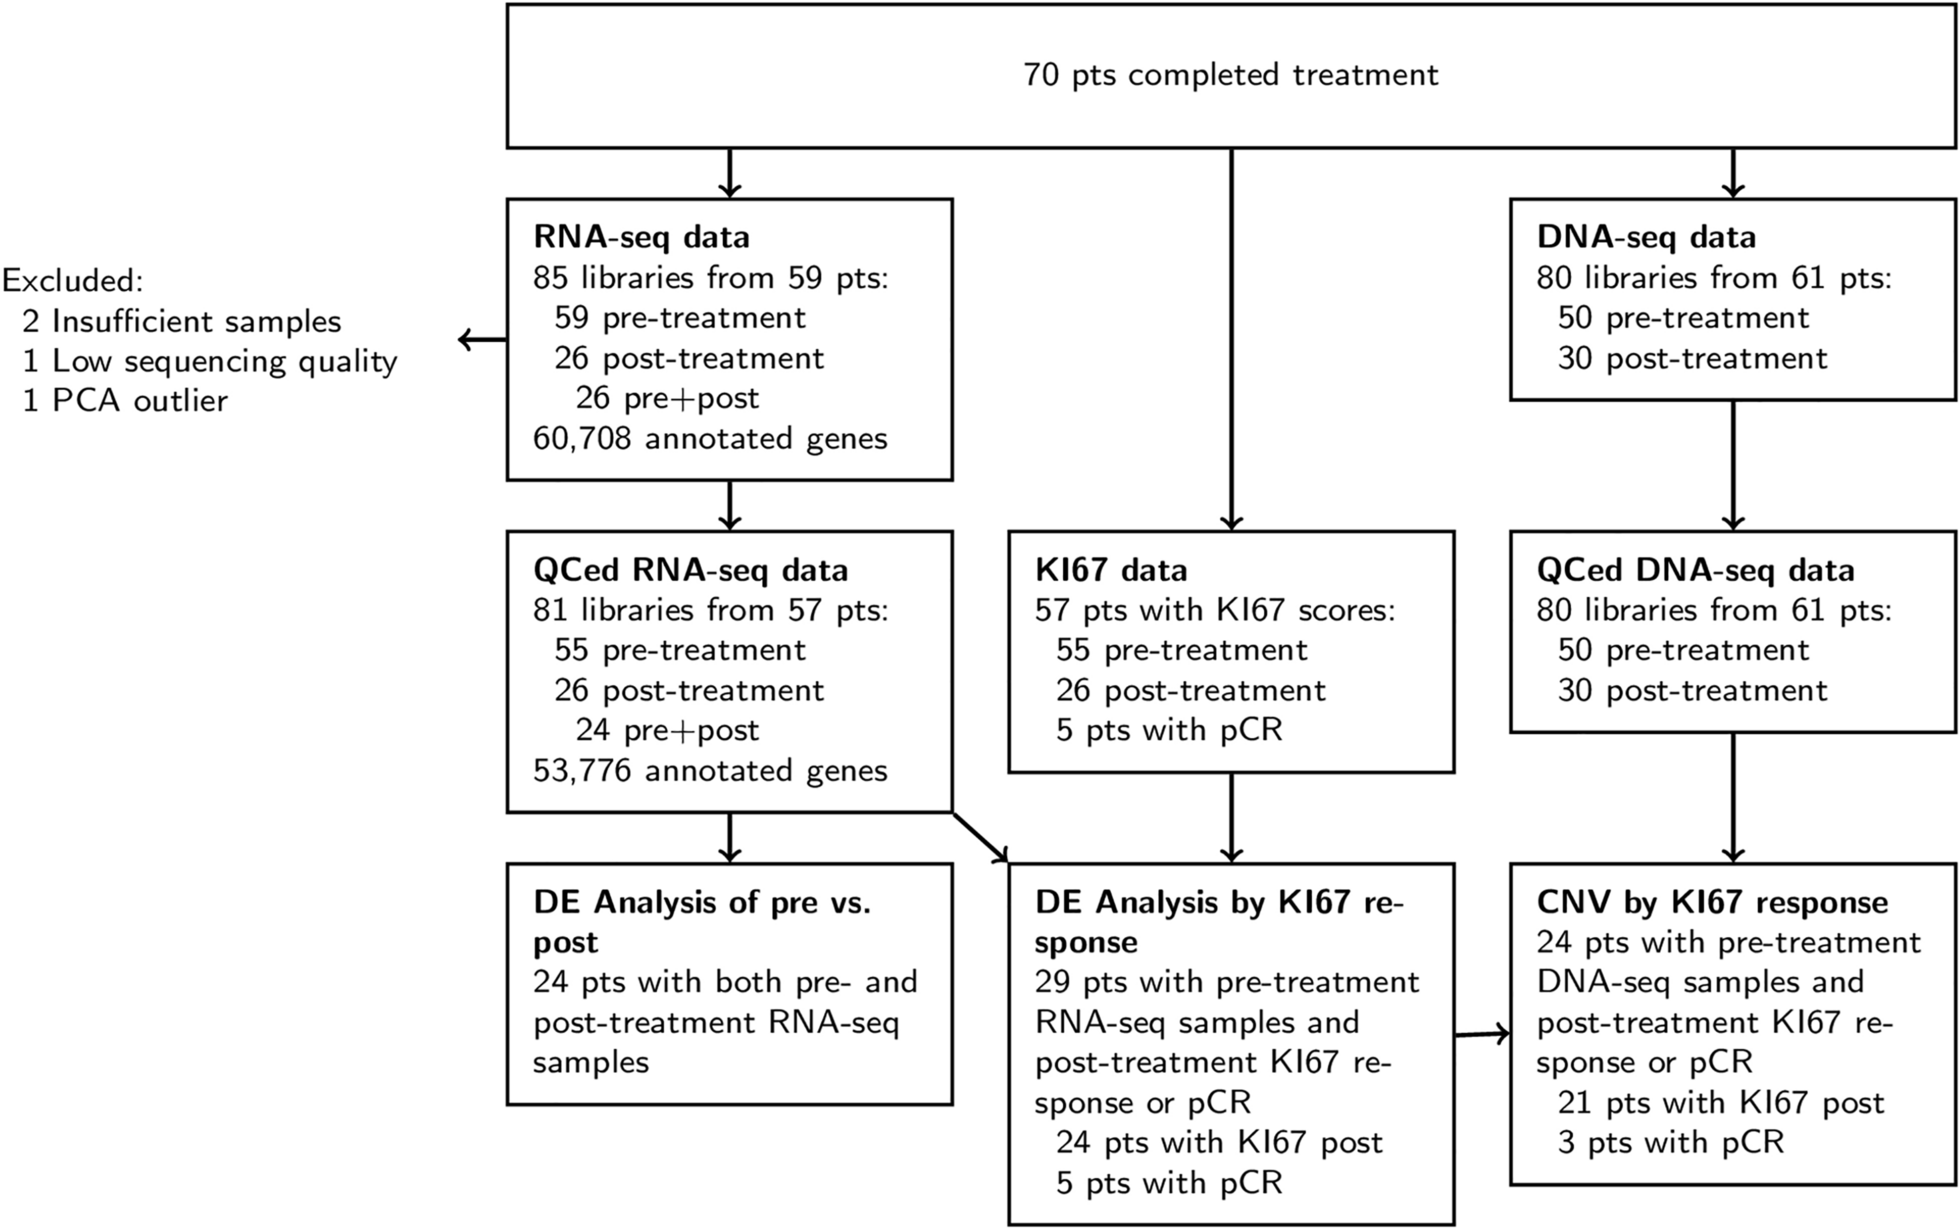


The T6I SERM scaffold adopts a unique ligand binding pose within the WT ERα hormone binding pocket to favor the therapeutic ligand binding domain (LBD) helix 12 (H12) antagonist conformation [25]. It also shows effective anti-proliferative activities in WT ESR1 MCF7 breast cancer cells [25]. Here, we solved an x-ray co-crystal structure of T6I-29 in complex with Y537S ERα LBD to reveal the structural basis of anti-cancer activities. The T6I-29 structure was solved to 2.20 Å with a canonical ERα homodimer in the asymmetric unit. Figure 1 shows the structural analysis of the Y537S ERα LBD-T6I-29 complex. Figure 1A shows an overview of the Y537S ERα LBD homodimer-T6I-29 complex. In the “B” monomer, there are significant crystal contacts in the H11-12 loop and H12 regions confounding analysis. Therefore, analysis is primarily based on the “A” monomer where these crystal contacts are not present.
T6I-29 is resolved in the hormone binding pocket, but reduced difference density is observed in the fluoropropyl group, suggesting that the side-arm is more mobile in the Y537S than the previously described WT LBD (Fig. 1B) [25]. The isoquinoline core forms a hydrogen bond network with E353, R394, and a water molecule within the hormone binding pocket, while the pyrrolidine side-arm forms a hydrogen bond with D351 and the fluorpropyl group adopts a conformation between D351 and helix 12 (H12) (Fig. 1B). Our earlier study showed that the SERM 4-hydroxytamoxifen (4OHT), which is less effective in Y537S cells, poorly enforced the Y537S H12 antagonist conformation with S537 at too great a distance to form a hydrogen bond with E380 (Fig. 1C) [19], whereas effective molecules like raloxifene (RAL) maintained a WT-like antagonist conformation with a well resolved H12 and a hydrogen bond between S537 and E380 (Fig. 1D). Compared to existing structures of SERMs and SERDs in complex with Y537S ERα LBD, the T6I-29-bound structure is most like raloxifene (RAL), which showed significant anti-transcriptional efficacy in breast cancer cells harboring Y537S ESR1 [24]. H12 is superimposable between the RAL and T6I-29 structures. However, the 537 S side chain is poorly resolved in the T6I-29 structure (Fig. 1E) suggesting that, while more effective than 4OHT, it is less effective than RAL.
Fig. 1
Structural basis of T6I-29 efficacy in Y537S ESR1 breast cancer cells. A) Overview of the Y537S ERα LBD homodimer x-ray co-crystal structure with T6I-29 (green sticks) bound in the hormone binding pocket. Helix 12 (H12) is highlighted in green. B) T6I-29 interactions with residues in the hormone binding pocket, the difference density map of relevant atoms are shown in blue mesh. C) Difference density map from the Y537S-4OHT x-ray co-crystal structure highlighting the poor density of H12 that is representative of poor transcriptional antagonists in Y537S ESR1 breast cancer cells. D) Difference density map from the Y537S-RAL x-ray co-crystal structure highlighting the improved density of H12 that is found in effective transcriptional antagonists in Y537S ESR1 breast cancer cells. E) Superposition of T6I-29 (green) with RAL (blue) x-ray co-crystal structures. F) Superposition of T6I-29 in complex with WT (cyan) or Y537S (green) ERα LBD. G) Chemical structures of T6I-29, T6I-14-1, and T6I-4-1. H) Side-by-side comparison of ligand, E380, and S537 difference density maps for T6I-29, T6I-14-1, or T6I-4-1 in complex with Y537S ERα LBD. All difference density maps are 2mFo-DFc and are contoured to 1.0 σ. Protein DataBank (PDB) accession codes are: 9BPX for Y537S-T6I-29, 7UJ8 for Y537S-4OHT, 7UJC for Y537S-RAL, 8DVB for WT-T6I-29, 9BQE for Y537S-T6I-14-1, and 9BU1 for Y537S-T6I-4-1
Effective SERMs and SERDs maintain a WT-like H12 antagonist conformation when Y537S mutation is present [24]. Here, few differences are observed between the WT and Y537S T6I-29 x-ray co-crystal structures (Fig. 1F). H12 in the Y537S structure lies in a slightly altered position but is still docked in the AF-2 cleft compared to the WT. This suggests that there is only a minor impact to the H12 antagonist conformation due to the presence of the mutation. Interestingly, the unique impact of T6I-29 on F425 conformation is maintained between the WT and Y537S ERα LBD co-crystal structures (Fig. 1F). We also solved x-ray crystal structures of analogous T6I-SERMs T6I-14-1 and T6I-4-1 to better understand the structural-basis of activities. The T6I-14-1 structure was solved to 1.98 Å, and the T6I-4-1 structure was solved to 1.75 Å. Compared to T6I-29, T6I-14-1 lacks a fluoro group on the propyl side arm while T6I-4-1 contains a propylazetidine size arm (Fig. 1G). In each case the T6I core adopts an identical conformation and few conformational differences are observed in H12, S537, and E380 (Fig. 1H). Therefore, different side-arms can be accommodated on the T6I scaffold to induce the effective H12 conformation in Y537S ERα LBD.
The Y537S ERα LBD mutation can impact the conformational dynamics of the SERM or SERD-saturated complex [19, 30]. Atomistic molecular dynamics simulations were performed to identify potential differences in the mobility between WT and Y537S ERα LBD in complex with 4OHT, lasofoxifene (Laso), T6I-29, or elacestrant (Rad1901). 4OHT is a major active metabolite of tamoxifen and is a SERM that shows reduced efficacy in the presence of ESR1 LBD mutations [19, 20]. Laso is also a SERM, but it retains efficacy in the presence of Y537S ERα [31]. It is currently in clinical trials (ELAINE trials) for treatment of advanced stage ESR1 mutant breast cancer [31, 32]. Rad1901 has recently been approved for treatment of advanced ESR1 mutant breast cancers [33, 34]. In all the simulated systems, the root mean squared fluctuation (RMSF) is low except in regions with the residues 322–342, 392–422, 452–472, and 522–535 (H11-12 loop). Differences in the molecular dynamics induced by the Y537S mutation were most pronounced in the H11-12 loop (residues 525–536) (Supplemental Fig. 1). For each complex, the Y537S mutant has a much higher RMSF than WT in the H11-12 loop region. These higher fluctuations are consistent with the poorly resolved electron density of the x-ray crystal structures. Interestingly, T6I-29 appears to increase the RMSF to the greatest extent of any of the ligands in the WT LBD, suggesting that it may have unique effects on this region of the protein.
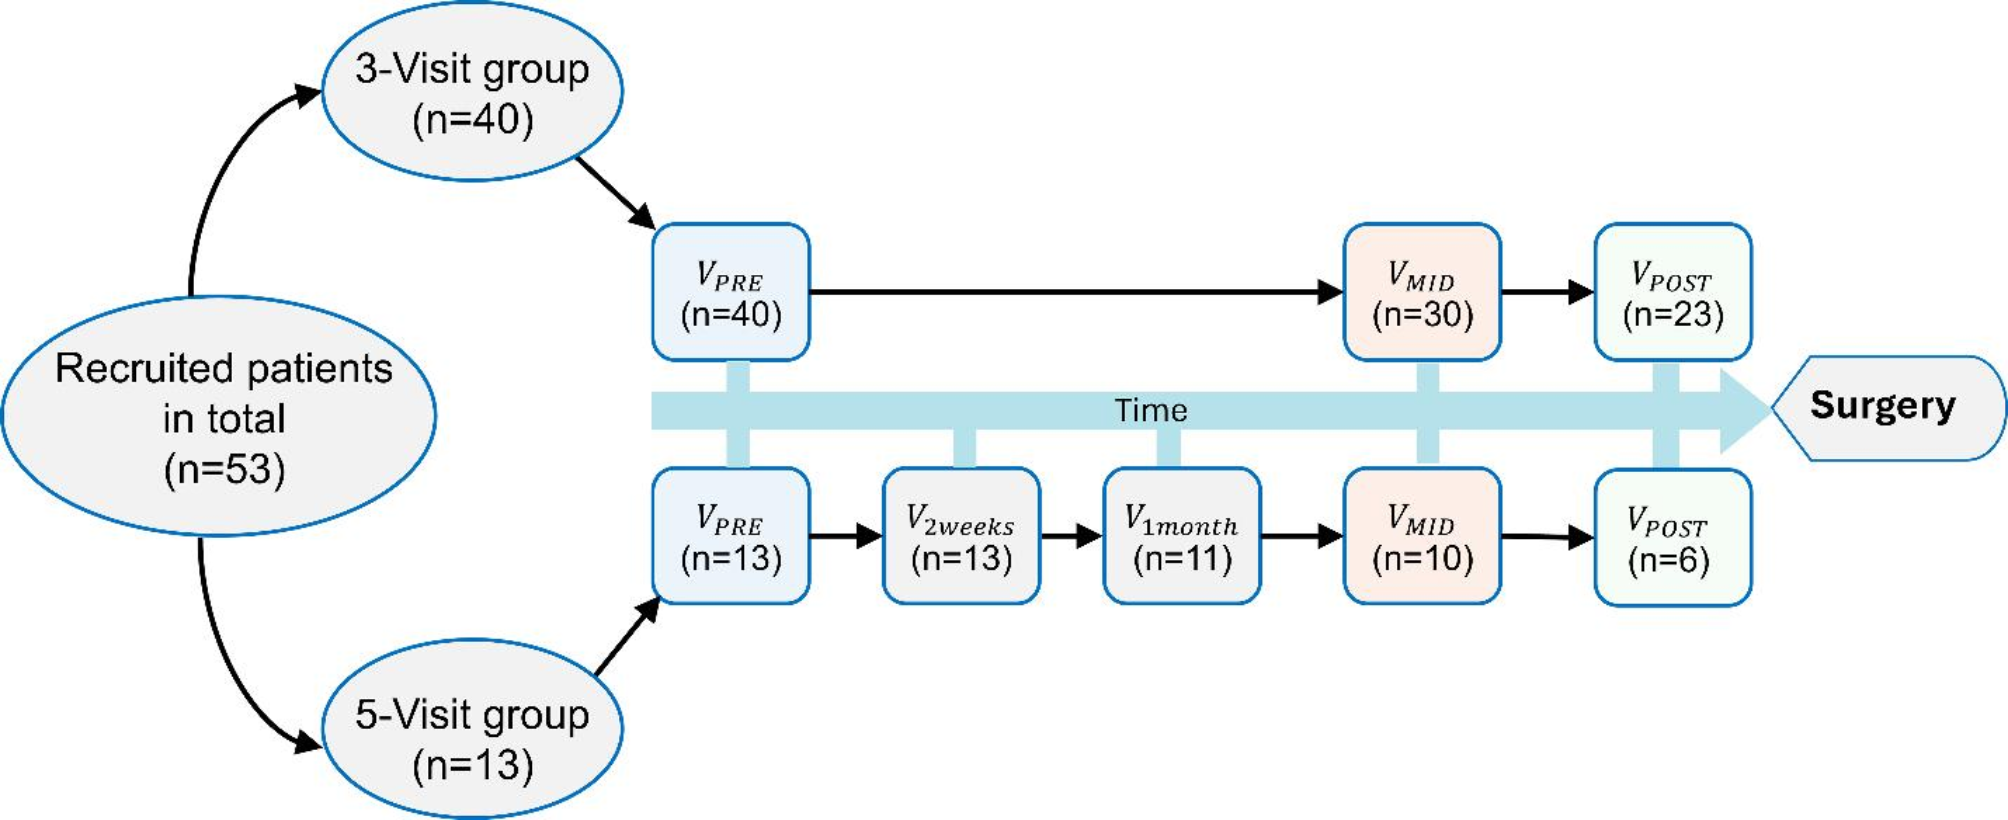
T6I-29 attenuates the proliferation, migration, and ERα target gene upregulation in breast cancer cells harboring Y537S ESR1The active enantiomer of T6I-29, T6I-29–1 A, was first assessed for its anti-proliferative activities in Y537S ESR1 breast cancer cell lines compared to clinically relevant compounds and other T6I SERMs. Clinically relevant compounds included fulvestrant (ICI), 4OHT, Laso, Rad1901, and giredestrant (Gir). Rad1901, an orally available SERD also retains efficacy in the presence of ESR1 mutations, and was recently FDA-approved for patients with ESR1 mutated advanced ER + breast cancer based on the positive results of the phase III EMERALD trial [35]. Gir is an orally available SERD, also in clinical trials for treatment of advanced ER + breast cancers [36, 37]. Figure 2 shows the impact of T6I-29–1 A on Y537S ESR1 cell proliferation and ER target gene regulation. To assess anti-proliferative effects, T47D Y537S ESR1 and MCF7 Y537S ESR1 breast cancer cells were treated with 1 µM compound in the presence of 1 nM estradiol (E2) and changes in cell count were measured over time (Fig. 2A/B). In both cell lines, T6I-29–1 A significantly blunts cell proliferation comparable to other clinically relevant compounds (Fig. 2A/B). Other T6I compounds T6I-4-1, T6I-6-1, and T6I-10-1 showed limited success in blunting proliferation in both ESR1 mutant cell lines (Fig. 2A/B).
Fig. 2
The impact of T6I-29–1 A on the proliferation and ER target gene expression of Y537S ESR1 mutant breast cancer cells. All drug treatments indicated are 1 µM drug in the presence of 1 nM E2. A) T47D Y537S ESR1 and B) MCF7 Y537S ESR1 breast cancer cell proliferation. Cells were treated for 13 or 5 days, respectively, replenishing treatment conditions every 3–4 days until E2-only wells were confluent and experiments were concluded. Graphs represent the mean of three biological replicates, with three technical replicates/each. Data is normalized to E2 treatment, error bars are s.d. Statistical analysis was performed using Anova with Tukey post-hoc test. C-F) RT-qPCR in T47D Y537S ESR1 and G-J) MCF7 Y537S ESR1 cells. Cells were treated for 6 h as indicated, before harvest and analysis. Representative data are the mean of three replicates ± s.d. and error bars show s.d. Significance determined by one-way Anova test with tukey post-hoc where *p < 0.05, **p < 0.005, ***p < 0.0005, and ****p < 0.00005
We next measured the ability of T6I-29–1 A to inhibit migratory and stem cell phenotypes of MCF7 Y537S ESR1 cells. A scratch wound assay showed T6I-29–1 A significantly blunted migration in Y537S ESR1 MCF7 cells (Supplemental Fig. 2A-C). Mammosphere assays, or 3D colony formation assays, assess the “stemness” of the breast cancer cells [38, 39]. T6I-29–1 A decreased the size of mammospheres, but not the total number compared to control, while other relevant compounds decreased both the size and number (Supplemental Fig. 3A-C).
To investigate the effects of T6I-29–1 A on ER target gene regulation, we performed RT-qPCR on both MCF7 and T47D Y537S ESR1 mutant cell lines. Cells were treated with 1 µM compound in the presence of 1 nM E2 for 6 h. In Y537S ESR1 T47D cells, T6I-29–1 A potently downregulated the ER target gene cMYC, and PGR, but did not significantly decrease expression of GREB1 and cMYC (Fig. 2C-F). Conversely, in Y537S ESR1 MCF7 cells, T6I-29–1 A significantly downregulated ER target genes GREB1, PGR, cMYC, and CA12 (Fig. 2G-J). Although it appears that T6I-29 does not downregulate ERα target genes as potently as the clinical standard ICI (omitting CA12 in T47D Y537S ESR1 cells), it significantly blunts gene expression compared to E2 treated cells except for GREB1 expression in T47D Y537S ESR1 cells and CA12 expression in MCF7 Y537S ESR1 cells. Similar ER target gene downregulation is seen at a 24-hour treatment (Supplemental Fig. 4).
Inhibition ERα-coactivator bindingIn ER + breast cancers, ERα recruits various coactivators to fuel transcriptional-driven tumor growth, with steroid receptor coactivator-3 (SRC3) being one of the most associated with pro-oncogenic activities [40,41,42]. SERMs and SERDs favor a H12 conformation that disfavors SRC3 binding via LXXLL motifs in the activating function-2 cleft of ERα [43]. We used the NanoBiT assay to measure how T6Is and other relevant compounds impacted the association between SRC3 and WT or Y537S ERα [44]. Clinically relevant compounds used in this assay included: Gir, ICI, amcenestrant (Amc), camizestrant (Cam), 4OHT, Laso, Rad1901, and lead T6Is (T6I-29–1 A, T6I-4-1, and T6I-6-1). The SERD Amc was recently discontinued after phase II clinical trials after failure to meet primary endpoints [45]. Cam is an oral SERD currently in clinical trials [46, 47]. Plasmids encoding either wild-type (WT) smBiT-ERα or mutant smBiT-Y537S ERα were co-transfected with a plasmid encoding lrgBiT-SRC3 into HEK293T cells. Following transfection, cells were introduced into charcoal-stripped serum depleted of hormone for 72 h. Cells were then treated with serial dilutions of SERM or SERD (5-fold from 5 µM to 12.8 pM in triplicate, over three biological replicates) in the presence of 1 nM E2.
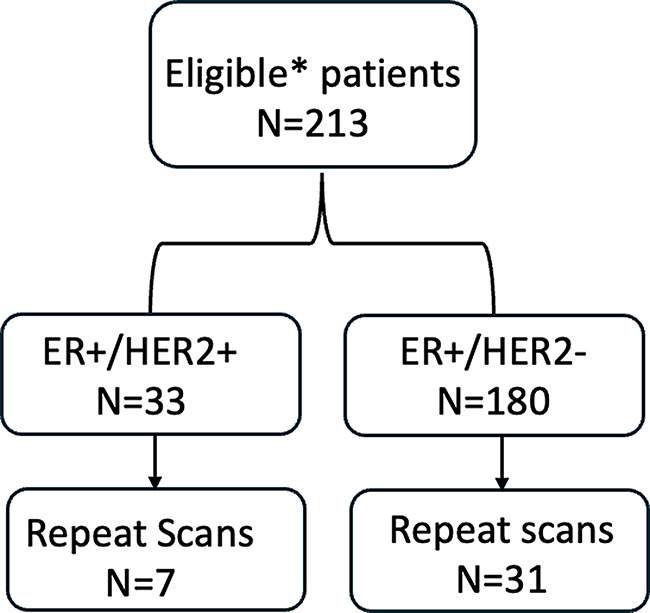
Each plate included DMSO and 1 nM E2 control wells in triplicate. After 48 h of treatment, which showed the best signal-to-noise ratio, wells were read for luminescence. From this, we derived IC50 data for WT-SRC3 and mutant Y537S-SRC3 interactions in the presence of different drug treatments. Figure 3 shows the IC50s of relevant clinical compounds and T6Is on this protein-protein interaction.
Table 1 shows IC50 values for each compound in WT and Y537S-SRC3 interactions. All compounds tested showed increased inhibitory potency in the WT setting compared to Y537S (Table 1). In the WT setting, SERDs including Gir and ICI demonstrated the greatest potency, followed by SERMs Laso and 4OHT, while Rad1901 and the T6Is, including T6I-29–1 A, had the lowest IC50s (Fig. 3A-C; Table 1). In the Y537S setting, Laso showed the greatest inhibitory potency, while Rad1901 and the T6Is remained the least potent (Fig. 3D-F; Table 1). It should not be surprising that Laso showed the greatest potency in the presence of the mutant since it also maintains its binding affinity and enforcement of the LBD antagonist conformation [31]. Both Rad1901 and the T6Is required additional treatments up to 20 µM in order to measure IC50 values in the Y537S setting (Fig. 3F). In concordance with these findings, there is a larger difference in IC50 values between WT and Y537S in SERMs 4OHT, Rad1901, and the T6I compounds compared to SERDs (ICI, Gir, Amc, Cam) (Table 1). Based on these data, Rad1901, as well as the T6Is, may primarily function to blunt tumor growth via other mechanisms of antagonism than this specific coactivator interaction with ERα and SRC3.
Table 1 IC50s and standard deviations of clinically relevant and T6I compounds on inhibition of receptor-coactivator interaction. Left: IC50s, standard deviation, and R2 of WT-SRC3 co-transfection interaction. Middle: IC50s, standard deviation, and R2 of Y537S-SRC3 co-transfection interaction. Right: Differences in IC50 values between WT-SRC3 and Y573S-SRC3 co-transfection interactions. All data represents three biological replicatesFig. 3
Lead T6Is and clinically relevant SERMs and SERDs inhibit WT and Y537S ERα-Coactivator binding. HEK 293T cells were co-transfected with indicated plasmids (WT ERα or Y537S ERα and SRC3), charcoal stripped for 72-hours, followed by treated with increasing concentrations of drug for 48 h prior to bioluminescence reading. Clinically relevant (A) SERD and (B) SERM inhibition curves with WT-SRC3 binding. (C) Rad1901 and T6Is inhibition curves for WT-SRC3 binding. D-F) Same as A-C, but with Y537S-SRC3 binding. Data are shown as the mean ± s.d
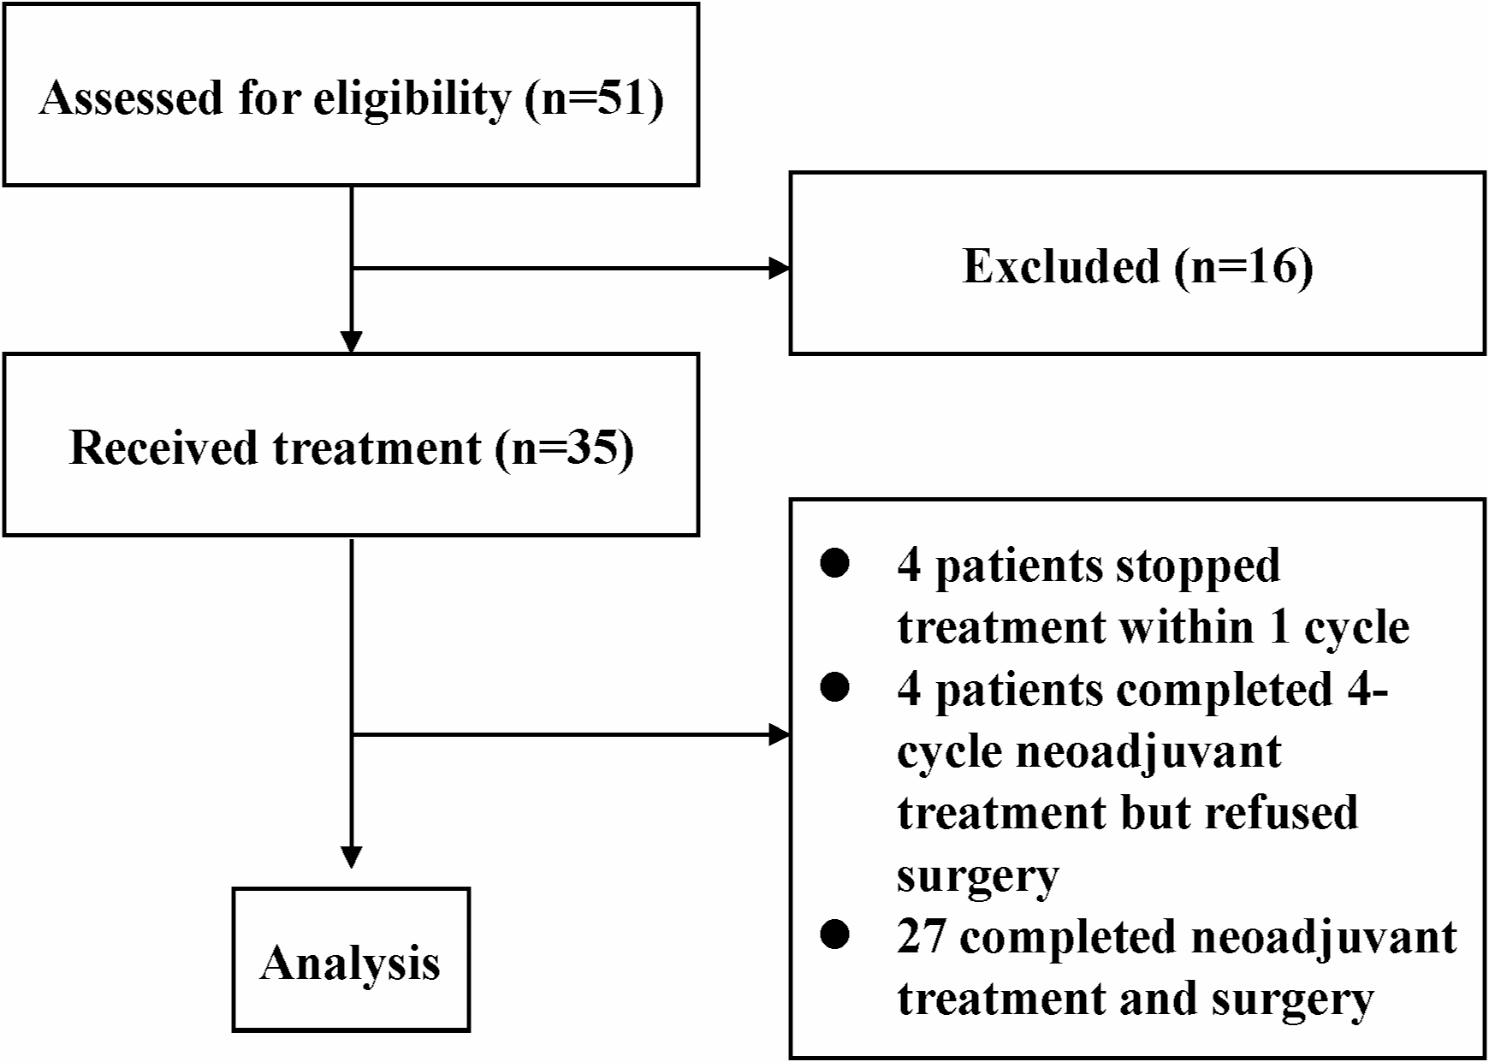
Pharmaceutical properties of T6I-29Preliminary drug metabolism and pharmacokinetics (DMPK) and adsorption, distribution, metabolism (ADME) were measured to determine the suitability of T6I-29 for in vivo studies. Figure 4 shows DMPK and ADME profiles of T6I-29 in vivo preliminary studies. For the DMPK studies, 25 mg/kg was chosen as the starting dose and it was tested by intraperitoneal (IP) and oral gavage (PO) administration routes in C57/BL/6J mice (Fig. 4A/B). For drug delivery vehicle we used 20% DMSO dissolved in 20% captisol in water for IP and the pH was adjusted with HCl. For PO, 2% tween 80 and 0.5% methylcellulose was used in water (Supplemental Table 1/2). T6I-29 shows a serum half-life is 3.60 ± 0.07 and 4.02 ± 0.96 h by IP and PO respectively. Its mean Cmax was 5,053 ± 995 and 752 ± 70 ng/mg for IP and PO respectively. The AUC was 8,350 ± 1,038 and 2,931 ± 503 h*ng/mL for IP and PO respectively. The ADME for T6I-29 in human and mouse plasma protein binding showed that 1.54% and 2.57% fraction unbound by protein respectively. This ADME profile is similar to other SERMs and SERDs, with tamoxifen also showing greater than 98% protein binding [48]. No signs of toxicities were observed in these preliminary studies.
Fig. 4
Pharmacokinetics of T6I-29–1 A measured at 25 mg/kg dose A) By IP and B) By PO. Serum half-life was interpolated from curves. Three mice were used per study. Plasma concentration measured by ELISA
Pilot murine T6I-29 studiesTo characterize the effects of T6I-29 on tumor growth and to determine the best mode of delivery, we used an ectopic murine Y537S ESR1 MCF7 xenograft model and treated with different doses of T6I-29–1 A. Female NOD/SCID ovariectomized mice were bilaterally injected with homozygous Y537S ESR1 MCF7 cells in their #4 mammary fat pads. All mice were implanted with a silastic E2 pellet one week before cell injection. After tumors reached 100 mm3, mice were randomized into different treatment groups. Figure 5 shows the anti-tumoral effects of T6I-29–1 A in preliminary in vivo IP and PO studies. We found that via IP injection five times a week, T6I-29–1 A appeared to significantly inhibit tumor growth at 25 mg/kg and 100 mg/kg doses, measured at day 9 of treatment (n = 4–8 tumors/treatment group) as measured by caliper three times per week (Fig. 5A). Examining metastatic lesions at common sites (liver, lung, brain, femurs, and uterus) by pathologist Dr. Khin Su Mon showed the fewest number of metastases occurred with the 25 mg/kg dose of T6I-29–1 A (Fig. 5B). There were no significant uterine stimulatory or antagonistic effects with any dose of T6I-29–1 A (Supplemental Fig. 5A/B). We did not observe a significant survival benefit with any dose of T6I-29–1 A by IP in this pilot study, but the 100 mg/kg cohort trended towards significance (p = 0.056). (Fig. 5C). Representative metastatic lesions in the liver, adrenal gland, femur, and uterus by H&E stain are shown (Fig. 5D).
To investigate whether oral administration maintained tumor blunting activities, heterozygous, luciferase-tagged Y537S ESR1 MCF7 was used. Using the same cell injection and mouse randomization protocol, we monitored tumor growth with 5 and 25 mg/kg doses of T6I-29–1 A, administered five times per week by oral gavage. By caliper, T6I-29–1 A did not appear to significantly inhibit tumor growth (Fig. 5E). There was no significant uterine stimulatory or degrative effects in this study (Supplemental Fig. 5C/D). However, tumors were also analyzed using bioluminescence imaging with the IVIS system, and through this method, T6I-29–1 A significantly diminished tumor growth compared to vehicle at 25 mg/kg treatment (Fig. 5F). Ex vivo analysis of common sites of breast cancer metastasis (liver, brain, femurs, uterus) showed a trend toward significant decrease with increasing dose of T6I-29–1 A (Fig. 5G). When stratified by different organs, the 25 mg/kg treatment trends towards decreased lesions, with a significant reduction in bioluminescent signal in the brain compared to vehicle treated mice (Supplemental Fig. 7). To this end, metastatic characterization by Dr. Marteen Bosland confirmed some metastatic lesions as determined by the IVIS system (Supplemental Fig. 6A-C). However, very few metastatic lesions were found overall via histological staining, revealing the shortcomings of this xenograft model.
Fig. 5
T6I-29–1 A inhibits tumor growth in preliminary in vivo studies. Female NOD/SCID mice were orthotopically injected with ESR1 MCF7 Y537S cells bilaterally in mammary fat pad #4. Mice received silastic E2 implant surgery 1 week before cell injection. A) Tumor growth (error bars indicate SEM) in I.P. pilot study, n = 4–8 tumors/ group. Two-way Anova measures significance with Bonferroni post-hoc test; results indicate day 9 treatment analysis. B) Total metastatic lesions as measured by H&E staining by Dr. Khin Su Mon across groups. C) Survival curve of I.P. pilot study, significance determined using log-rank test. Veh vs. 100 mg/kg p = 0.0624. D) Representative photos capturing metastases (top to bottom) in the liver (vehicle-treated), left femur (vehicle-treated), adrenal gland (100 mg/kg treated), and uterus (vehicle-treated). E) Tumor growth (error bars indicate SEM) in oral pilot study, n = 6 tumors/ group. Analyzed with Two-Way Anova with Bonferroni post-hoc test. F) Tumor luminescence of oral pilot study measured weekly (error bars indicate SEM). Analyzed with unpaired t-test at treatment week 3. G) Luminescence of the liver, lung, brain, femurs, and uterus were measured for each mouse in each group ex vivo (error bars indicate s.d.), and results were graphed based on treatment groups, including both sides of organ luminescent signal. Anova with Tukey post-hoc statistical test was used to determine significance
ICI exhibits improved tumor growth inhibition compared to T6I-29Based on our preliminary murine pilot IP and PO studies (Fig. 5), we used a 25 mg/kg IP dose in a comparative study to ICI to investigate tumor growth and metastatic colonization differences between treatment conditions with increased statistical power. Using the same ectopic xenograft model, heterozygous, luciferase-tagged Y537S ESR1 MCF7 cells were bilaterally injected into the #4 mammary fat pads of female NOD/SCID ovariectomized mice, and mice were randomized to different treatment groups when tumors reached 100 mm3 (10 mice/ group). All mice were implanted with a silastic E2 pellet one week prior to cell injections. Figure 6 shows the anti-tumoral effects of T6I-29–1 A compared to a clinical standard for advanced ER + breast cancer, ICI. Mice were treated with Vehicle (Veh), 25 mg/kg T6I-29–1 A five times per week, or a clinically relevant dose of 25 mg/kg ICI once per week [49]. We observed a reduced but not significant reduction in tumor growth in the T6I-29–1 A-treated group compared to the vehicle, while ICI significantly blunted tumor growth, as measured by a digital caliper (Fig. 6A, Supplemental Fig. 8). While ICI significantly decreased final uterine weights, T6I-29–1 A had no significant stimulatory or degrading effects (Fig. 6B). Previous studies have shown that SERM treatment increases endometrial thickness due to the estrogenic nature of compounds, while SERDs, such as ICI, inhibit growth [50,51,52]. To this end, rodent uterine models are used to assess the estrogenic-stimulatory capacity of compounds, and higher estrogenic stimulation may indicate a higher risk for endometrial cancer [49, 53, 54]. In an additional uterine SERM agonist study, we measured endometrium thickness in female BALB/c ovariectomized mice treated with 4OHT, ICI, and T6I-29–1 A in the presence and absence of E2 compared to vehicle with and without E2 treatment (Supplemental Fig. 9). Based on the analysis of endometrium thickness, 4OHT treatment significantly increased width, T6I-29–1 A treatment did not have a significant effect, and ICI diminished the thickness (Supplemental Fig. 9A-E).
In the comparative study with T6I-29–1 A and ICI, survival increase was not significant for mice treated with T6I-29–1 A (p = 0.0966), while it was significantly prolonged for ICI treated mice (Fig. 6C). Tumor growth was also monitored via bioluminescent imaging using the IVIS system. We observed that the tumor luminescence signal was significantly diminished by T6I-29–1 A, measured at treatment week 2, but tumor luminescence was non-significant at week 3, indicating a potential early anti-tumor effect that is lost over time (Fig. 6E). However, there was no significant difference in bioluminescent signal when comparing ICI to vehicle (Fig. 6E). IVIS ex vivo analysis showed no statistical difference in metastatic bioluminescence of common sites (liver, brain, femurs, uterus) (Fig. 6F). While some of these metastatic sites measured by IVIS were confirmed by pathology analysis of H&E stained tissues, these results showed very little metastatic burden across any group (Supplemental Fig. 10A-E). Individual site’s metastatic luminescence was quantified individually, all with no significant change in metastases, with the exception of the right femur (Supplemental Fig. 11A-G). Metastatic burden quantification by tissue from H&E slides analyzed pilot I.P., P.O., and the comparative study analyzed by pathologists Dr. Mon and Dr. Bosland can be found in the supplement material (Supplemental Table 4). RT-qPCR was used to quantitate ER target gene effects with different treatment groups, with trends towards downregulation in T6I-29–1 A treated mice that is heightened with the treatment of ICI, although no significance was noted (Supplemental Fig. 12A-G).
Fig. 6
ICI blunts tumor growth more effectively than T6I-29–1 A. Female NOD/SCID mice received silastic E2 pellet surgery one week prior to cell injection. ESR1 MCF7 Y537S cells with a luciferase tag were injected bilaterally into mammary fat pad #4. A) Tumor growth (error bars represent SEM) in vehicle, T6I-29–1 A, and ICI treatment groups (n = 17–20 tumors/ group). Significance is measured by Two-Way Anova with Bonferroni post-hoc test. B) Final uterine weights (n = 10 mice/ group). Significance is measured by Anova with Tukey post-hoc test. C) Survival curve compared to vehicle. Log Rank test used to determine significant survival benefit. Veh vs. T6I-29–1 A: p = 0.0966, Veh vs. ICI: p = 0.0001, T6I-29–1 A vs. ICI p = 0.0052. D) Representative weekly IVIS bioluminescent imaging denoting weekly tumor growth. Scale bar shown on right. E) Quantified luminescence for each treatment group (error bars represent SEM). Significance was determined using unpaired t test at each week with Mann-Whitney correction. F) Ex vivo metastatic luminescence at common sites (liver, femurs, uterus, brain) for each mouse. Anova with Tukey post-hoc was used to determine significance
T6I-29 uniquely downregulates DKK1 in Y537S ESR1 breast cancer cellsStructurally unconventional SERMs and SERDs can engage new ER-coregulator interactions to engage new transcriptional activities [25, 55]. In WT ESR1 breast cancer cells, T6I-29–1 A showed unique effects on genes related to SUMO and SUMOylation [25]. Here, RNA-sequencing was used to determine whether T6I-29–1 A engaged unique transcriptional programs in MCF7 Y537S ESR1 cells. RNA was isolated from cells treated with relevant clinical compounds (ICI, Laso, and Rad1901) and T6I-29–1 A at 1 µM in the presence of 1 nM E2 for 24 h. Figure 7 shows distinct transcriptional programs engaged by T6I-29–1 A compared to other SERMs and SERDs. While there was significant overlap between all treatment conditions, T6I-29–1 A uniquely and significantly downregulated pathways associated with cell morphogenesis, and components of the extracellular matrix (Fig. 7A/B). As we previously observed in WT ESR1 cells, T6I-29–1 A shares a large number differentially expressed transcripts in common with laso, Rad1901, and ICI (Fig. 7C) [25]. Pathway analysis showed that T6I-29–1 A uniquely impacted genes associated with the Wnt/β-Catenin pathway, including cell adhesion and morphogenesis (Fig. 7D). Interestingly, these were Y537S ESR1 allele-specific pathways previously shown to enhance the metastasis of breast cancer cells harboring the mutant [
留言 (0)