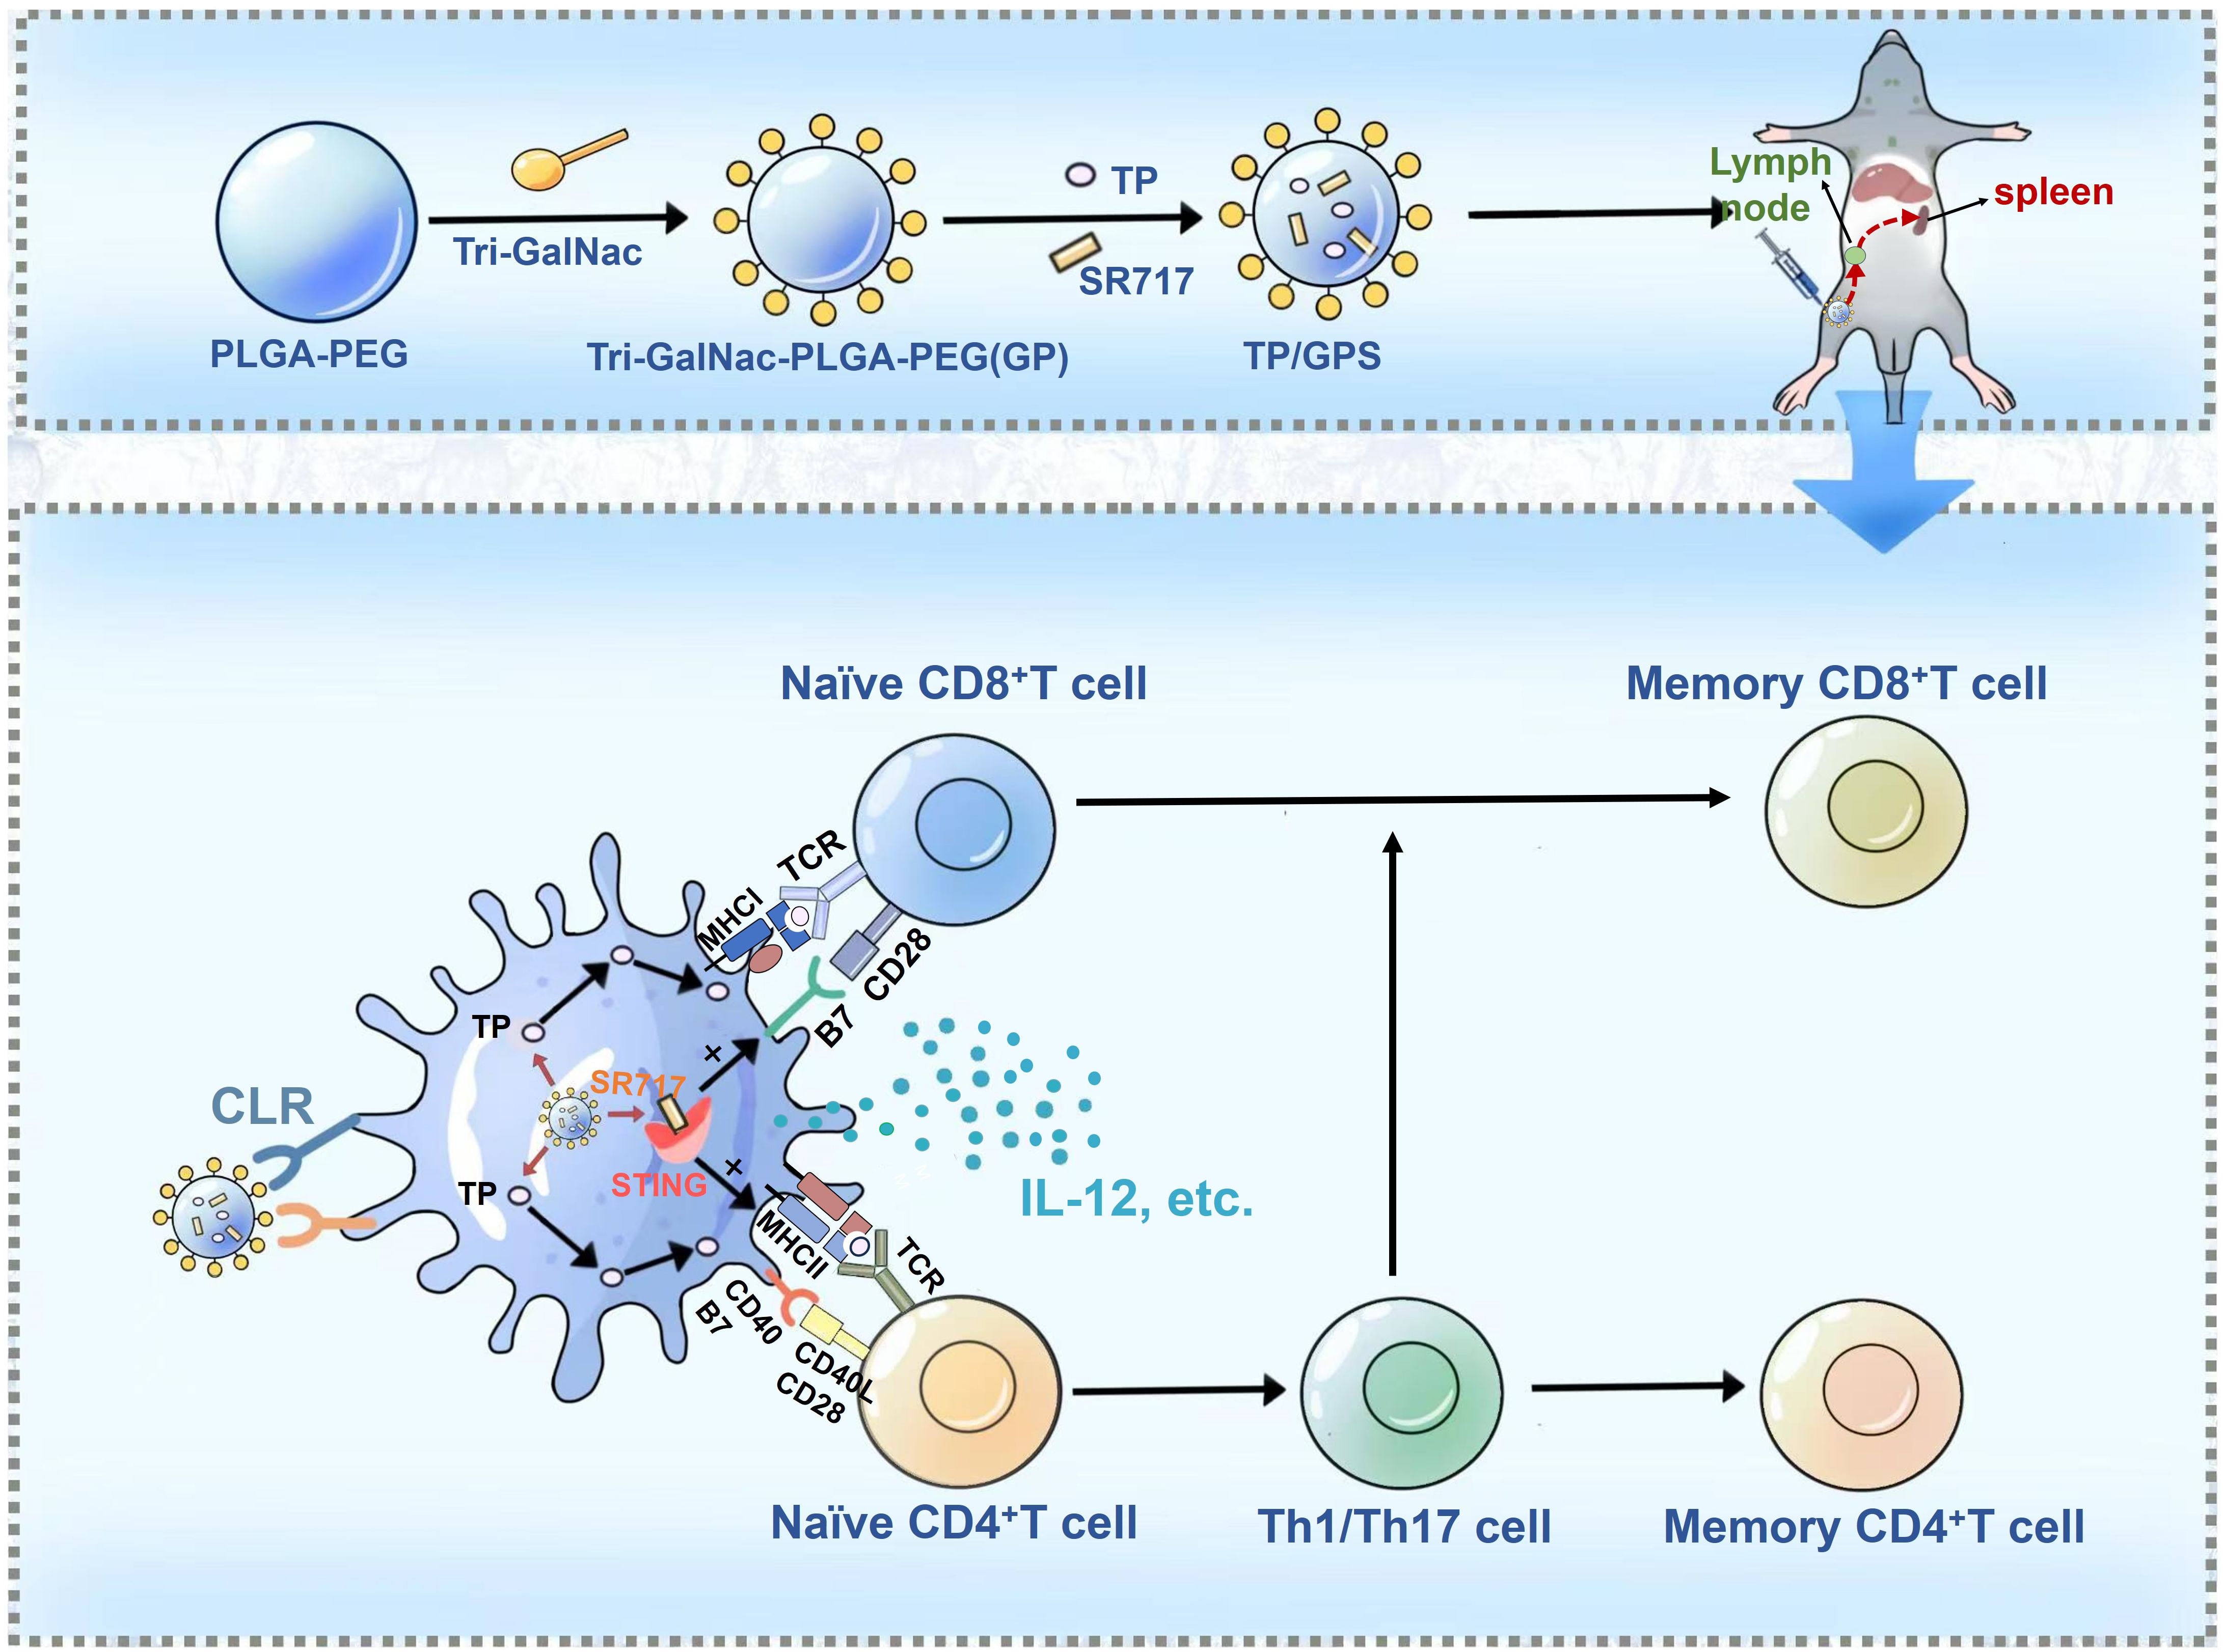
Graphical Abstract. M. Tuberculosis fusion proteins (TP) and the STING agonist SR717 are co-encapsulated within Triantennary N-Acetylgalactosamine (Tri-GalNAc)-modified PLGA-PEG nanoparticles, denoted as TP/GPS. Following subcutaneous administration, these TP/GPS are effectively phagocytosed by dendritic cells (DCs). The encapsulated TP and SR717 are then released, stimulating the DCs maturation and antigen presentation to T cells. This leads to the subsequent activation and differentiation of CD4+ and CD8+T cells into memory T cells.
1 IntroductionDeveloping vaccines against intracellular pathogens, such as Mycobacterium tuberculosis (M. tuberculosis), poses unique challenges due to the pathogens’ ability to reside and replicate within host cells. Effective vaccines must stimulate a robust cell-mediated immune response, especially the T-helper (Th) 1 cells and cytotoxic T lymphocyte (CTLs) to kill the resided pathogen directly or indirectly by activating macrophage (1–4). Furthermore, as tuberculosis (TB) is a chronic disease, an effective TB vaccine should be able to induce the generation of long-term memory T cells (5). After the host is infected with M. tuberculosis, long-term memory T cells can rapidly proliferate and differentiate to produce effector cytokines and antimicrobial molecules to kill the pathogen (6, 7). Adjuvants regulate adaptive immune responses by activating innate immunity and assisting in the activation of T and B lymphocytes (8). Selecting appropriate adjuvants to enhance the T cell-mediated immune memory is a promising strategy for TB subunit vaccines (9).
Dendritic cells (DCs) are one of the principal antigen-presenting cells (APCs) that play a crucial role in facilitating adaptive immune responses, especially in generating CD4+T and CD8+T cell responses (10–13). Hence, the process of directing antigens specifically to DCs can augment antigen presentation and thereby amplify immune activation (14). C-type lectin receptors (CLRs) are phagocytic receptors highly expressed on the surface of immature DCs. These receptors selectively recognize specific carbohydrate structures, facilitating the phagocytosis process of phagocytes (15). CLRs are classified into type I and type II based on the number of conserved carbohydrate-recognition domains (CRDs) (16). Type I CLRs, including the mannose receptor (MR) and CD205, possess multiple CRDs, whereas type II CLRs, such as dendritic cell-specific intercellular adhesion molecule-3-grabbing non-integrin (DC-SIGN) and Macrophage Galactose-Binding Lectin (MGL, CD301), feature a single CRD (17). The MR recognizes antigens with terminal mannose, fucose, glucose, and acetylated glucans (15, 16). Mannosylated phosphatidylethanolamine enhances the binding of liposomes to immature DCs (18, 19). MGL receptor has the capacity to bind to galactose (Gal), N-acetylgalactosamine (GalNAc) and Lewis X (20). Nanoparticles (NPs) modified with GalNAc residues, which could be recognized by MGL receptor (21, 22), can effectively target DCs, accumulate in lymph nodes, and trigger immune responses (23, 24).
Immunostimulants are substances that enhance or modulate the immune response triggered by vaccines by activating the innate immune response (25). Toll-like receptor (TLR) agonists have shown significant adjuvant effects in clinical and animal experiments. They activate specific TLR to initiate signaling pathways, induce the secretion of cytokines and chemokines by DCs, and activate T cells and B cells (26). Additionally, double-stranded DNA molecules (dsDNA) can activate the cyclic GMP-AMP synthase (cGAS)-Stimulator of interferon genes (STING) signaling pathway (27, 28). Upon activation, cGAS can mediate the production of cyclic GMP-AMP (cGAMP), which can be recognized by the STING, inducing the production of IFN-I and promoting the maturation of DCs as well as their migration to the lymph nodes (29, 30). Given the unique contributions of the cGAS-STING pathway to both innate and adaptive immunity, the potential use of agonists of this pathway as vaccine adjuvants has been investigated (31, 32). Studies have shown that immunization of mice with a combination of the M. tuberculosis antigen ESAT-6 and the STING agonist c-di-AMP can reduce the bacterial load in the lungs and spleens of the immunized mice (33). Encapsulating the STING agonist cGAMP in liposomal NPs and nasally immunizing mice with the influenza virus H1N1 subtype vaccine can induce tissue-resident memory T (Trm) cells in the lungs (34). Emily N Chin et al. identified a non-nucleotide, small- molecule STING agonist, called SR717, which can specifically bind to the STING (35). Studies have shown that in mouse models, subcutaneous injection of SR717 can promote the activation of CD8+ T cells, natural killer cells, and DCs in tumor-associated tissues. Furthermore, SR717 enhances antigen cross-priming, showing promise as an immunomodulator with potential applications in cancer therapy and antiviral strategies (36).
Polylactic acid-co-glycolic acid (PLGA) was a widely used biodegradable and biocompatible polymer material (37). It has been extensively utilized in various biomedical applications for many years and is approved by both the U.S. food and drug administration (FDA) and european medicines agency (EMA) (38). This study modified PLGA-PEG NPs with Triantennary N-Acetylgalactosamine (Tri-GalNAc) to target DCs through interaction with MGL receptor on DCs. Additionally, SR717, a STING agonist, was co-encapsulated with M. tuberculosis protein antigens in the PLGA-PEG NPs. The targeting and activation abilities of these NPs on DCs were tested in vitro. Following vaccination, immune responses were investigated, with a particular focus on the T-cell immune memory responses.
2 Materials and methods2.1 MaterialsPLGA (the ratio of lactide: glycolide = 50:50, MW: 40 kDa, Xianruixibio, China). NH2-PEG-N3, NH2-PEG-Alkyne (MW: 2 kDa, Ponsure biotechnology, China). Alkyne-Mannose (MW: 2 kDa, Xianruixibio, China). Anti-CD11c-PerCP-Cy5.5 (eBioscience, USA), anti-CD40-FITC (eBioscience, USA), anti-CD80-PE (eBioscience, USA), anti-CD4-FITC (Biolegend, USA), anti-CD8-FITC (Biolegend, USA), anti-CD8-PE (Biolegend, USA), anti-IL-2-PE (Biolegend, USA), anti-IFN-γ-APC (Biolegend, USA), anti-IL-17A-Percp-Cy5.5 (Biolegend, USA). IL-12p70 Mouse Enzyme-linked immunosorbent assay (ELISA) Kit (Dakewe Biotech Company Ltd., Shenzhen, China), IL-10 Mouse ELISA Kit (Dakewe Biotech Company Ltd., Shenzhen, China). Ovalbumin (OVA) (Solarbio, China), granzyme B Mouse ELISA Kit (Beyotime Biotechnology, China), 7H10 solid medium (Becton, Dickinson and Company, USA), FITC (Solarbio, Beijing, china), DiI (Solarbio, Beijing, china), DiR (Med Chem Express, MCE), DAPI (Solarbio, Beijing, china).
2.2 Animalssix-eight weeks-old female C57BL/6 and Balb/c mice were purchased from the Lanzhou Veterinary Research Institute and housed under specific pathogen-free conditions at Lanzhou University. Animal experiments were conducted following approved from the Institutional Animal Care and Use Committee of Lanzhou University (Approval jcyxy20211202). All experimental procedures were in accordance with the Institutional Animal Care and Use Committee of Lanzhou University.
2.3 Bacterial strainsM. tuberculosis H37Ra (ATCC25177) and Bacillus Calmette-Guerin (BCG, Danish strain) bacteria were donated by Fudan University and Lanzhou Institute of Biological Products respectively. BCG and H37Ra are first inoculated onto Lowenstein-Jensen medium, and after 7-14 days, they are transferred to Sauton’s medium. After 4 weeks, the cultures are centrifuged at 6000 revolutions per minute (rpm) for 10 minutes to harvest the bacteria. The bacterial strains are ground with a sterile grinder to prepare a dispersed bacterial suspension. The bacterial suspension is resuspended in PBS, mixed with 50% glycerol, and aliquoted into 1.5ml Eppendorf tubes, which are then stored at -80°C. One of the frozen bacterial strains is taken out and used to count the colonies on 7H10 solid medium.
2.4 Synthesis of the SR717, PLGA-PEG, Man-PLGA-PEG, and Tri-GalNAc-PLGA-PEG2.4.1 Synthesis of Tri-GalNAc-N3 and SR717On the one hand, the synthesis of the target product, Tri-GalNAc-N3, can be delineated through a series of well-defined chemical reactions. Initially, 6-bromocaproic acid, a cost-effective starting material, undergoes a classical substitution reaction to yield the azide compound 1-1. Simultaneously, trimethylol aminomethane hydrochloride and acrylonitrile are employed as starting materials in a classical Michael reaction, resulting in the formation of intermediate 1-2. This intermediate is subsequently transformed into triester compound 1-3 via hydrochloric acid hydrolysis. Following this, compound 1-1 is subjected to a condensation reaction with 1-3 under HBTU activation conditions, leading to the formation of compound 1-4. This compound then undergoes a series of hydrolysis and condensation reactions to yield intermediate 1-6. In a parallel sequence, D-glucosamine hydrochloride serves as the starting material to produce intermediates 1-11 through functional group transformations and glycosidation reactions. Finally, a straightforward ammoniation reaction with 1-6 facilitates the conversion of the intermediates into the desired target product, Tri-GalNAc-N3 (Supplementary Figure S1) (39).
On the other hand, the synthesis of the SR717 target compound follows a logical sequence of reactions. First, we utilized inexpensive 6-chlorpyridazin-3-methyl formate and imidazole as starting materials in a classical SNAr reaction to produce intermediate 2-1. This intermediate was then condensed with 2-amino-4,5-difluorobenzoate under HATU activation conditions, resulting in the formation of the SR717 precursor compound 2-2. Finally, the target SR717 compound was obtained through saponification hydrolysis using lithium hydroxide (Supplementary Figure S2) (35).
2.4.2 Synthesis of PLGA-PEGThe synthesis of PLGA-PEG (PP) was achieved through an amide reaction by conjugation PLGA-COOH with NH2-PEG, adhering to a two-step procedure detailed in prior literature (40, 41). In the first step, PLGA (0.8 g; 0.02 mmol), EDC-HCl (38.34 mg; 0.2 mmol), and N-Hydroxysuccinimide (NHS) (23 mg; 0.2 mmol) were dissolved in dichloromethane (DCM) and stirred for 24 h at room temperature. The solution was subsequently precipitated by the gradual addition of ice-cold ether. The solid precipitate formed was washed three times using a mixture of ice-cold ether and methanol to eliminate any remaining NHS. 12000 rpm, centrifuged for 20 minutes, collected the solid precipitate and thoroughly dried under vacuum to obtain the activated PLGA. In the second step, PEG-NH2 (0.102 g; 0.03 mmol) and activated PLGA (0.4 g; 0.01 mmol) were dissolved in DCM. Subsequently, DMAP (6 mg; 0.05 mmol), EDC-HCl (19.17 mg; 0.05 mmol), and 60 μL of triethylamine were added to the reaction mixture. The system was allowed to proceed for 24 h at room temperature. Following this, the reaction mixture was precipitated with cold ether and then washed with a mixture of methanol and ether to remove any unreacted PEG-NH2. The precipitated product was collected by centrifugation at 12000 rpm for 20 minutes and then dried under vacuum to yield the final product, PP (Scheme 1A).
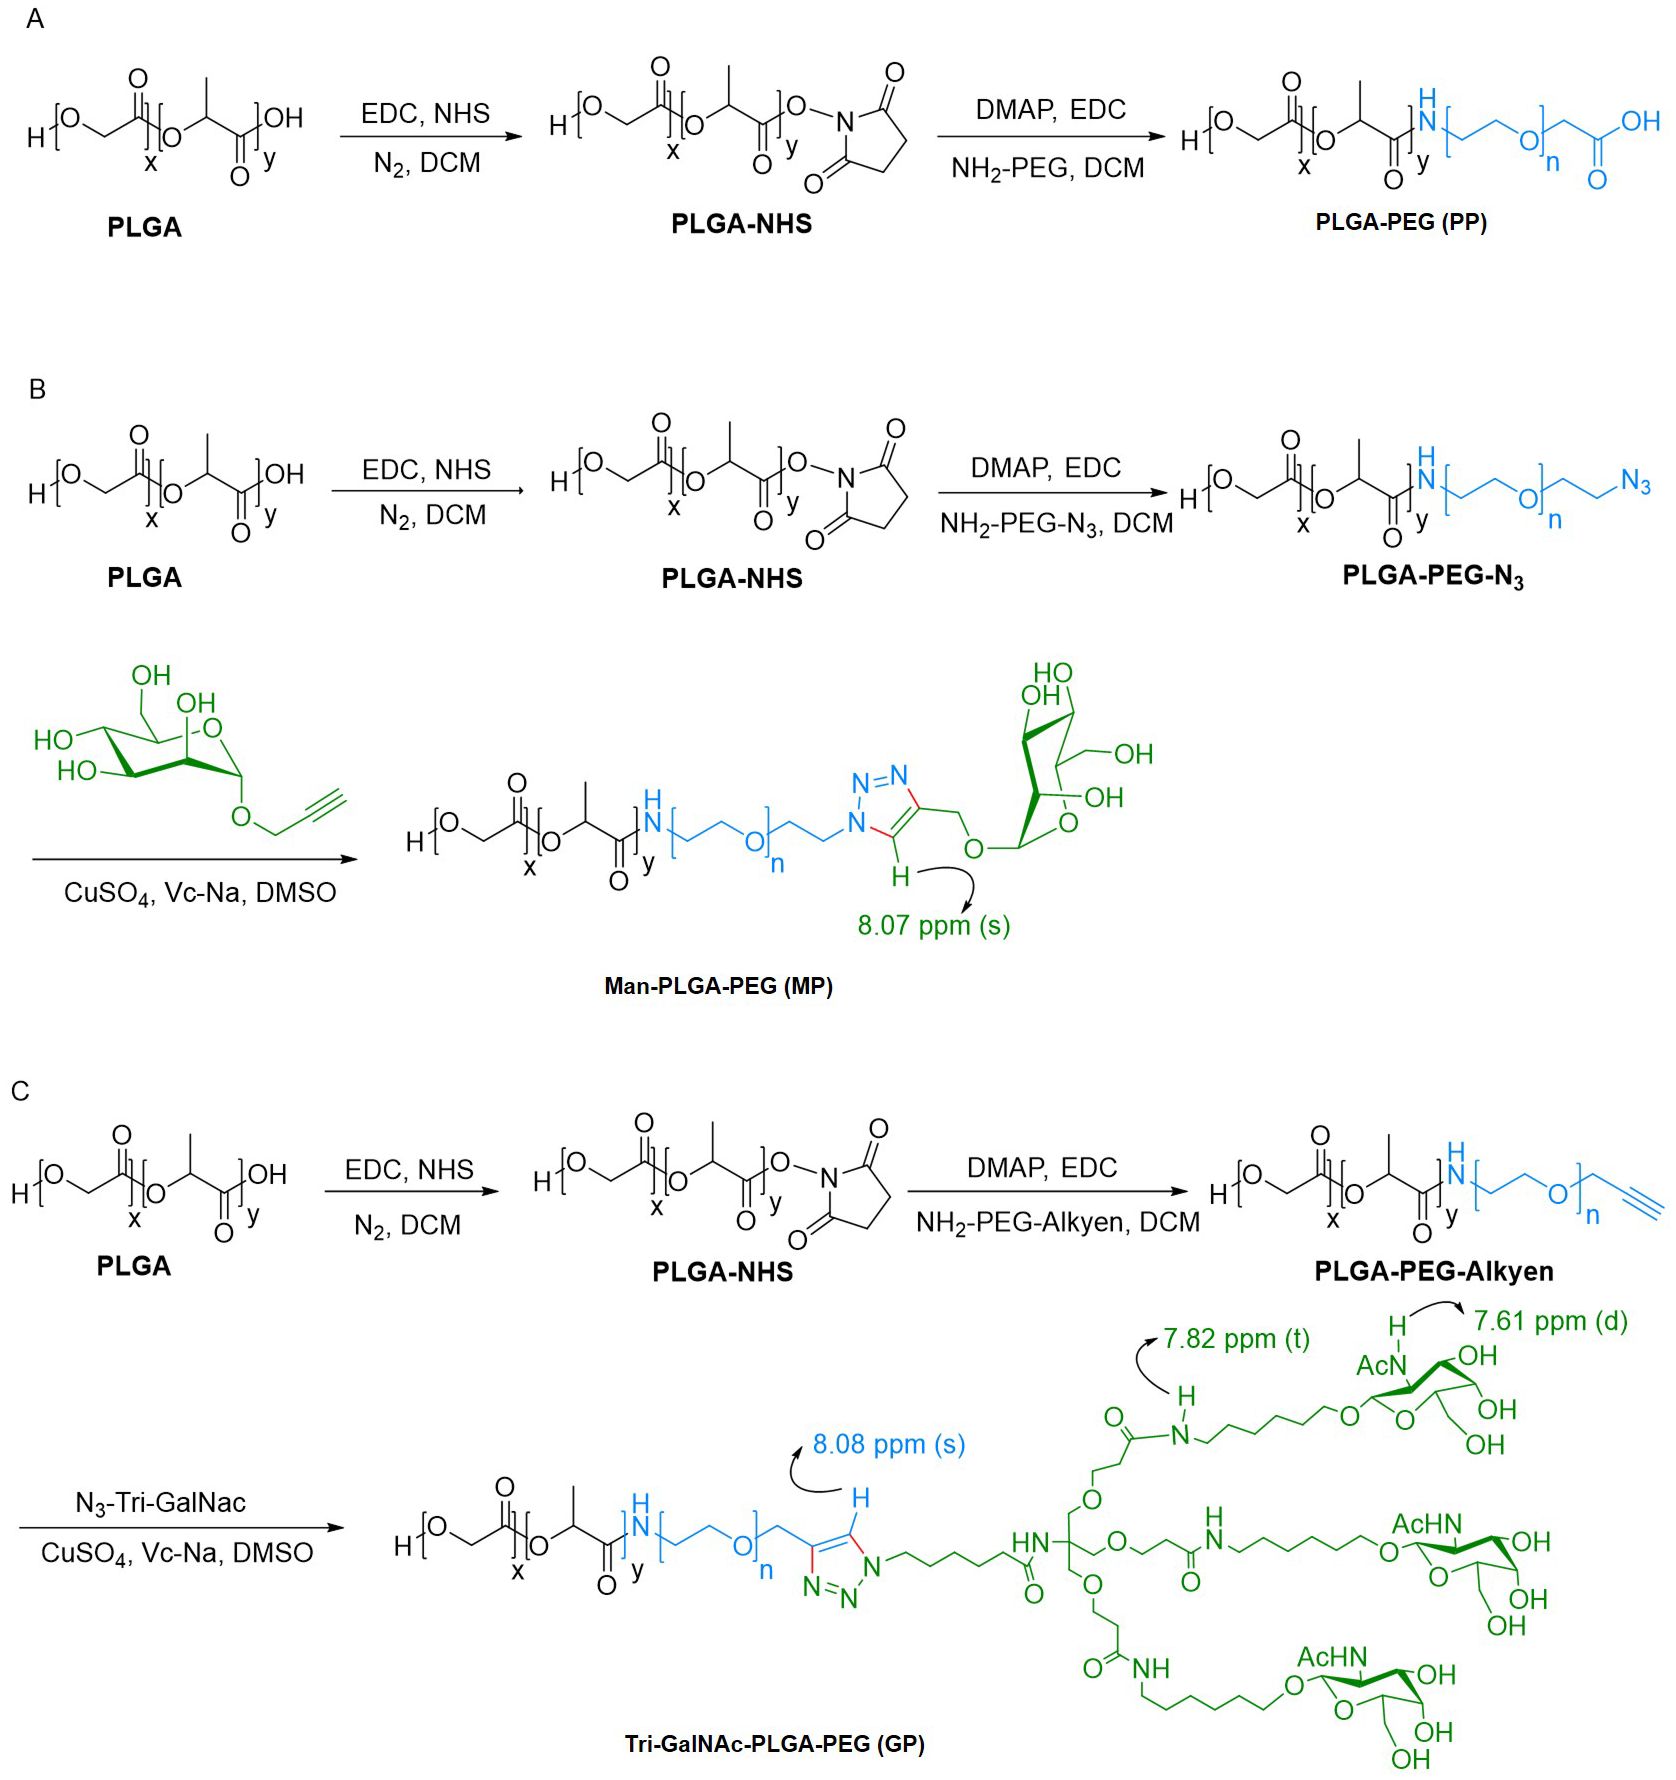
Scheme 1. Synthetic route of PP, MP, and GP. (A) PP was synthesized via amide reaction. (B, C) MP and GP was synthesized through bioorthogonal reaction.
2.4.3 Synthesis of Man-PLGA-PEGThe synthesis of Man-PLGA-PEG (MP) commenced with the reaction of activated PLGA with NH2-PEG-N3, as outlined earlier, to produce PLGA-PEG-N3. Subsequently, MP was synthesized by conjugation PLGA-PEG-N3 with Propargyl α-D-Mannopyranoside through a biorthogonal reaction (42). For this reaction, PLGA-PEG-N3 (0.1 g; 0.0025 mmol), propargyl α-D-mannopyranoside (5.4 mg; 0.025 mmol), and Vc-Na (4.95 mg; 0.025 mmol) were dissolved in dimethylsulfoxide (DMSO). The addition of a catalytic amount of CuSO4 initiated the reaction, and the mixture was stirred for 2 h at room temperature. Ultrapure water was added dropwise to induce precipitation. The precipitate solid was then washed with ultrapure water to remove any excess propargyl α-D-Mannopyranoside. After centrifugation and vacuum drying of the collected solid, MP was obtained (Scheme 1B).
2.4.4 Synthesis of Tri-GalNAc-PLGA-PEGAs previously mentioned, the activated PLGA was reacted with NH2-PEG-Alkyen to yield PLGA-PEG-Alkyen. Following this initial reaction, PLGA-PEG-Alkyen was further reacted with N3-Tri-GalNAc, resulting in the formation of Tri-GalNAc-PLGA-PEG (GP) (Scheme 1C).
2.5 Preparation of NPsOVA or TP and SR717 were encapsulated in PP, MP, or GP using a double emulsion solvent evaporation method to form NPs (41). Briefly, OVA (1 mg) or TP (2mg) was dissolved in 1 mL PBS (aqueous phase), while SR717 (2 mg) and 50 mg PP, MP, or GP were dissolved in 5 mL DCM (organic phase), respectively. Both solutions were sonicated in a ultrasonic processor for 4 min at 500 W in an ice bath using a 2-mm stepped microhead. The secondary emulsion was further emulsified with the aqueous phase containing 2% (w/v) Polyvinyl alcohol (PVA) for 8 min using high pressure homogenizer at 400 bar. The final emulsion was stirred for 4 h to evaporate any DCM. Finally, the NPs were collected by centrifugation at 12,000 × rpm for 20 min and washed three times.
2.6 NPs characterization2.6.1 Particle size and zeta potential analysisDilute the NPs with double-distilled water to prepare a 20-fold dilution to achieve a suitable detection range. The particle size and polydispersity coefficient (PDI) of the particles were then assessed using a Brookhaven Nanoparticle Size Analyzer, operating at a measurement angle of 90° and a temperature of 25°C. Following this, the zeta potential of the NPs was also determined using the same Brookhaven Nanoparticle Size Analyzer.
2.6.2 Encapsulation efficiency and loading percentage of antigen and SR717To calculate the encapsulation rate of the antigen, the protein content in the supernatant was quantified using a bicinchoninic acid (BCA) protein assay kit. The encapsulated protein within the NPs was then calculated by subtracting the protein amount in the supernatant from the total protein present initially. For the detection of SR717 within the NPs, the compound was analyzed using liquid chromatography-mass spectrometry (LC-MS). This analysis was preceded by dissolving the NPs in dimethyl sulfoxide (DMSO) to facilitate the extraction and measurement of SR717.
Encapsulation efficiency (EE)=A/B×100%Loading percentage (LP)=A/C×100%In this context, A represents the amount of protein or SR717 in the NPs, B is the total amount of protein or SR717 added, and C denotes the total mass of the NPs.
2.6.3 Scanning electron microscope analysisTook an appropriate amount of sample and placed them onto the sample column. Allowed it to dry completely. Nest, transferred the sample column to the gold-coating chamber for the gold-coating process. After coating, placed the sample column onto the carrier stage of the JSM-6701F scanning electron microscope (SEM) for observation.
2.6.4 Transmission electron microscope analysisTook an appropriate amount of sample and placed them on a copper grid coated with a carbon support film, allowing them to air dry naturally. Then, apply an appropriate amount of 1% phosphotungstic acid solution for negative staining. Allow the staining solution to adsorb on the grid for a certain period, remove excess staining solution with filter paper, and ensure the sample is completely dry. Finally, place the dried sample under a 200kV biological cryo-transmission electron microscope (TEM) for observation.
2.7 Isolation and culture of bone marrow-derived dendritic cellsBone marrow-derived dendritic cells (BMDCs) were harvested from the femur and tibia of C57BL/6 mice (6–8 weeks) and lysed using red blood cell lysis buffer, following previously described methods (43). The obtained cells were cultured in six-well culture plates (1 × 10⁶ cells/mL; 5 mL per well) in Roswell Park Memorial Institute (RPMI) 1640 complete medium supplemented with 20 ng/mL recombinant mouse granulocyte-macrophage colony-stimulating factor (GM-CSF), and 10 ng/mL IL-4 at 37°C with 5% CO2. On day 2, the entire medium was replaced with fresh RPMI 1640 complete medium that had been supplemented with GM-CSF and IL-4. On day 4, half of the medium was replaced with fresh RPMI 1640 complete medium that had been supplemented with GM-CSF and IL-4. On day 6, non-adherent and loosely adherent cells, identified as immature BMDCs, were harvested for subsequent experiments.
2.8 In vitro growth inhibition assay of NPsTo determine if the NPs could influence the growth of DCs, we utilized BMDCs. Briefly, in a 96-well plate, 100 µL of the NPs, serially diluted to concentrations ranging from 6.25 µg/mL to 800 µg/mL, were added to BMDCs at a final density of 1×10⁴ cells per well. The plates were incubated for 24 h before the addition of 10 µL of CCK8. After a further 2h incubation, the absorbance was measured at 450 nm using a microplate reader. All experiments were performed with at least three replicate wells per group.
2.9 Evaluation of NPs targeting DCs2.9.1 Assessment the delivery of the NPs in vivoBALB/c mice (6–8 weeks) were injected subcutaneously in the inguinal region with either free 1,1-dioctadecyl-3,3,3,3-tetramethylindotricarbocyaine iodide (DIR) or DIR-labeled NPs (500 ug per mouse). NPs kinetics were examined at 12, 24, 48, 72, 96, and 120 h post-injection by a broad-spectrum small animal in vivo optical imaging system with 765-nm excitation and 665-nm emission. Throughout the experiments, mice were anesthetized with 2% isoflurane/O2 (v/v) and maintained under 1% isoflurane/O2 (v/v). Kinetics was measured by quantifying the fluorescent intensity at the injection site and the inguinal lymph node using DPM fluorescence image video analysis software.
2.9.2 Investigation of the NPs uptake by BMDCs in vitro2.9.2.1 The uptake of NPs by BMDCs in vitro was observed using laser confocal scanning microscopy.BMDCs were seeded at a density of 1 × 10⁶ cells per well in confocal dishes and incubated with fluorescein isothiocyanate (FITC)-labeled NPs at a concentration of 250 µg per well for 3 h. Afterward incubation, the cells were washed twice with PBS and fixed with 4% paraformaldehyde. The cell membranes were labeled with 10 μmol of 1,1-Dioctadecyl-3,3,3,3- tetramethylindocarbocyanine iodide (DiI). Subsequently, the cells were washed twice with PBS, and the nuclei were stained with a 10 μg/mL 4',6-Diamidino-2-Phenylindole (DAPI) solution. The subcellular localization of each target signal was observed using a laser scanning confocal microscope.
2.9.2.2 Flow cytometric analysis of the NPs uptake by BMDCs in vitroBMDCs were seeded at a density of 1 × 10⁶ cells per well in 12-well plates and incubated with FITC-labeled NPs at a concentration of 250 µg per well for 3 h. After incubation, the cells were collected and washed three times with PBS. The uptake of NPs was measured using flow cytometry.
2.9.3 Assessment of NPs targeting to DCs of lymph nodes in vivoFemale C57BL/6 mice (6–8 weeks) were immunized subcutaneously with DiI-labeled NPs at a dose of 500 µg per mouse. Mice injected with PBS served as controls. 40 h post-immunization, the inguinal lymph nodes were collected and gently ground to release immune cells. For detecting DCs uptake, the collected immune cells were first stained with anti-CD11c-PerCP-Cy5.5 for 30 min at 4°C, followed by flow cytometry analysis.
2.10 Evaluation of NPs’ activation of DCs2.10.1 Evaluation for the activation and maturation of BMDCs by NPs in vitroPrior to stimulation, induced BMDCs were seeded into 12-well plates at a density of 1×10⁶ cells per well. On the following day, OVA (6 μg/well), SR717 (10 μg/well), LPS (100ng/well) and NPs (OVA content was 6 μg/well, SR717 content was 10 ug/well) were added to co-culture for 24 h, respectively, and three replicate wells were set up in each group. After incubation, the supernatants were collected for detection of cytokines. The presence of secreted IL-12p70 and IL-10 cytokines was quantified using a specific ELISA kit, strictly adhering to the manufacturer’s instructions. For phenotypic analysis, BMDCs were harvested and co-stained with anti-CD11c-PerCP-Cy5.5, anti-CD40-FITC, and anti-CD80-PE antibodies for 30 min at 4°C. Finally, the stained cells were analyzed using flow cytometry.
2.10.2 Evaluation for the activation of DCs by NPs in lymph node in vivoFemale C57BL/6 mice (6–8 weeks) were immunized subcutaneously with NPs containing 6 µg of OVA and10 µg of SR717. Mice injected with PBS served as controls. 48 h post-immunization, inguinal lymph node cells were collected, and subsequently stained with anti-CD11c-PerCP-Cy5.5 and anti-CD40-FITC for 30 min at 4°C. The stained cells were then analyzed using flow cytometry.
2.11 Evaluation of the immunogenicity and protective efficacy of M. tuberculosis fusion protein NPs2.11.1 Preparation of M. tuberculosis fusion protein NPsM. tuberculosis fusion protein LT33 (ESAT6-CFP10-Rv1738) and LT57 (Rv0518-Rv2541) (44) were prepared as previous described (Supplementary Figure S6). To prepare the M. tuberculosis fusion protein LT33+LT57 (TP) NPs (TP/NPs), we replaced OVA (1mg) with TP (2mg) and added SR717 (20mg), following the procedure outlined in section 2.5. Different types of NPs were produced, including TP/PP (TP/PLGA-PEG), TP/GP (TP/Tri-GalNAc-PLGA-PEG), and TP/GPS (TP/Tri-GalNAc-PLGA-PEG-SR717).
2.11.2 TP/NPs immunization scheduleMice were divided into six groups: TP, TP/PP, TP/GP, TP/GPS, BCG, and PBS control. The BCG group received an initial injection at week 0, while other groups were immunized at weeks 0, 3, and 6. The BCG group was given 5 × 10⁶ CFU; the TP, TP/PP, TP/GP, and TP/GPS groups received 10 µg of protein per immunization; the TP/GPS group also received 200 µg of SR717 per immunization. Immune responses were measured 6 weeks after the final dose, and immune memory was assessed 12 weeks later. Protective efficacy was evaluated through an intranasal challenge with avirulent M. tuberculosis H37Ra (5×10⁶ CFU per mouse) at 12 weeks after the final dose (Supplementary Figure S7).
2.11.3 Detection of antigen-specific T cells induced by TP/NPsSix weeks after the final vaccination, the T cell immune response induced by the TP/NPs was evaluated by detecting the secretion of cytokines from splenic lymphocytes using intracellular cytokine staining (ICS) (45). The specific procedure is as follows: lymphocytes isolated from the spleens were cultured at a density of 5 × 10⁶ cells per well in a 24-well plate. The cells were stimulated with individual antigens of TP (10 μg/mL) for 12 h at 37°C in a 5% CO2 environment. Following stimulation, the cells were blocked by 10% fetal bovine serum (FBS), and stained for surface markers with anti-CD4-FITC. The cells were then permeabilized using the BD Cytofix/Cytoperm kit and stained intracellularly with anti-IL-2-PE and anti-IL-17A-PerCP-Cy5.5, according to the manufacturer’s instructions, and analyzed by flow cytometry. The level of granzyme B secreted by lymphocytes was measured with an ELISA kit.
Memory T cells are categorized into central memory T (TCM) cells and effector memory T (TEM) cells. TCM cells can survive for several years, while TEM cells are short-lived, typically surviving for 4 to 8 weeks, and provide immediate but temporary protection (46, 47). To observe long-lived memory T cells induced by TP/NPs, T cell-mediated immune responses were analyzed 12 weeks after the final vaccination as previously described (46). Mice were injected subcutaneously with 10 µg of the individual antigens of TP antigen to promote the differentiation of TCM-like long-term memory T cells into TEM cells or effector T cells (Teff) in vivo, 3 days prior to immune detection. After euthanasia, spleen cells were isolated and stimulated in vitro with individual antigens of TP antigens (10 µg/m) for 12 h. During this period, TEM cells developed into Teff cells and secreted cytokines. As described in 2.11.3, intracellular cytokine staining was analyzed using flow cytometry, and the level of granzyme B secreted by lymphocytes was measured with an ELISA kit, to indirectly assess the functionality of memory T cells. Flow cytometry gating strategy was shown in Supplementary Figures S8A, B.
2.11.4 EdU proliferation assay for memory T cells induced by TP/NPs5-Ethynyl-2’-deoxyuridine (EdU) is incorporated into the DNA of proliferating T cells and can be detected after memory T cells have undergone proliferation and division. 12 weeks after the final immunization, mice were subcutaneously immunized with 10 µg of individual antigens of TP antigens. 3 days later, splenic lymphocytes were collected and treated with individual antigens of TP antigens and EdU (10 µM) at a density of 5×10⁶ cells per well in a 24-well plate for 3 days. Following the manufacturer’s instructions for the Click-iT™ EdU flow cytometry detection kit, the cells were harvested, fixed, permeabilized, and incubated with Click-iT reaction buffer. Subsequently, the cells were stained with anti-CD4-FITC and anti-CD8-PE antibodies. Flow cytometry was then performed to assess the proliferation capacity of CD4+T and CD8+T cells. Flow cytometry gating strategy was shown in Supplementary Figure S8C.
2.11.5 Detection of specific antibodies in serum of miceAt 6 weeks after the last immunization, antigen-specific immunoglobulin IgG, IgG1, and IgG2c were detected in serum using an ELISA. First, 0.5 µg/well of LT33 or LT57 was added to the plates and incubated overnight at 4°C. The plates were then blocked with 5% skimmed milk powder and incubated with serially diluted serum samples at 37°C for 2 h. After washing, 100 µL of a 1:8000 dilution of goat anti-mouse IgG, rabbit anti-mouse IgG1, and rabbit anti-mouse IgG2c were added to each well. The reaction was developed by adding 100 µL of 3,3′,5,5′-tetramethylbenzidine (TMB) substrate and incubating at room temperature for 10 min. The reaction was then stopped by adding 50 µL of diluted sulfuric acid (1 mol/L) per well. The optical density was quantified at 450 nm. Serum from the PBS group served as the negative control. The antibody titer was determined by identifying the highest serum dilution with optical density value greater than 2.1 times that of the negative control, and the geometric mean titer (GMT) was calculated.
2.11.6 M. tuberculosis H37Ra infection and bacteria-load detectionMice were anesthetized intraperitoneally with 1% sodium pentobarbital at a dose of 50 mg/kg. Each group of mice was infected intranasally with 5 × 10⁶ CFU of H37Ra. 3 weeks after the intranasal infection, the lungs of the infected animals were harvested. The organs were ground and resuspended in PBS, and the resulting dilutions were plated on Middlebrook 7H10 plates containing oleic acid/albumin/dextrose/catalase (OADC). The colony-forming units (CFU) were subsequently counted.
2.12 Statistical analysisData were evaluated using GraphPad Prism 8.0 software, and the unpaired two-tailed Student′s t-test was used for two-group comparisons, and one-way analysis of variance (ANOVA) was used for multiple group comparisons, followed by Tukey’s post-hoc test. The differences were considered statistically significant at p < 0.05.
3 Results3.1 Characterization of PP, MP, and GPPP was synthesized through an NHS ester coupling reaction, while MP and GP were synthesized via bioorthogonal reactions, as illustrated in Scheme 1. The chemical structures of PP, MP and GP are shown in Figure 1A. Their 1H-NMR spectrums are shown in Figure 1, with peaks labeled to correspond to specific proton signals according to their molecular structures. For PP, the characteristic peaks include peak a (5.21 ppm, -OCH(CH3) CONH-), peak b (1.48 ppm, -OCH(CH3) CONH-), peak c (4.92 ppm, -OCH2COO-), and peak d (3.52 ppm, -CH2CH2O-) (Figure 1B). MP exhibits similar peaks to PP, with the additional peak e (8.07 ppm, -CH-) (Figure 1C). The mannose moiety, primarily localized at the polymer’s terminus, results in relatively subdued peak intensities, with characteristic signals ranging from 3.0 to 4.0 ppm. The spectrum of GP extends that of MP, with the additional peak f (7.82 ppm, NH-) and peak g (7.61 ppm, -NHAc-) (Figure 1D). In the 1H-NMR spectrums, the characteristic peaks of mannose and Tri-GalNAc are overshadowed by those of PP; however, MP and GP were confirmed by a distinct triazole peak at 8.07 ppm.
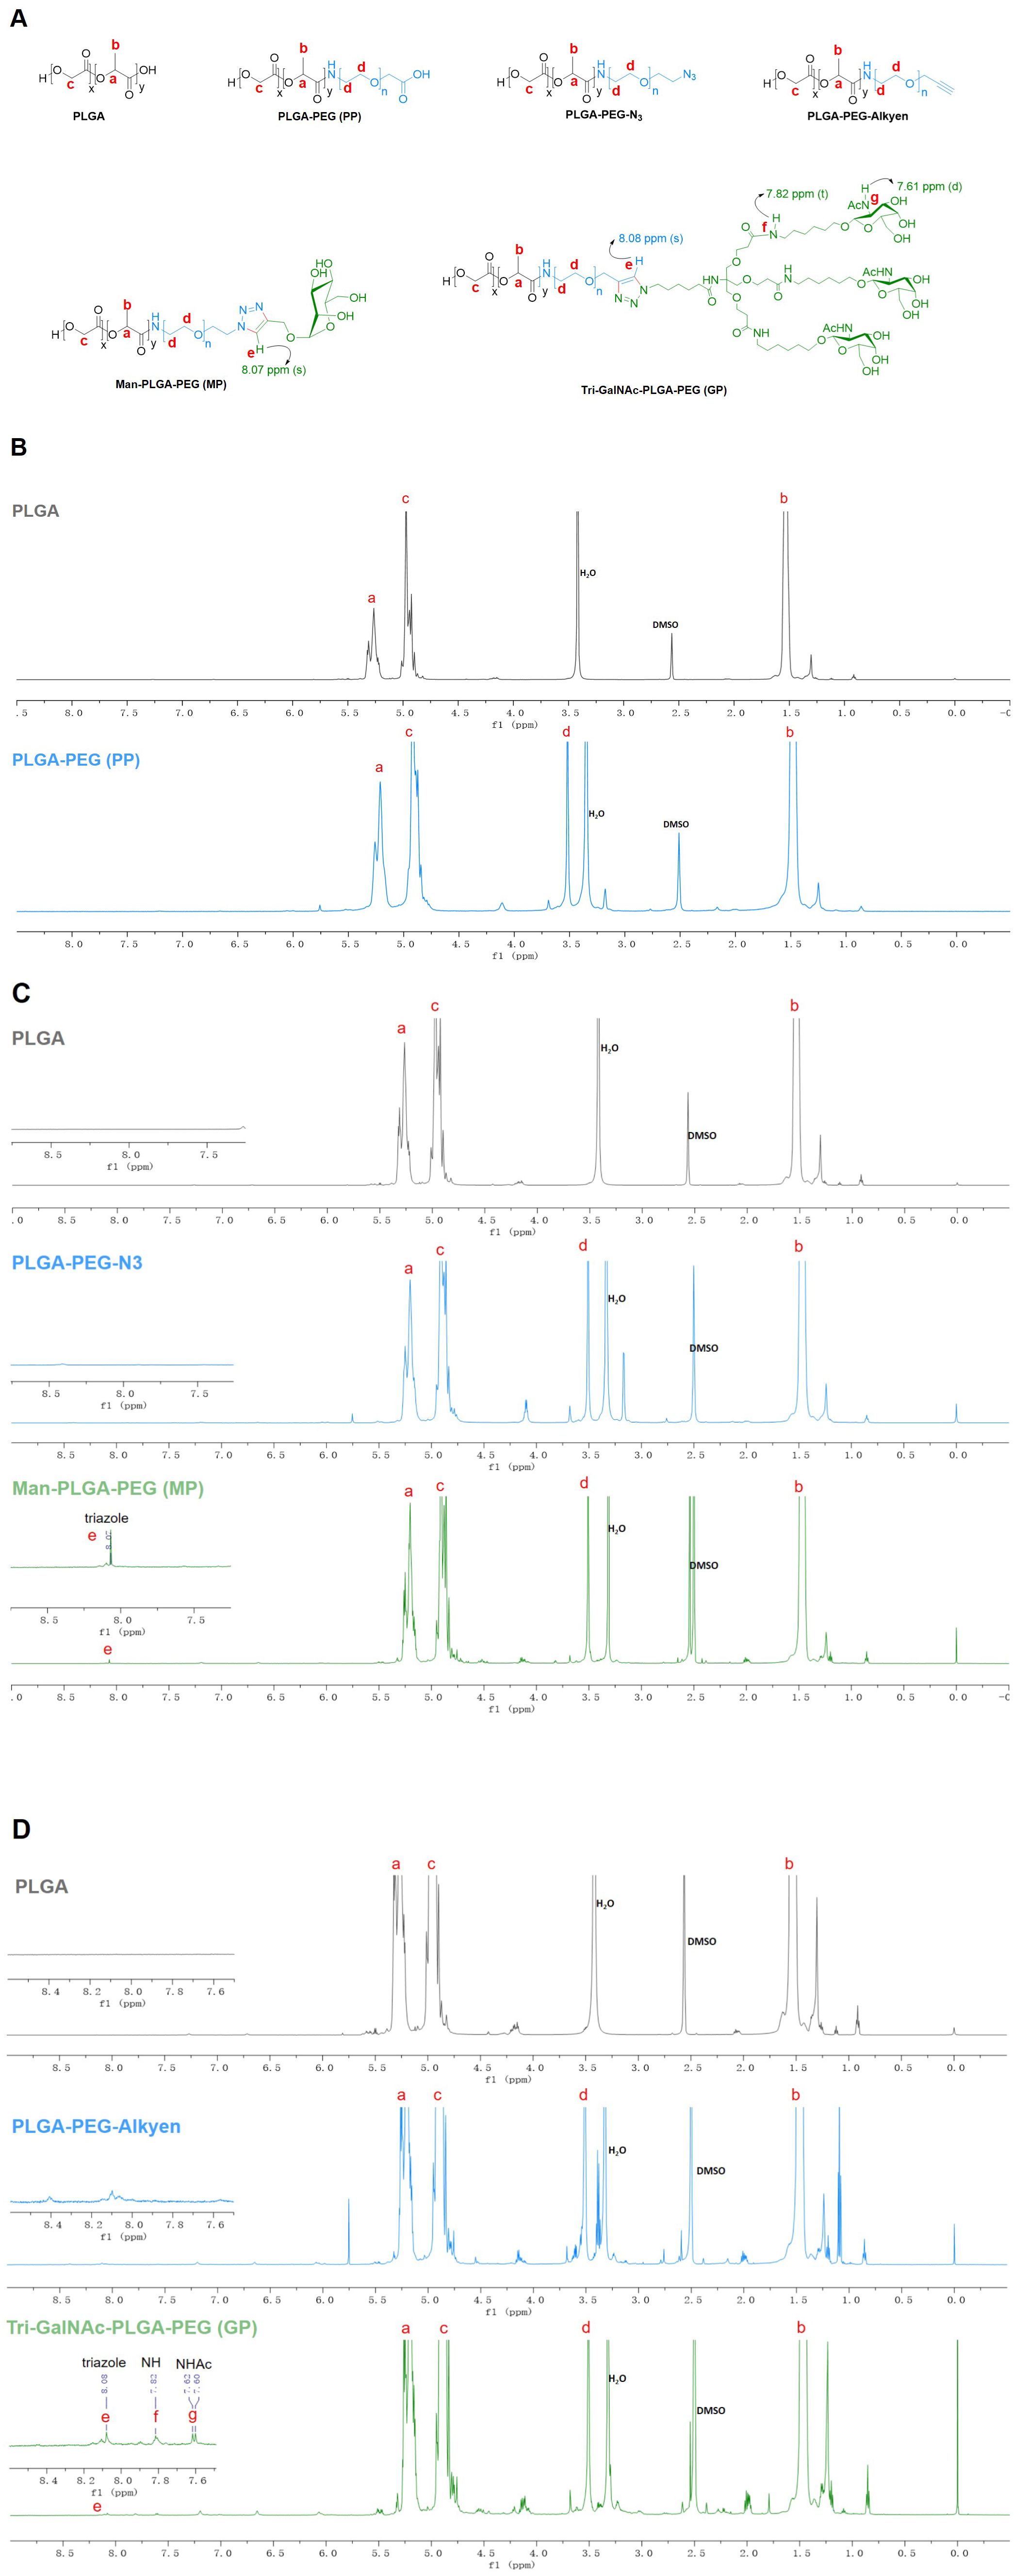
Figure 1. 1H NMR spectra of PP, MP, and GP. The PP, MP, and GP were dissolved in DMSO-d6 at a concentration of 10mg/mL, and their chemical composition were characterized using 1H NMR spectral analysis. (A) Chemical structures of different compounds. (B) 1H NMR spectra of PLGA and PLGA-PEG (PP). (C) 1H NMR spectra of PLGA, PLGA-PEG-N3, and Man-PLGA-PEG (MP). (D) 1H NMR spectra of PLGA, PLGA-PEG-Alkyen, and Tri-GalNAc-PLGA-PEG (GP).
3.2 Characterization of NPsOVA and SR717 were encapsulated in PP, MP, or GP using a double emulsion solvent evaporation method to form NPs. These NPs were characterized by particle size measurements and zeta potential measurements using dynamic light scattering (DLS) at 25°C. The average diameter of these NPs ranged from 200 to 300 nm, and their zeta potentials were all negative. SEM and TEM images revealed that these NPs were spherical and exhibit a relatively uniform size (Figure 2). The EE and LP of OVA were calculated by measuring the protein content in the supernatant using a BCA protein assay kit. Similarly, the EE and LP of SR717 were assessed using a LC-MS after dissolving the NPs in DMSO (Table 1). These PLGA-PEG NPs showed a relatively higher EE and LP. The EE of OVA reached approximately 60%, with an LP of about 1%. For SR717, the EE was around 60%, with an LP of about 2%.
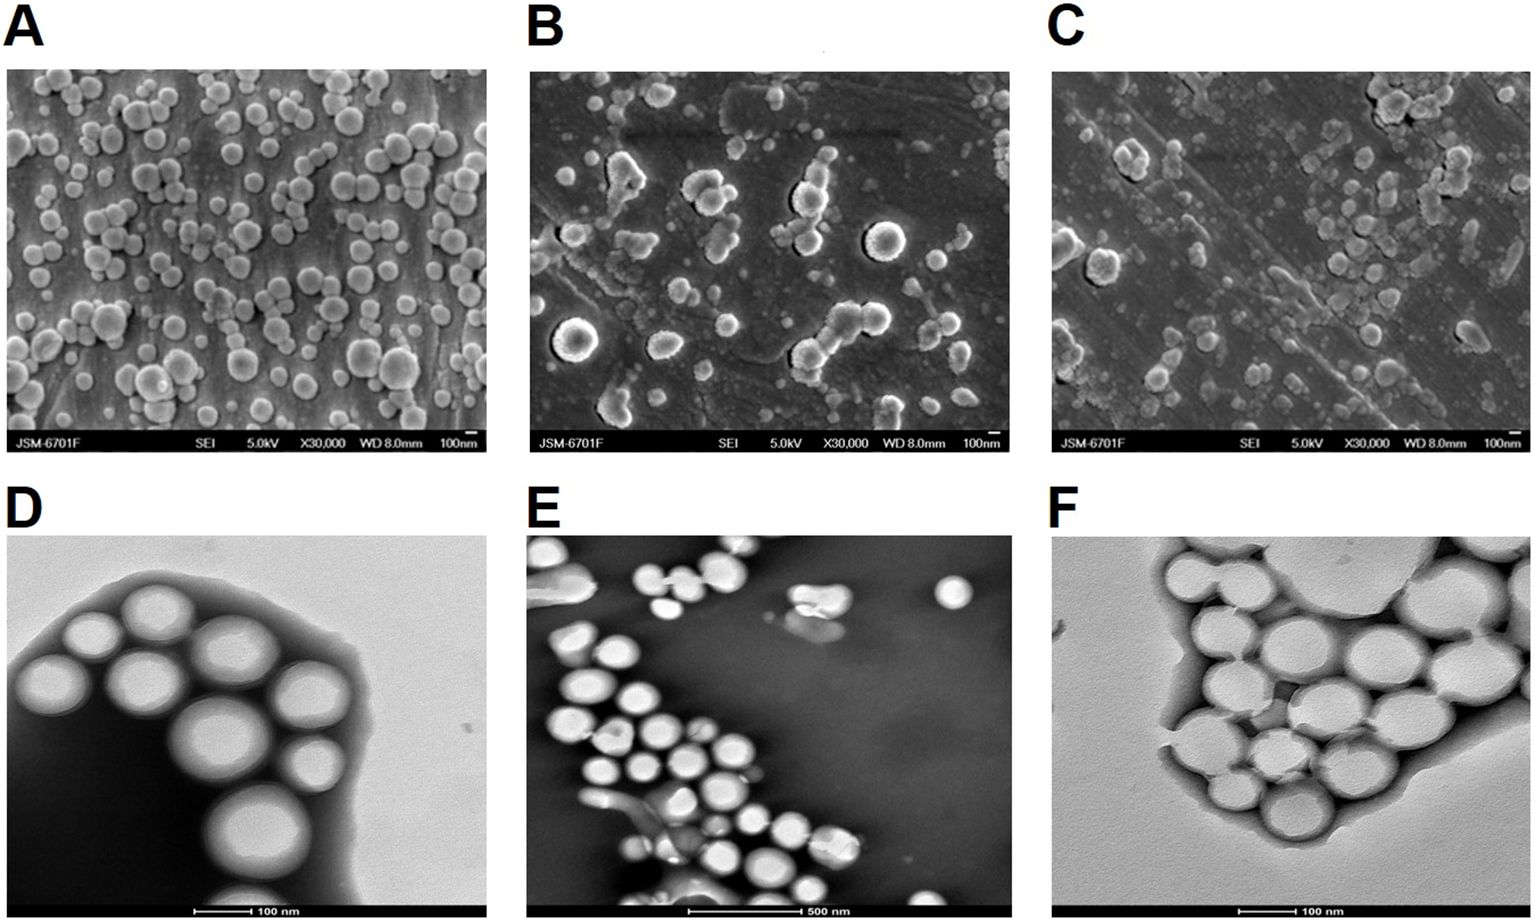
Figure 2. SEM and TEM analysis of PLGA-PEG NPs. The morphology of the NPs was observed using a JSM-6701F model scanning electron microscope (SEM) and 200kV biological cryo-transmission electron microscope (TEM). SEM image of (A) OVA/PPS; (B) OVA/MPS; (C) OVA/GPS. TEM image of (D) OVA/PPS; (E) OVA/MPS; (F) OVA/MPS.
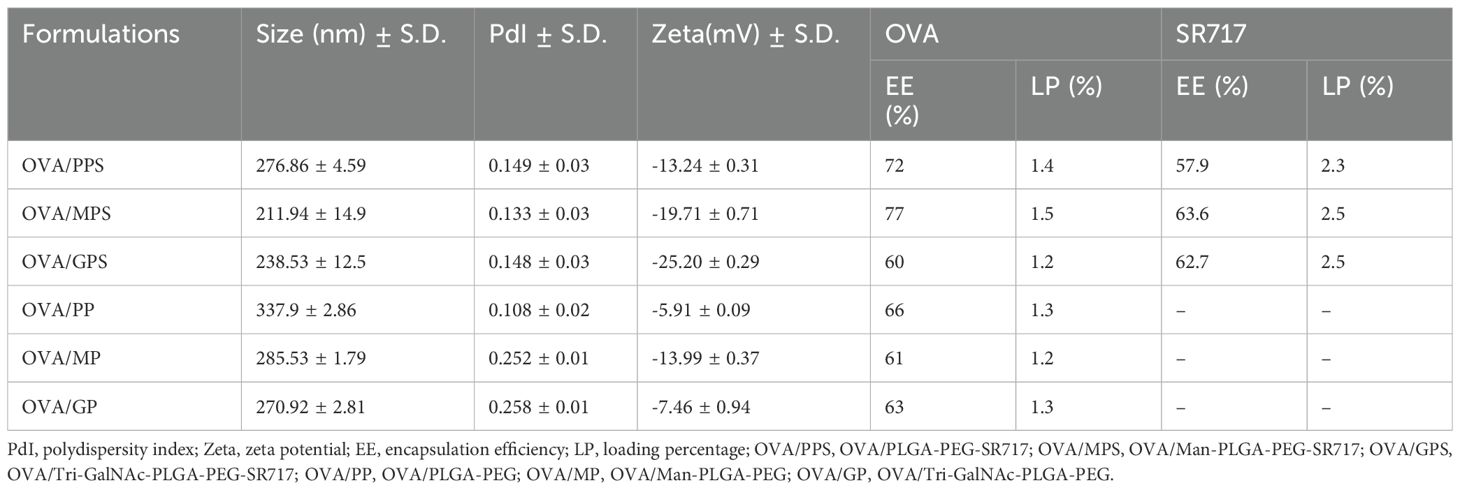
Table 1. Physicochemical characterization of NPs.
3.3 OVA/GP are targeted to lymph nodes in vivoTo track the delivery of the NPs in vivo, the mice were injected subcutaneously in the groin with free DIR in PBS, DIR-labeled OVA/PP(DIR-OVA/PP), DIR-labeled OVA/MP(DIR-OVA/MP), and DIR-labeled OVA/GP(DIR-OVA/GP). The presence of DIR-NPs was visualized at the injection site and in the inguinal lymph node. Figure 3A shows representative images of fluorescence signals corresponding to DIR-NPs at the injection site at designated time points. The fluorescence signals at the injection site were quantified and the average fluorescence intensity were plotted over time and presented in Figure 3B. The results showed that the fluorescence intensity of free DIR gradually decreased over time. In contrast, the fluorescence intensity of DIR-OVA/PP, DIR-OVA/MP, and DIR-OVA/GP declined slowly. Significant fluorescent signals were observed in the lymph nodes of mice injected with DIR-OVA/MP and DIR-OVA/GP 24h after immunization and persisted until 120h (Figure 3C). At 120h post-immunization, the presence of DIR-OVA/GP was also detected in the spleens of mice (Figure 3C). A quantitative analysis of the fluorescence intensity in the inguinal lymph nodes 120h post-immunization indicated that DIR-OVA/GP accumulated more in the lymph nodes than free DIR, DIR-OVA/PP, and DIR-OVA/MP (p<0.01) (Figure 3D). Furthermore, the livers of the mice immunized with NPs exhibited fluorescent signals, with the most intense signals observed in those immunized with the DIR-OVA/GP (Figure 3C). 40 h after immunization with DiI-labeled NPs in the inguinal region, the accumulation of OVA/GPS was also detected in the mouse inguinal lymph nodes using flow cytometry (Supplementary Figure S4).
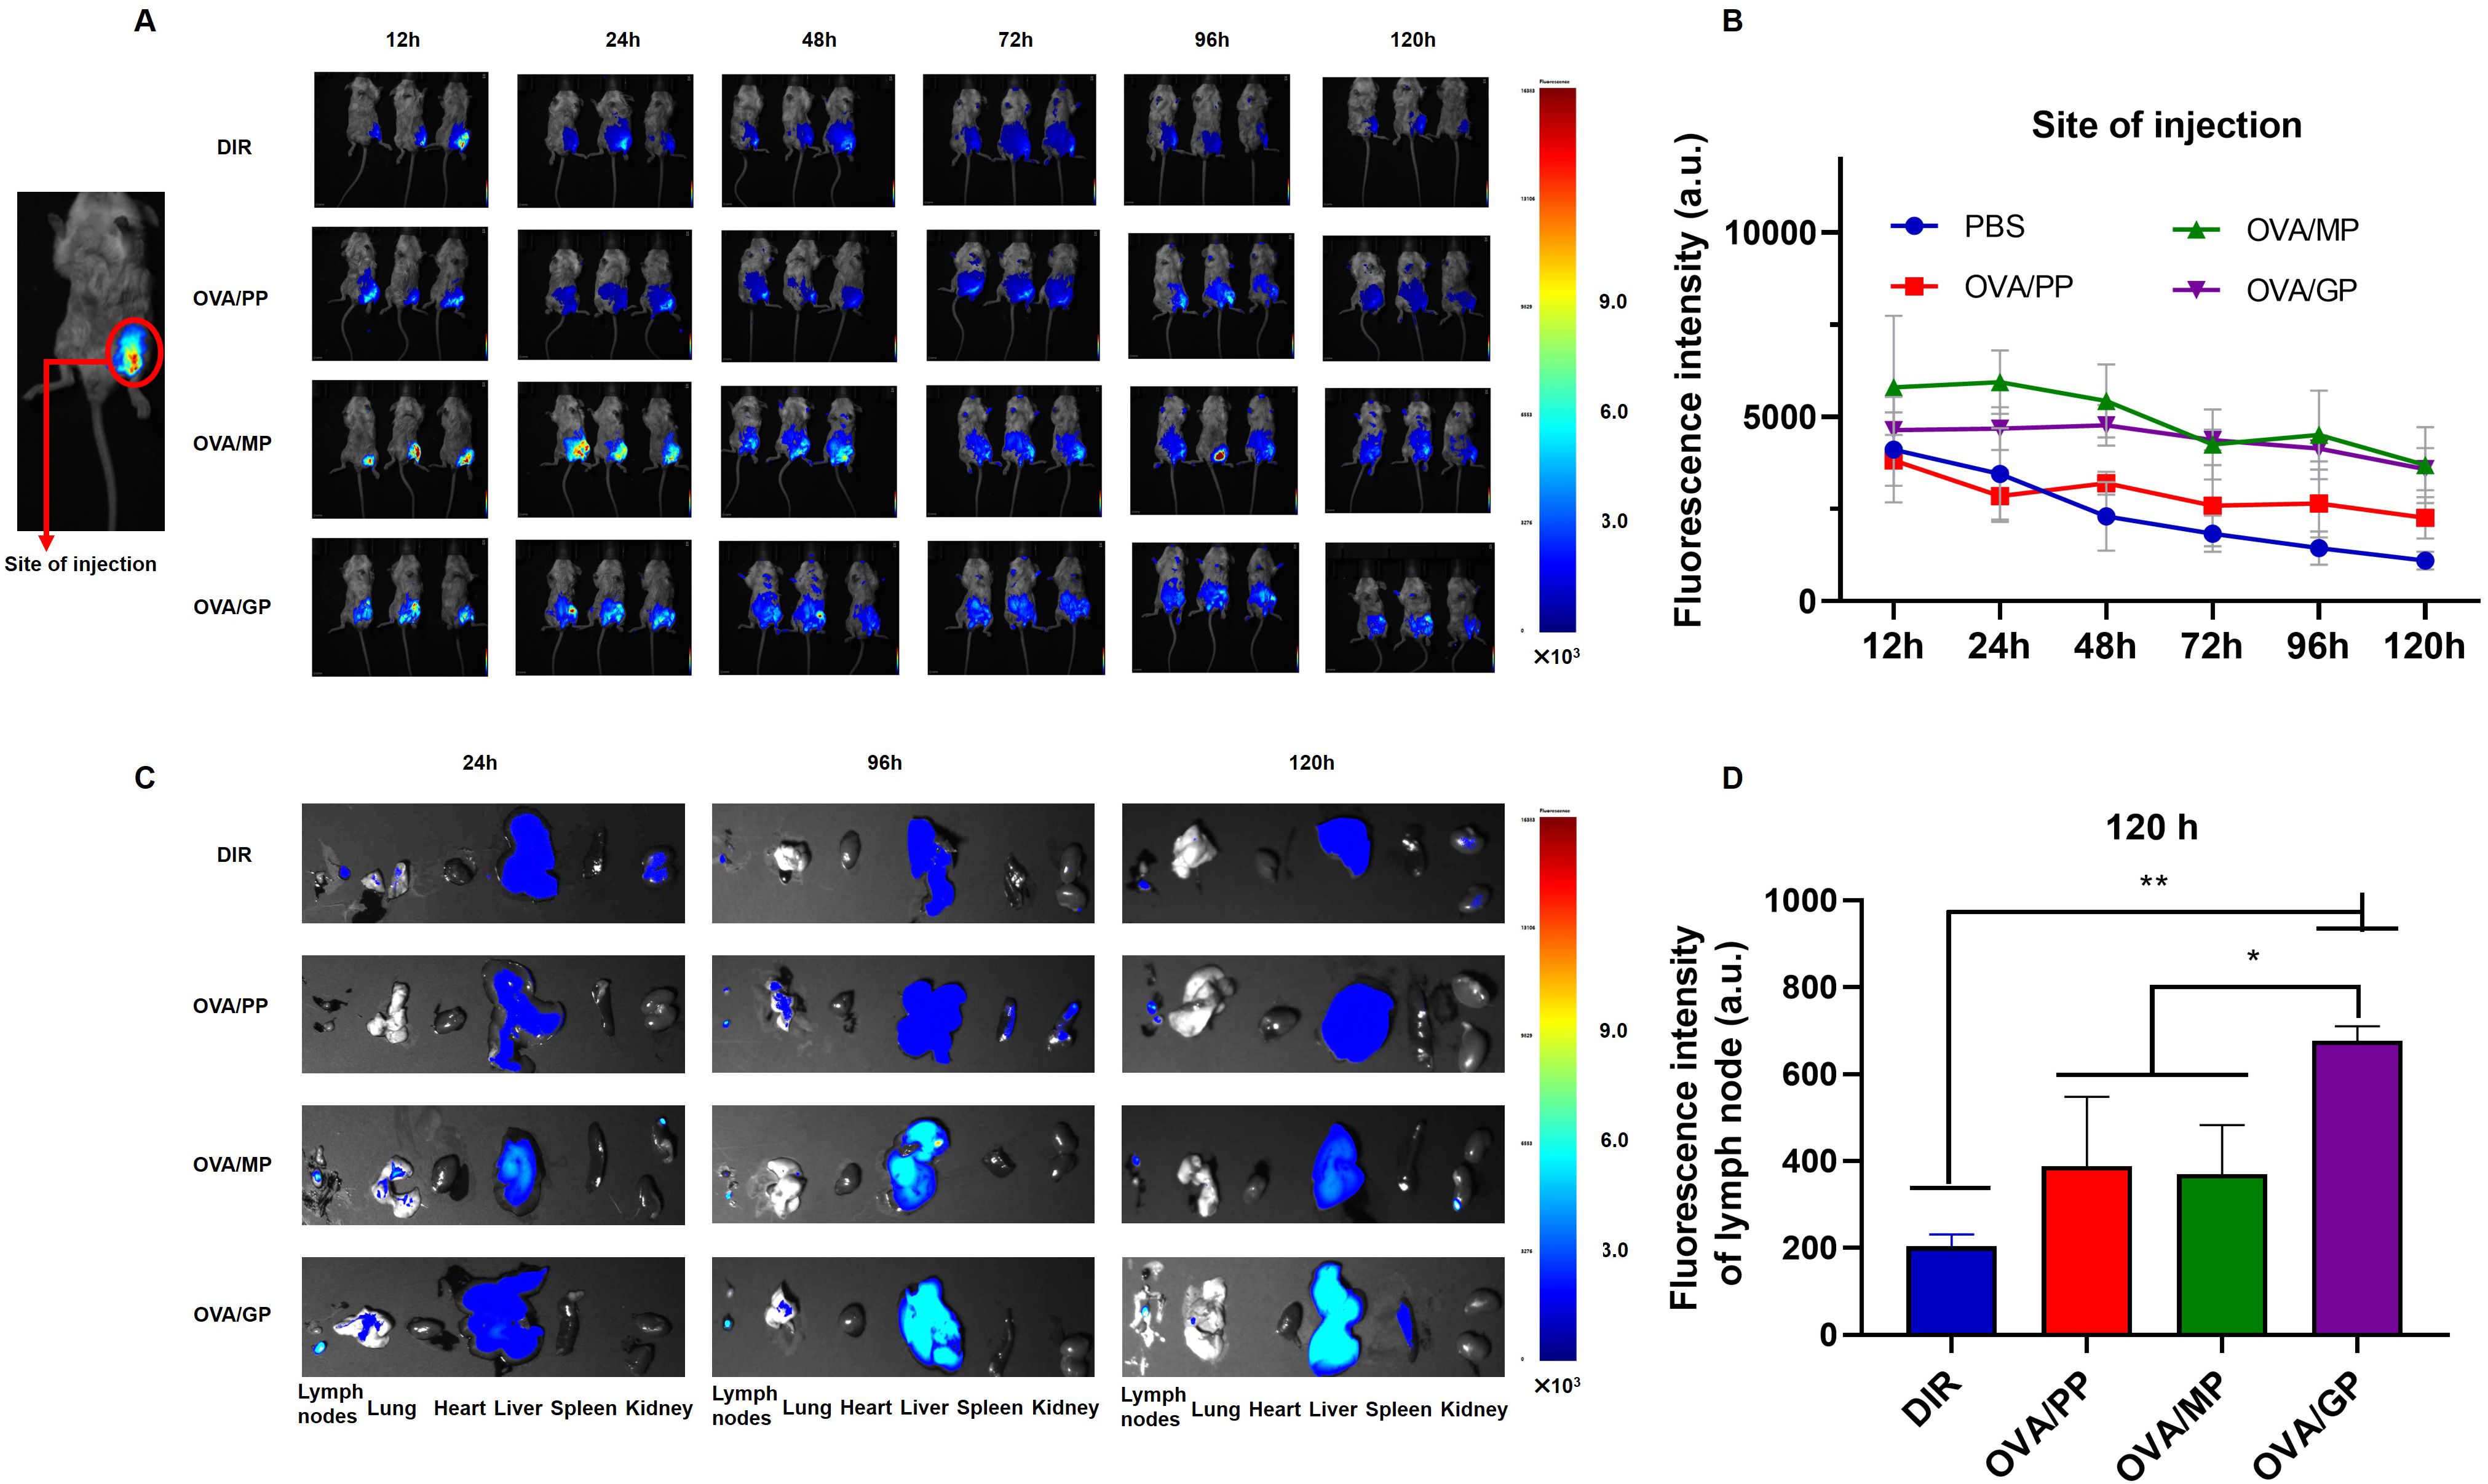
Figure 3. OVA/GP effectively target lymph nodes in mice. (A) The images of DIR-NPs in the injection site after injection for 12, 24, 48, 72, 96 and 120h. (B) The fluorescent intensity of DIR on the injection site at different time points after injection. (C) The images of DIR-NPs in the isolated major organs after injection for 24, 96, and 120 h. (D) The fluorescent intensity of DIR in the inguinal lymph nodes at 120 h post-immunization. All images were overlays of bright photographs with fluorescence intensity measurement indicated on the color scale. The results are shown as means ± SD (n=3-6), *p < 0.5, **p < 0.01.
3.4 OVA/GPS promote the activation of DCs in vitroTo assess the activation of DCs, the cytokines including IL-12p70 and IL-10 secreted by BMDCs was evaluated after treatment with NPs that were encapsulated with or without SR717 for 24 h. The results indicated that compared to the OVA/PP group, the secretion levels of IL-12p70 in the OVA/MP and OVA/GP groups were increased (p < 0.001), but still lower than those in the LPS-stimulated group (p < 0.001) (Figure 4A). To further promote the maturation of DCs, the agonist SR717 was attempted to encapsulate in NPs. The results indicated that the addition of SR717 significantly increased the IL-12p70 secretion by BMDCs in the OVA/MPS and OVA/GPS groups, exceeding the levels in the LPS group (p < 0.001) (Figure 4B). Among all group, the LPS induced the highest level of IL-10 secretion (p < 0.001) (Figures 4C, D). Subsequently, the expression levels of CD40 and CD80 on the surface of BMDCs were assessed. Compared to the PBS, OVA, and SR717, OVA/PPS, OVA/MPS, and OVA/GPS all induced the expression of CD40 and CD80 (p < 0.01). Among these, the expression levels of CD40 and CD80 on BMDCs were highest in the OVA/GPS group, with the OVA/PPS and OVA/MPS groups showing the next highest levels (p < 0.05) (Figures 4E–G). Furthermore, after immunization with OVA/GPS, the expression of CD40 on DCs in mouse inguinal lymph nodes increased compared to the PBS group, as detected by flow cytometry (Supplementary Figure S5). The findings indicate that the targeted modification of PLGA-PEG NPs, in conjunction with an agonist, effectively promote the maturation of DCs.
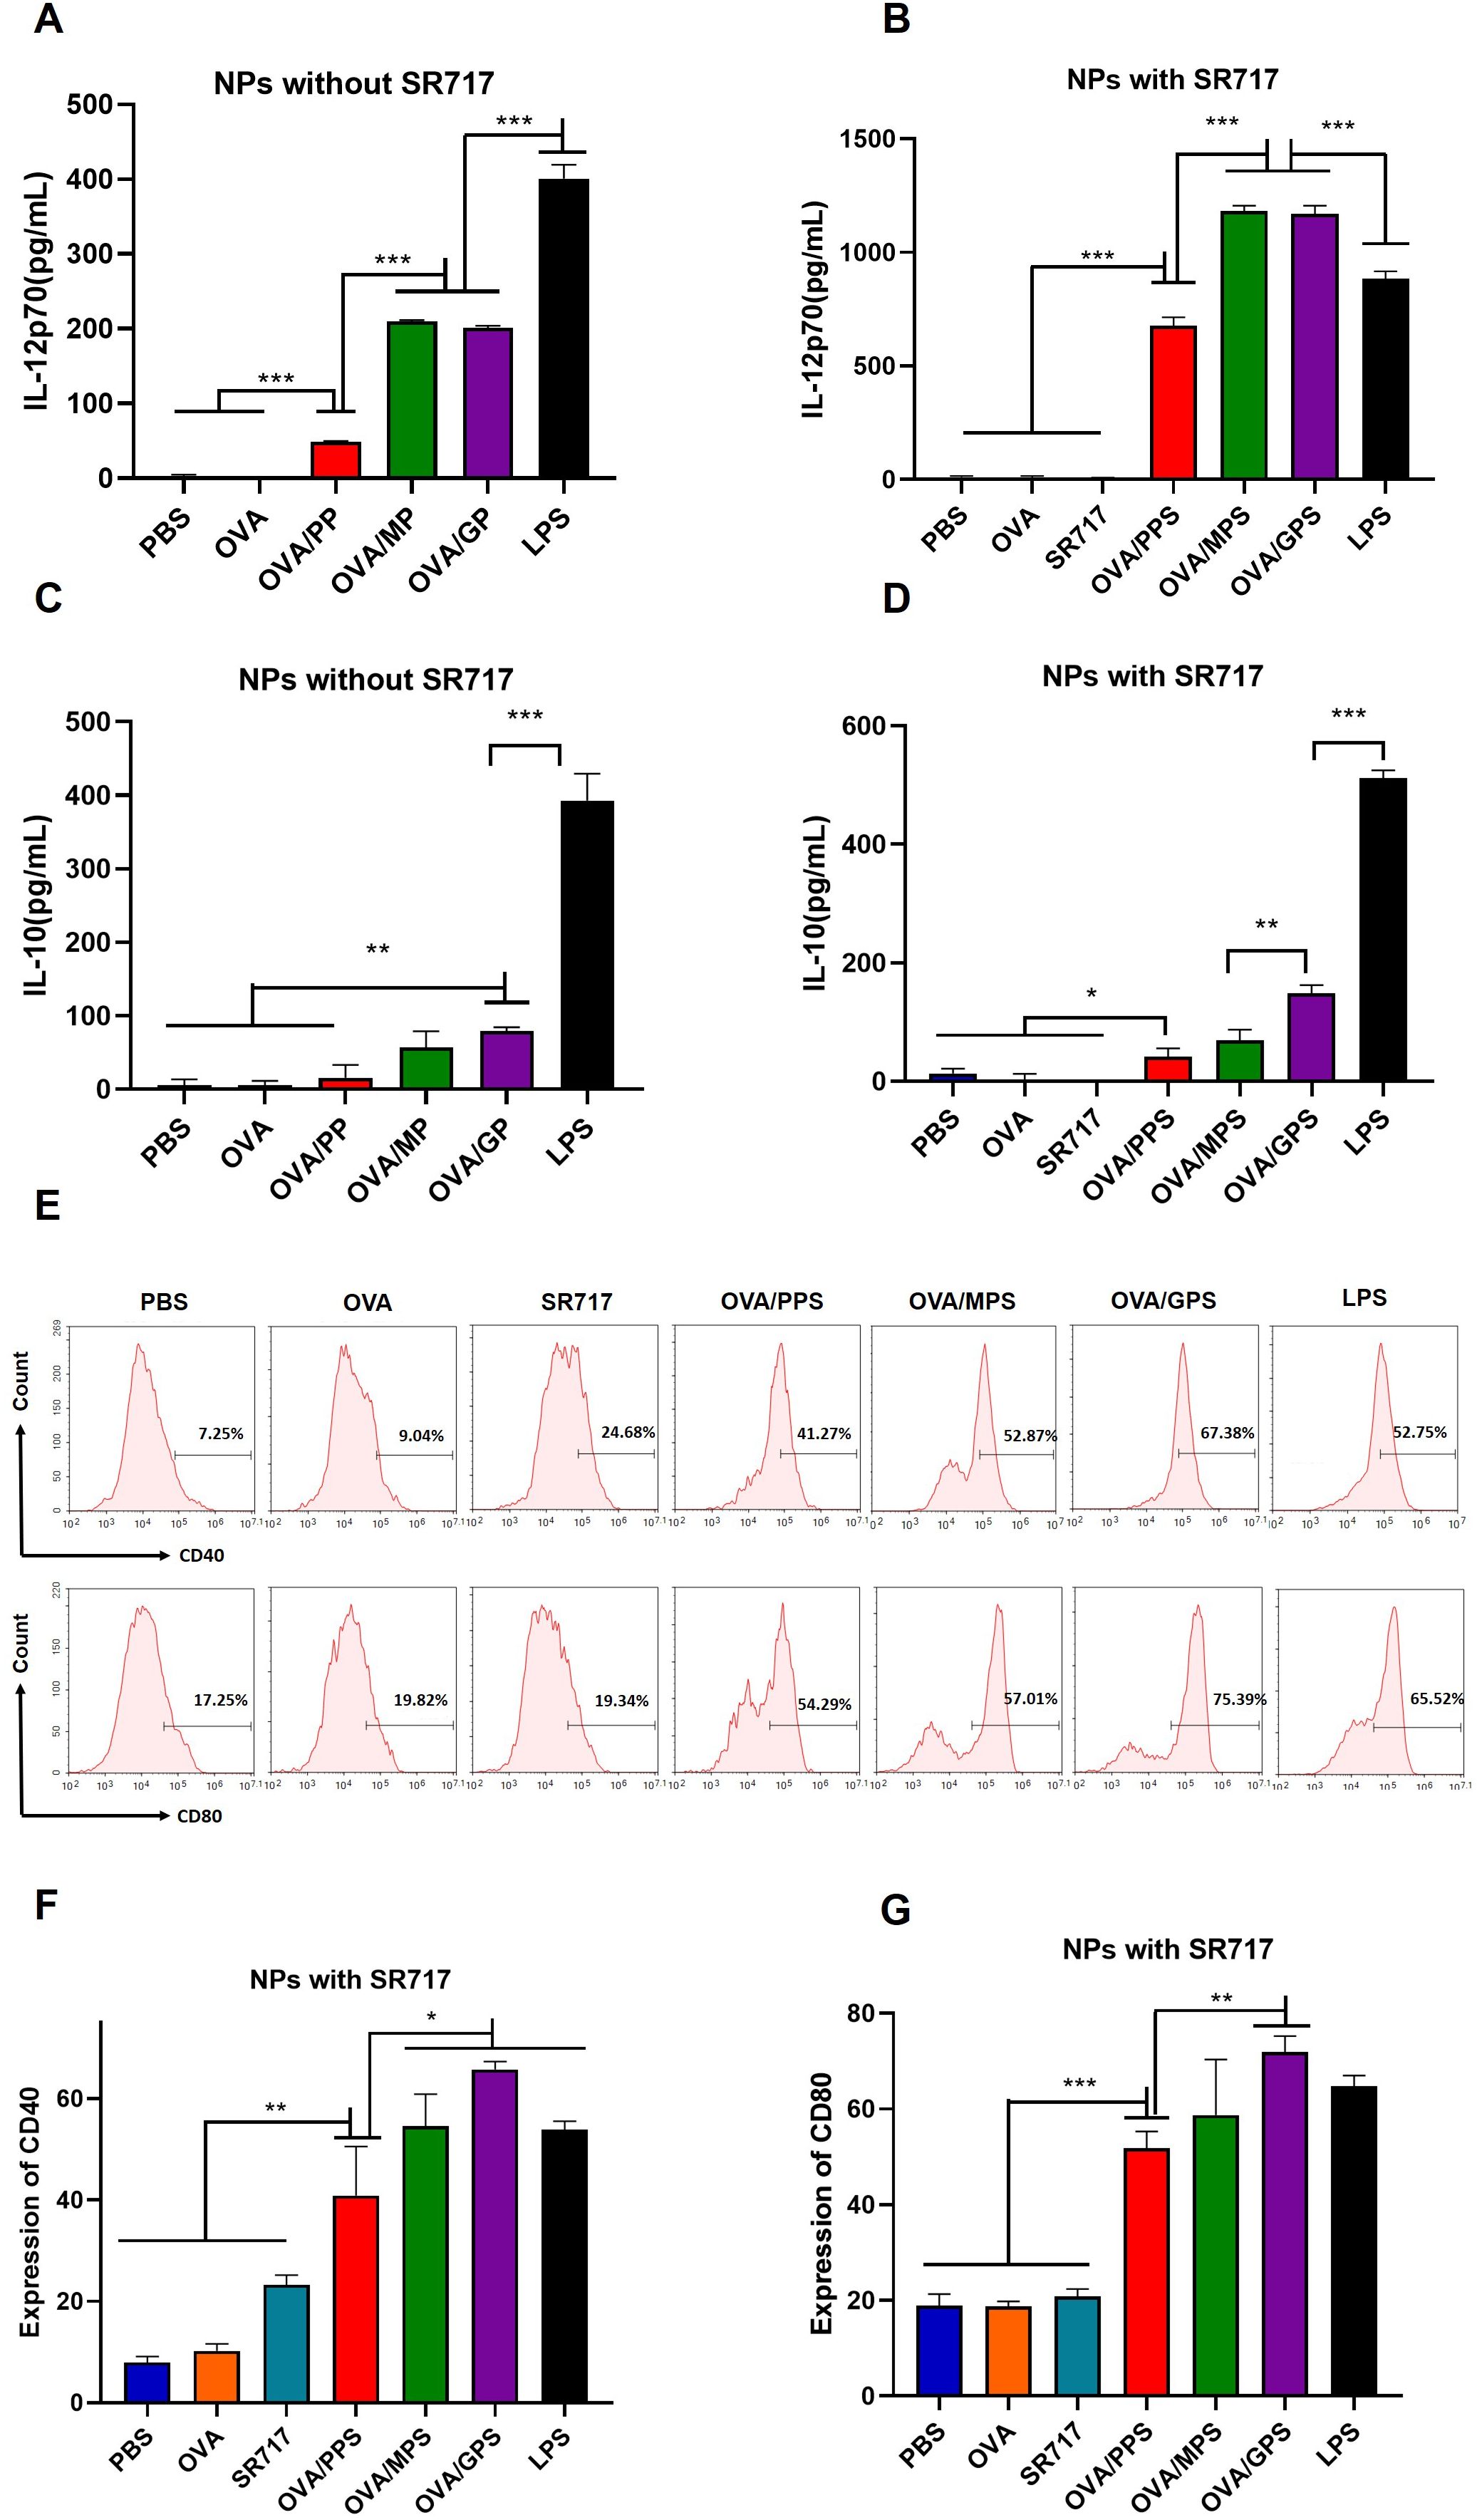
Figure 4. OVA/GPS efficiently activates BMDCs in vitro. (A) The levels of IL-12p70 produced by BMDCs treated with NPs not encapsulating SR717. (B) The levels of IL-12p70 produced by BMDCs treated with NPs encapsulating SR717. (C) The levels of IL-10 produced by BMDCs treated with NPs not encapsulating SR717. (D) The levels of IL-10 produced by BMDCs treated with NPs encapsulating SR717. (E) The expression of CD40 and CD80 on BMDCs treated with NPs encapsulating SR717. (F, G) Statistical analysis of the expression of CD40 and CD80 on BMDCs. The results are shown as means ± SD (n=3), *p < 0.5, **p < 0.01, ***p < 0.001.
3.5 OVA/GPS promote DC’s uptake in vitroTo assess the antigen delivering effect of NPs to DCs, BMDCs were incubated with FITC-labeled OVA/PPS, OVA/MPS, and OVA/GPS for 3 h. Subsequently, the cell membranes were labeled with DiI and the cell nuclei with DAPI. The internalization of NPs was observed using confocal laser scanning microscopy. At the same time, after incubating with FITC-labeled NPs for 3 h, the degree of BMDCs uptake of NPs was quantified using flow cytometry. As shown in Figure 5A, BMDCs exhibit phagocytic activity towards different NPs, with a greater proportion of OVA/GPS being engulfed compared to OVA/PPS and OVA/MPS. Compared to OVA/PPS, the uptake efficiency of BMDCs for OVA/MPS increased by approximately 5% (p<0.05); compared to OVA/MPS, the uptake efficiency of BMDCs for OVA/GPS increased by approximately 15% (p<0.01) (Figures 5B, C). These results suggest that compared to unmodified NPs and Mannose-modified NPs, Tri-GalNAc-modified NPs can significantly increase antigens uptake of BMDCs.
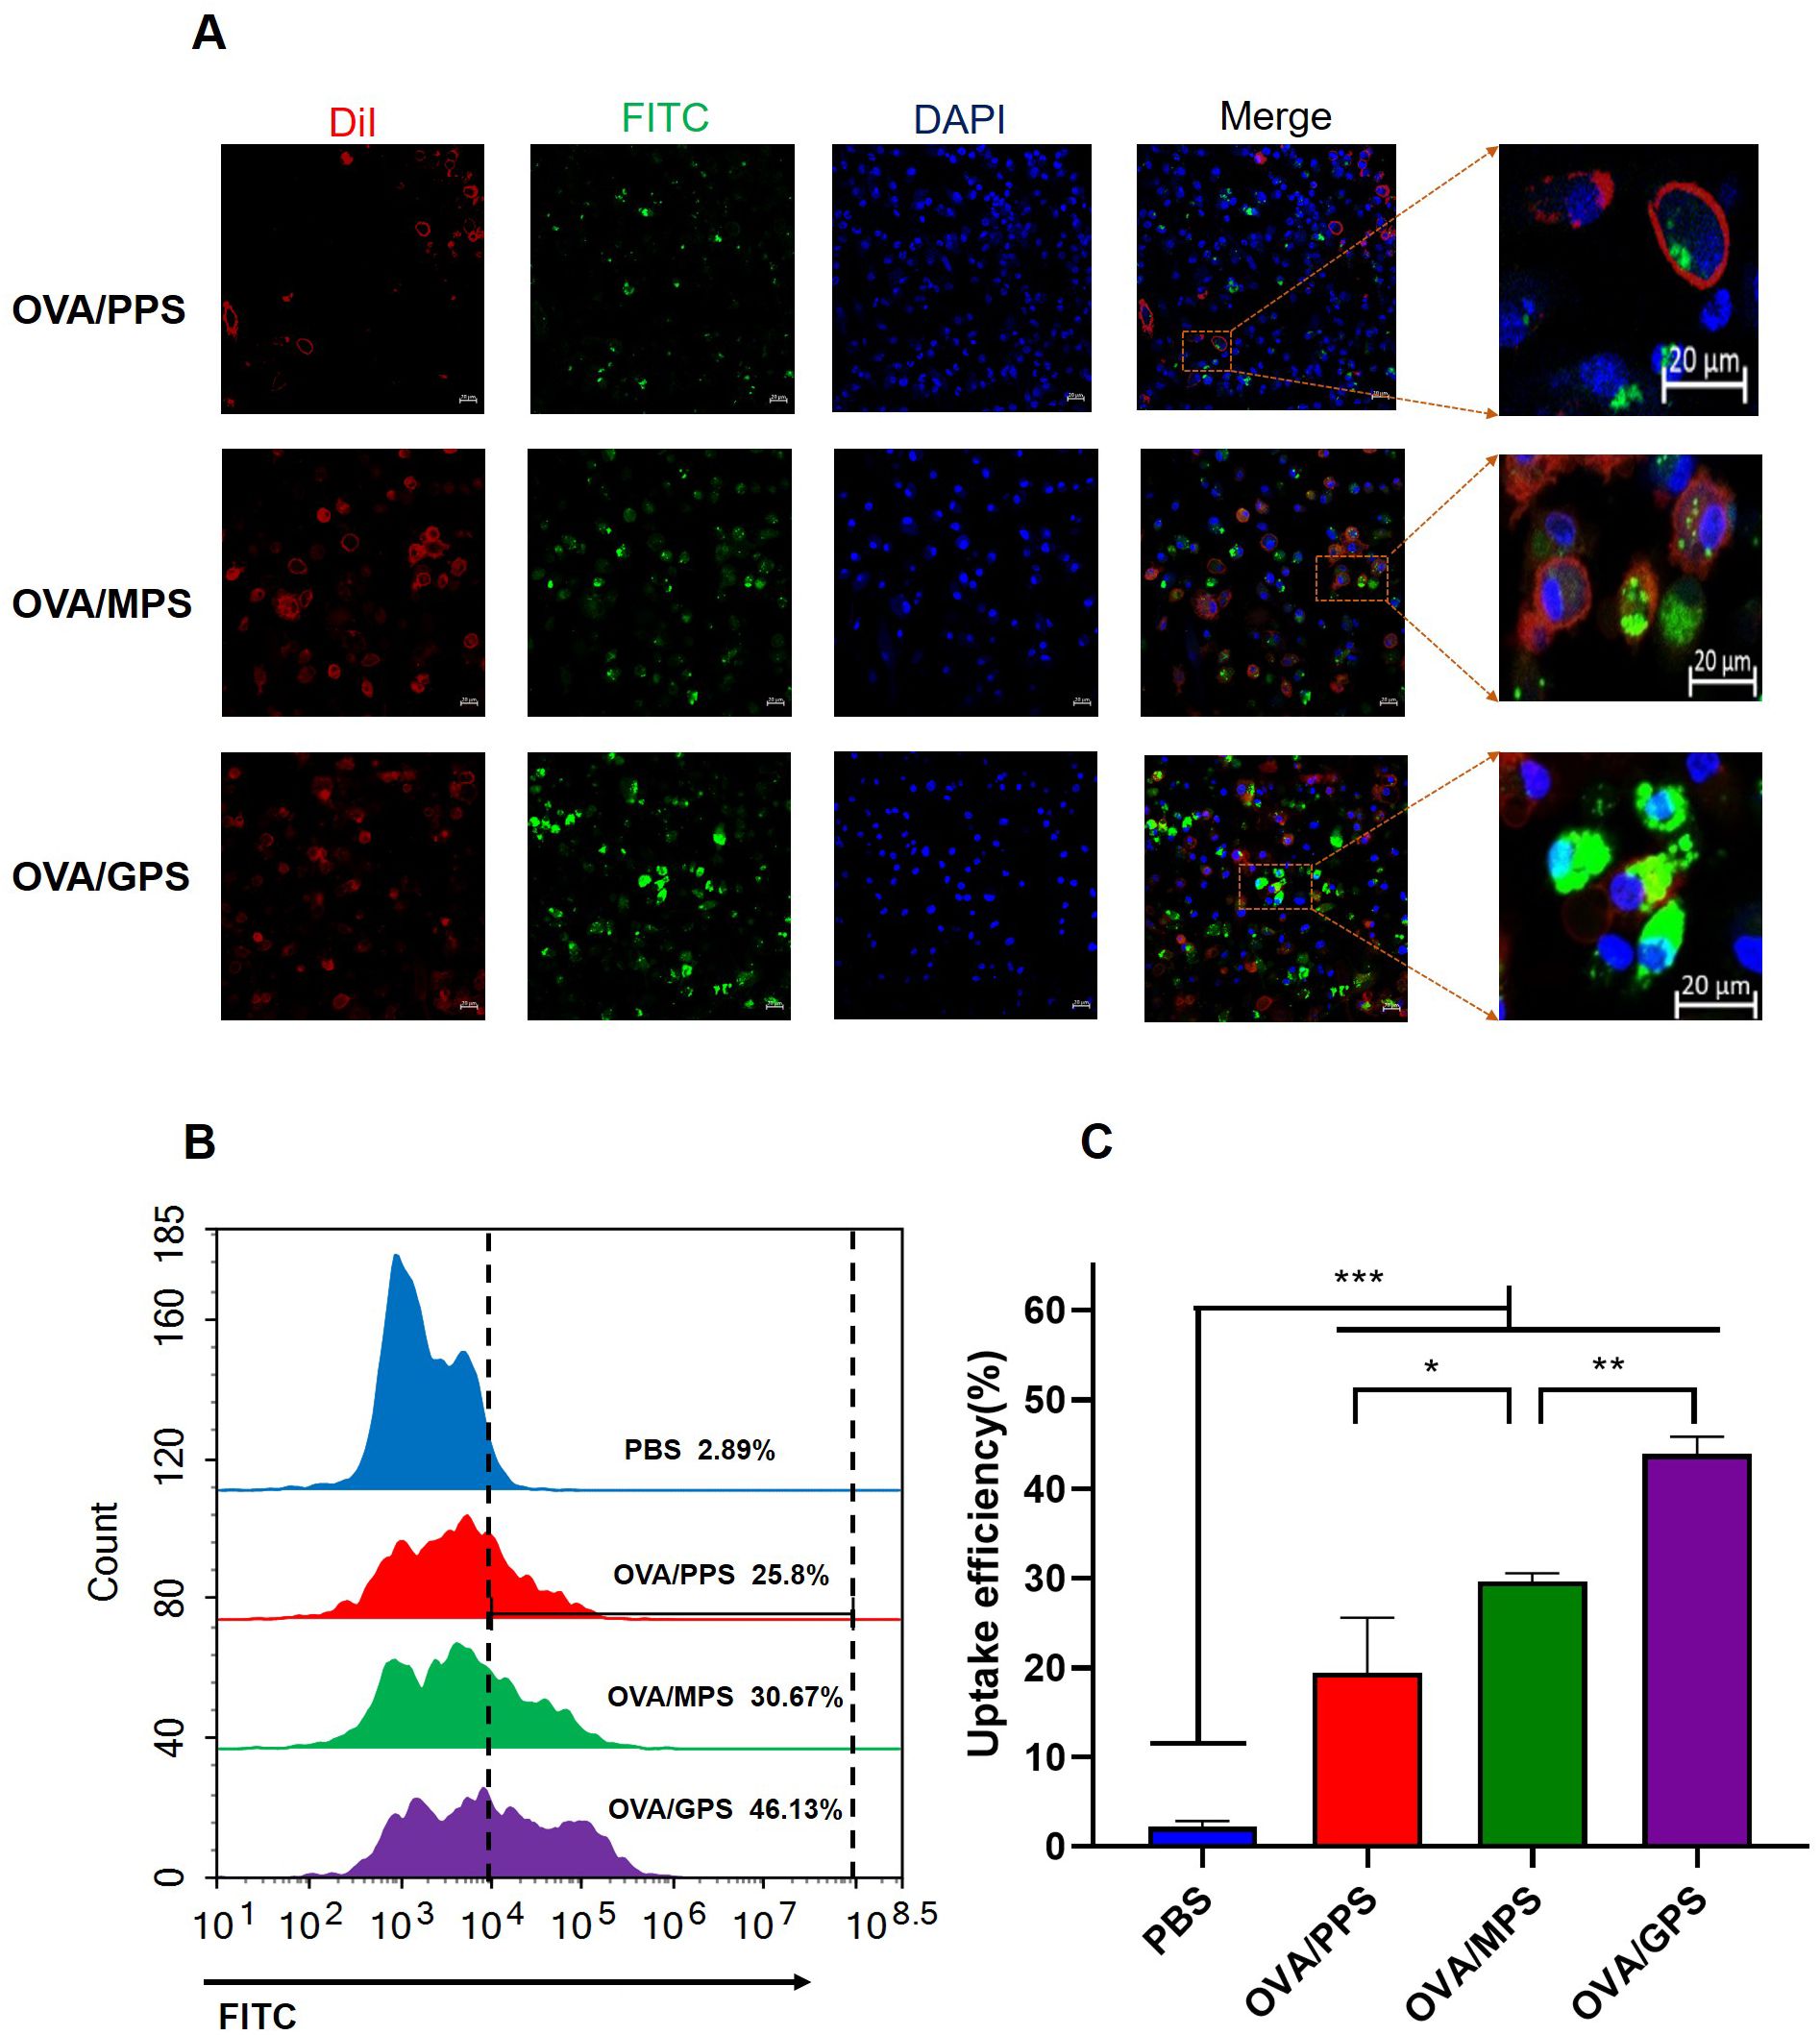
Figure 5. OVA/GPS promote DC’s uptake of antigens in vitro. (A) The confocal images of BMDCs incubated with FITC-NPs for 3 h at 37°C. The green signal represents FITC-labeled NPs, the red signal indicates DiI-stained cell membrane, and the blue signal depicts DAPI-stained nuclei. (B) BMDCs were incubated with FITC-labeled NPs for 3 h, and the histogram of FITC fluorescence intensity of BMDCs was detected by flow cytometry. (C) Statistical analysis of the uptake efficiency of NPs by BMDCs through quantification of FITC fluorescence intensity within the BMDCs. The results are shown as means ± SD (n=3), *p < 0.5, **p < 0.01, ***p < 0.001.
3.6 TP/GPS promote the antigen-specific cellular immune responsesThrough in vitro and in vivo experiments, we found that Tri-GalNAc-modified PLGA-PEG NPs encapsulating SR717 effectively targeted and activated DCs. Next, we encapsulated M. tuberculosis fusion protein TP in both unmodified and Tri-GalNAc-modified PLGA-PEG NPs and evaluated their ability to induce antigen-specific immune responses.
3.6.1 TP/GPS activate the antigen-specific T cellsThe cellular immune responses induced by NPs were analyzed at 6 weeks after the final vaccination. The frequencies of IL-2 and IL-17A producing CD4+T cells were analyzed by flow cytometry (Figure 6A). The results shown that, compared to the PBS, BCG, and TP, the TP/GPS induced higher levels of IL-2 and IL-17A producing CD4+T cells (p<0.01) (Figures 6B–E). Furthermore, the level of Granzyme B secreted by spleen lymphocytes, as measured by ELISA, may indicate the activation of CTLs. As shown in Figure 6F, the levels of granzyme B produced from the TP/GPS and TP/GP group were higher than those from PBS, BCG, TP and TP/PP group (p < 0.01). The results above demonstrate that PLGA-PEG NPs modified with Tri-GalNAc, encapsulating TP and SR717 effectively induce the generation of antigen-specific CD4+ and CD8+T cells.
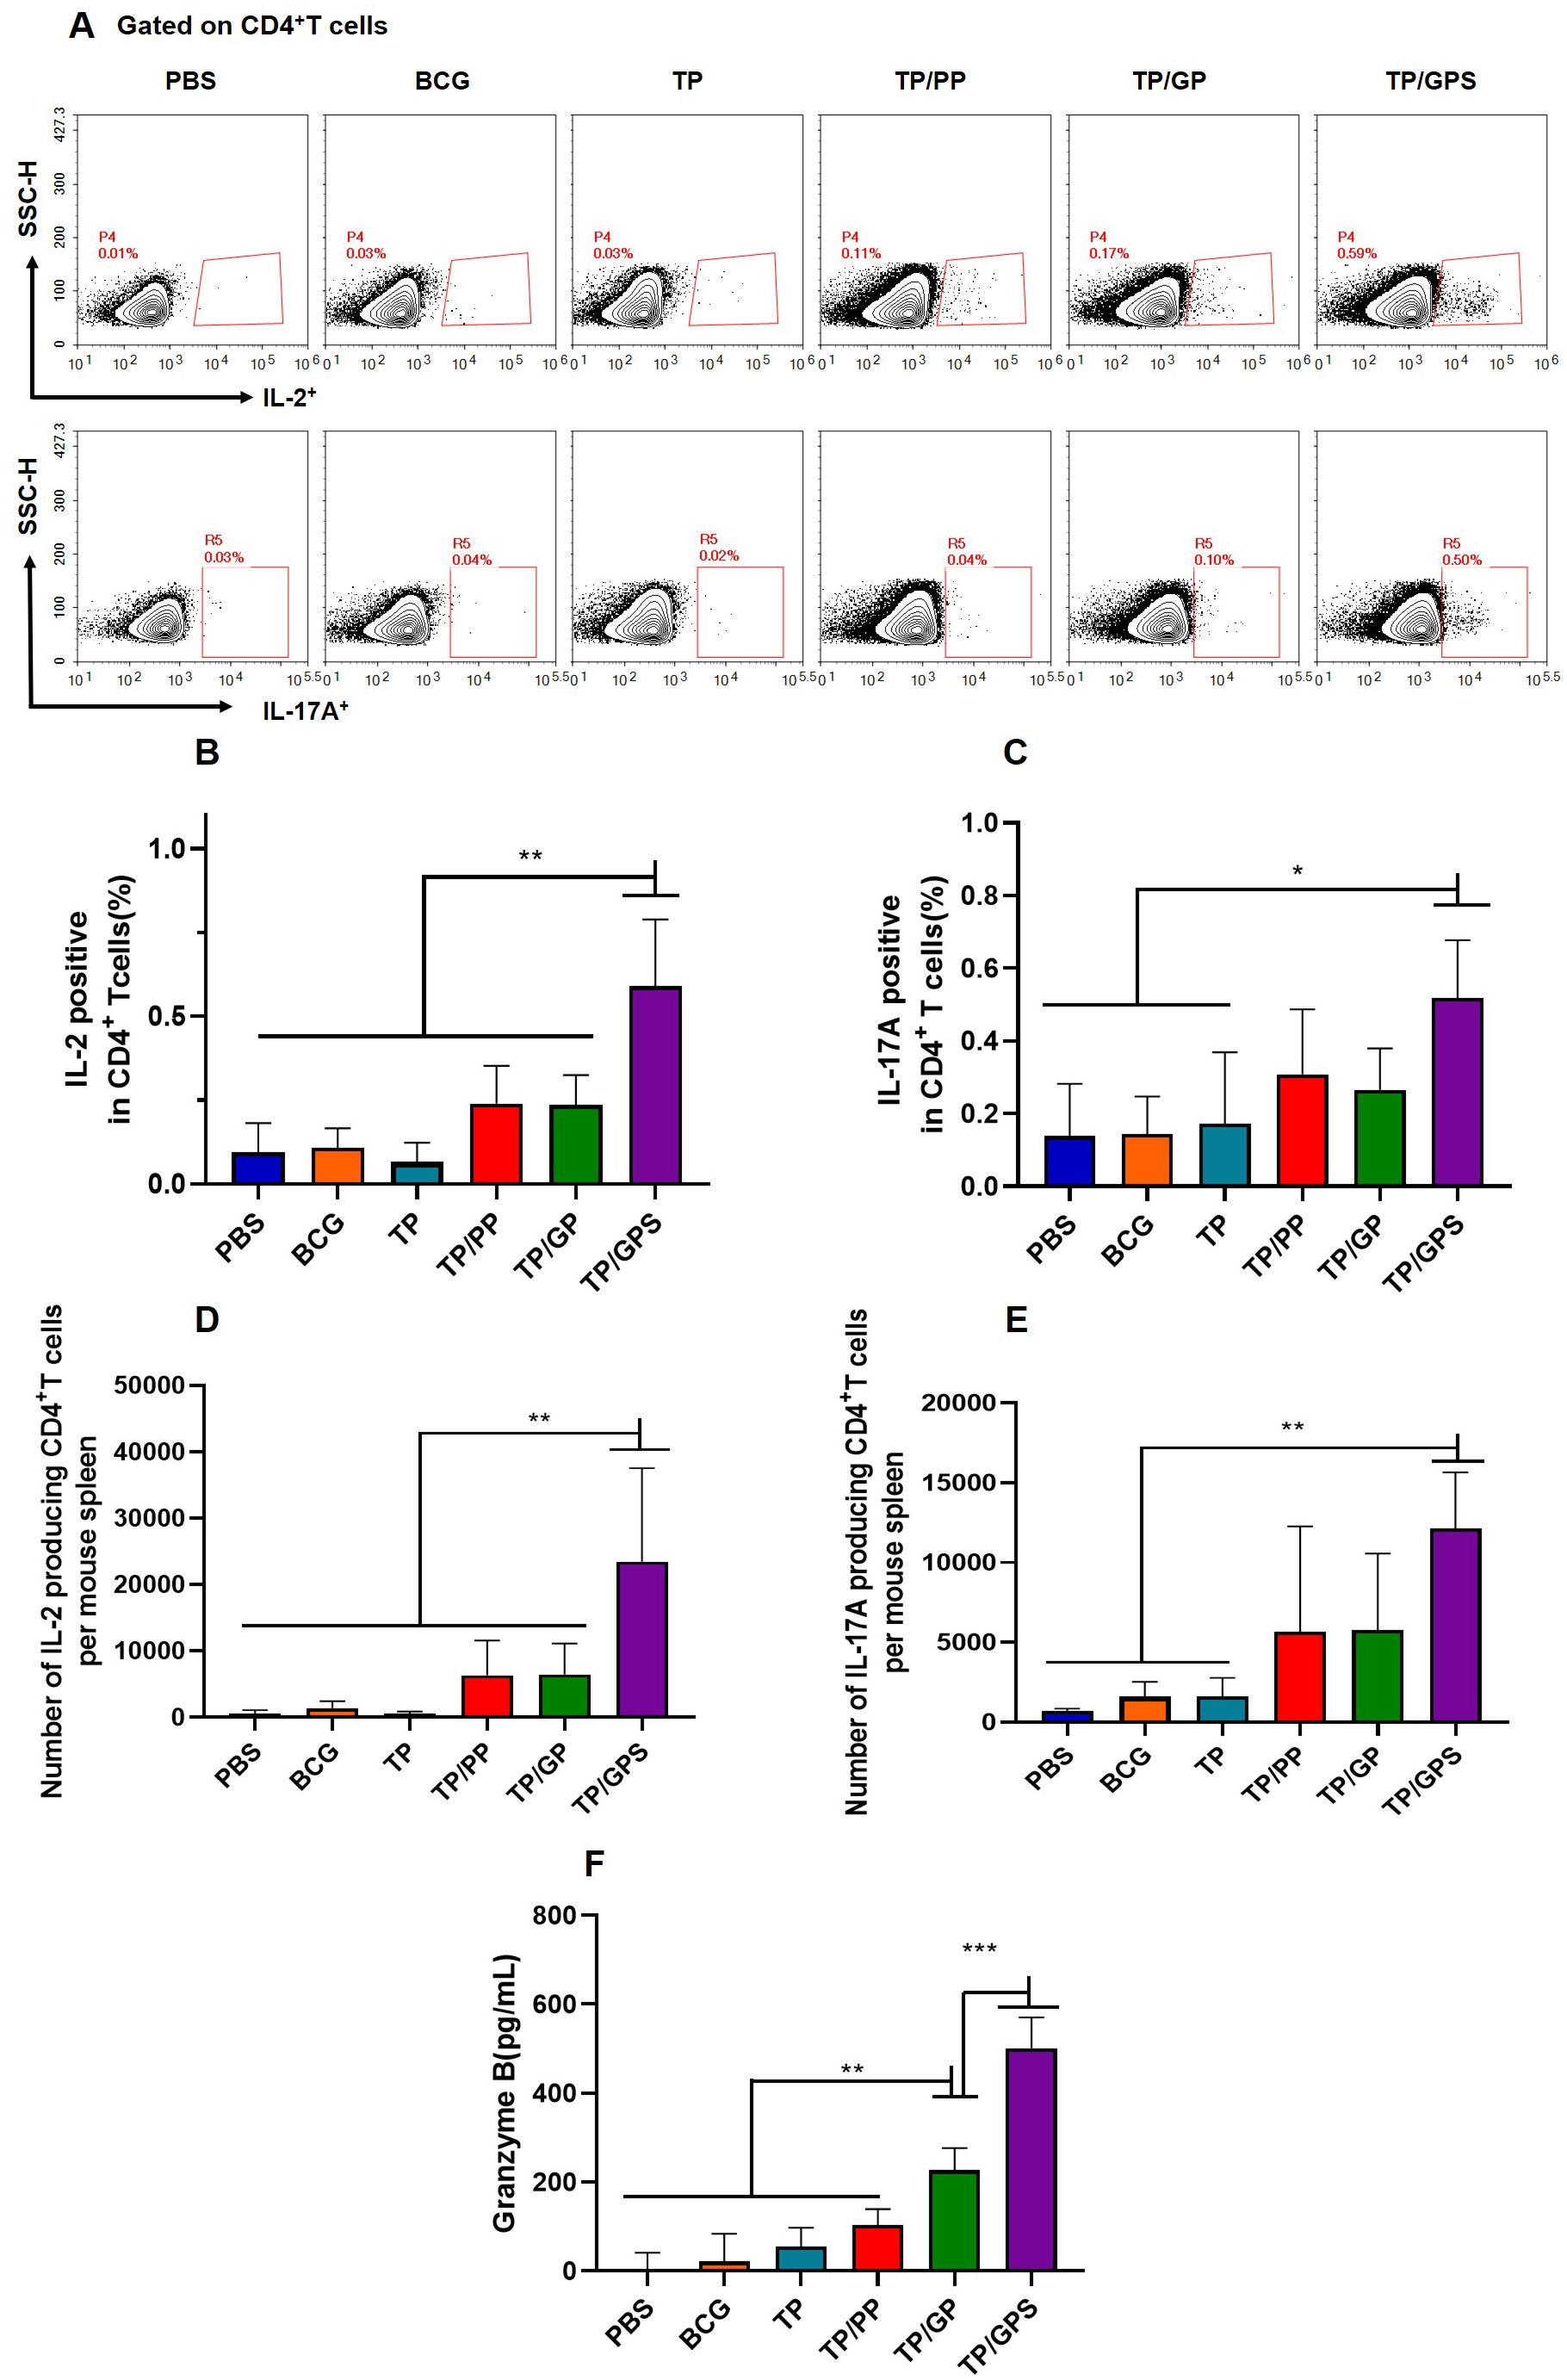
Figure 6. TP/GPS induce the activation of antigen-specific T cells. At 6 weeks after the final immunization, the splenic lymphocytes of mice were isolated and stimulated with individual antigens of TP for 12 h in vitro, then the immune responses were analyzed by flow cytometry and ELISA. (A) Flow cytometric analysis of IL-2 and IL-17A producing CD4+T cells. (B, C) Statistical analysis of the proportion of IL-2 and IL-17A producing CD4+T cells. (D-E) Statistical analysis of the number of IL-2, and IL-17A-producing CD4+T cells among total spleen lymphocytes in each mouse. (F) The amount of secreted granzyme B from spleen lymphocytes following antigen stimulation. The results are shown as means ± SD (n=4-5), *p < 0.5, **p < 0.01, ***p < 0.001.
3.6.2 TP/GPS promote the generation of long-term memory CD4+ and CD8+ T cellsTo investigate the quantity and quality of memory T cells induced by TP/GPS, the vaccine-induced long-lived memory T cells were evaluated at 12 weeks after last vaccination using the methods as previously mentioned (46). Mice were subcutaneously immunized with individual antigens of TP for in vivo stimulation 3 days prior to the immunoassay. After a three-day period, splenic lymphocytes were isolated and stimulated in vitro with individual antigens of TP for 12 h. Cytokine secretion by T cells was subsequently assessed using flow cytometry (Figure 7A). The results indicated that the TP/GPS group had a higher number of IFN-γ, IL-2, and IL-17A producing CD4+ T cells than PBS, BCG, and TP groups. (p<0.05) (Figures 7B–G). Compared to the TP/GP group, the TP/GPS group showed a significant increase of IFN-γ and IL-2 producing CD4+ T cells (Figures 7B–G) (p<0.05). The results indicate that PLGA-PEG NPs modified with Tri-GalNAc, encapsulating TP and SR717, induce a great number of long-lived CD4+ memory T cells.
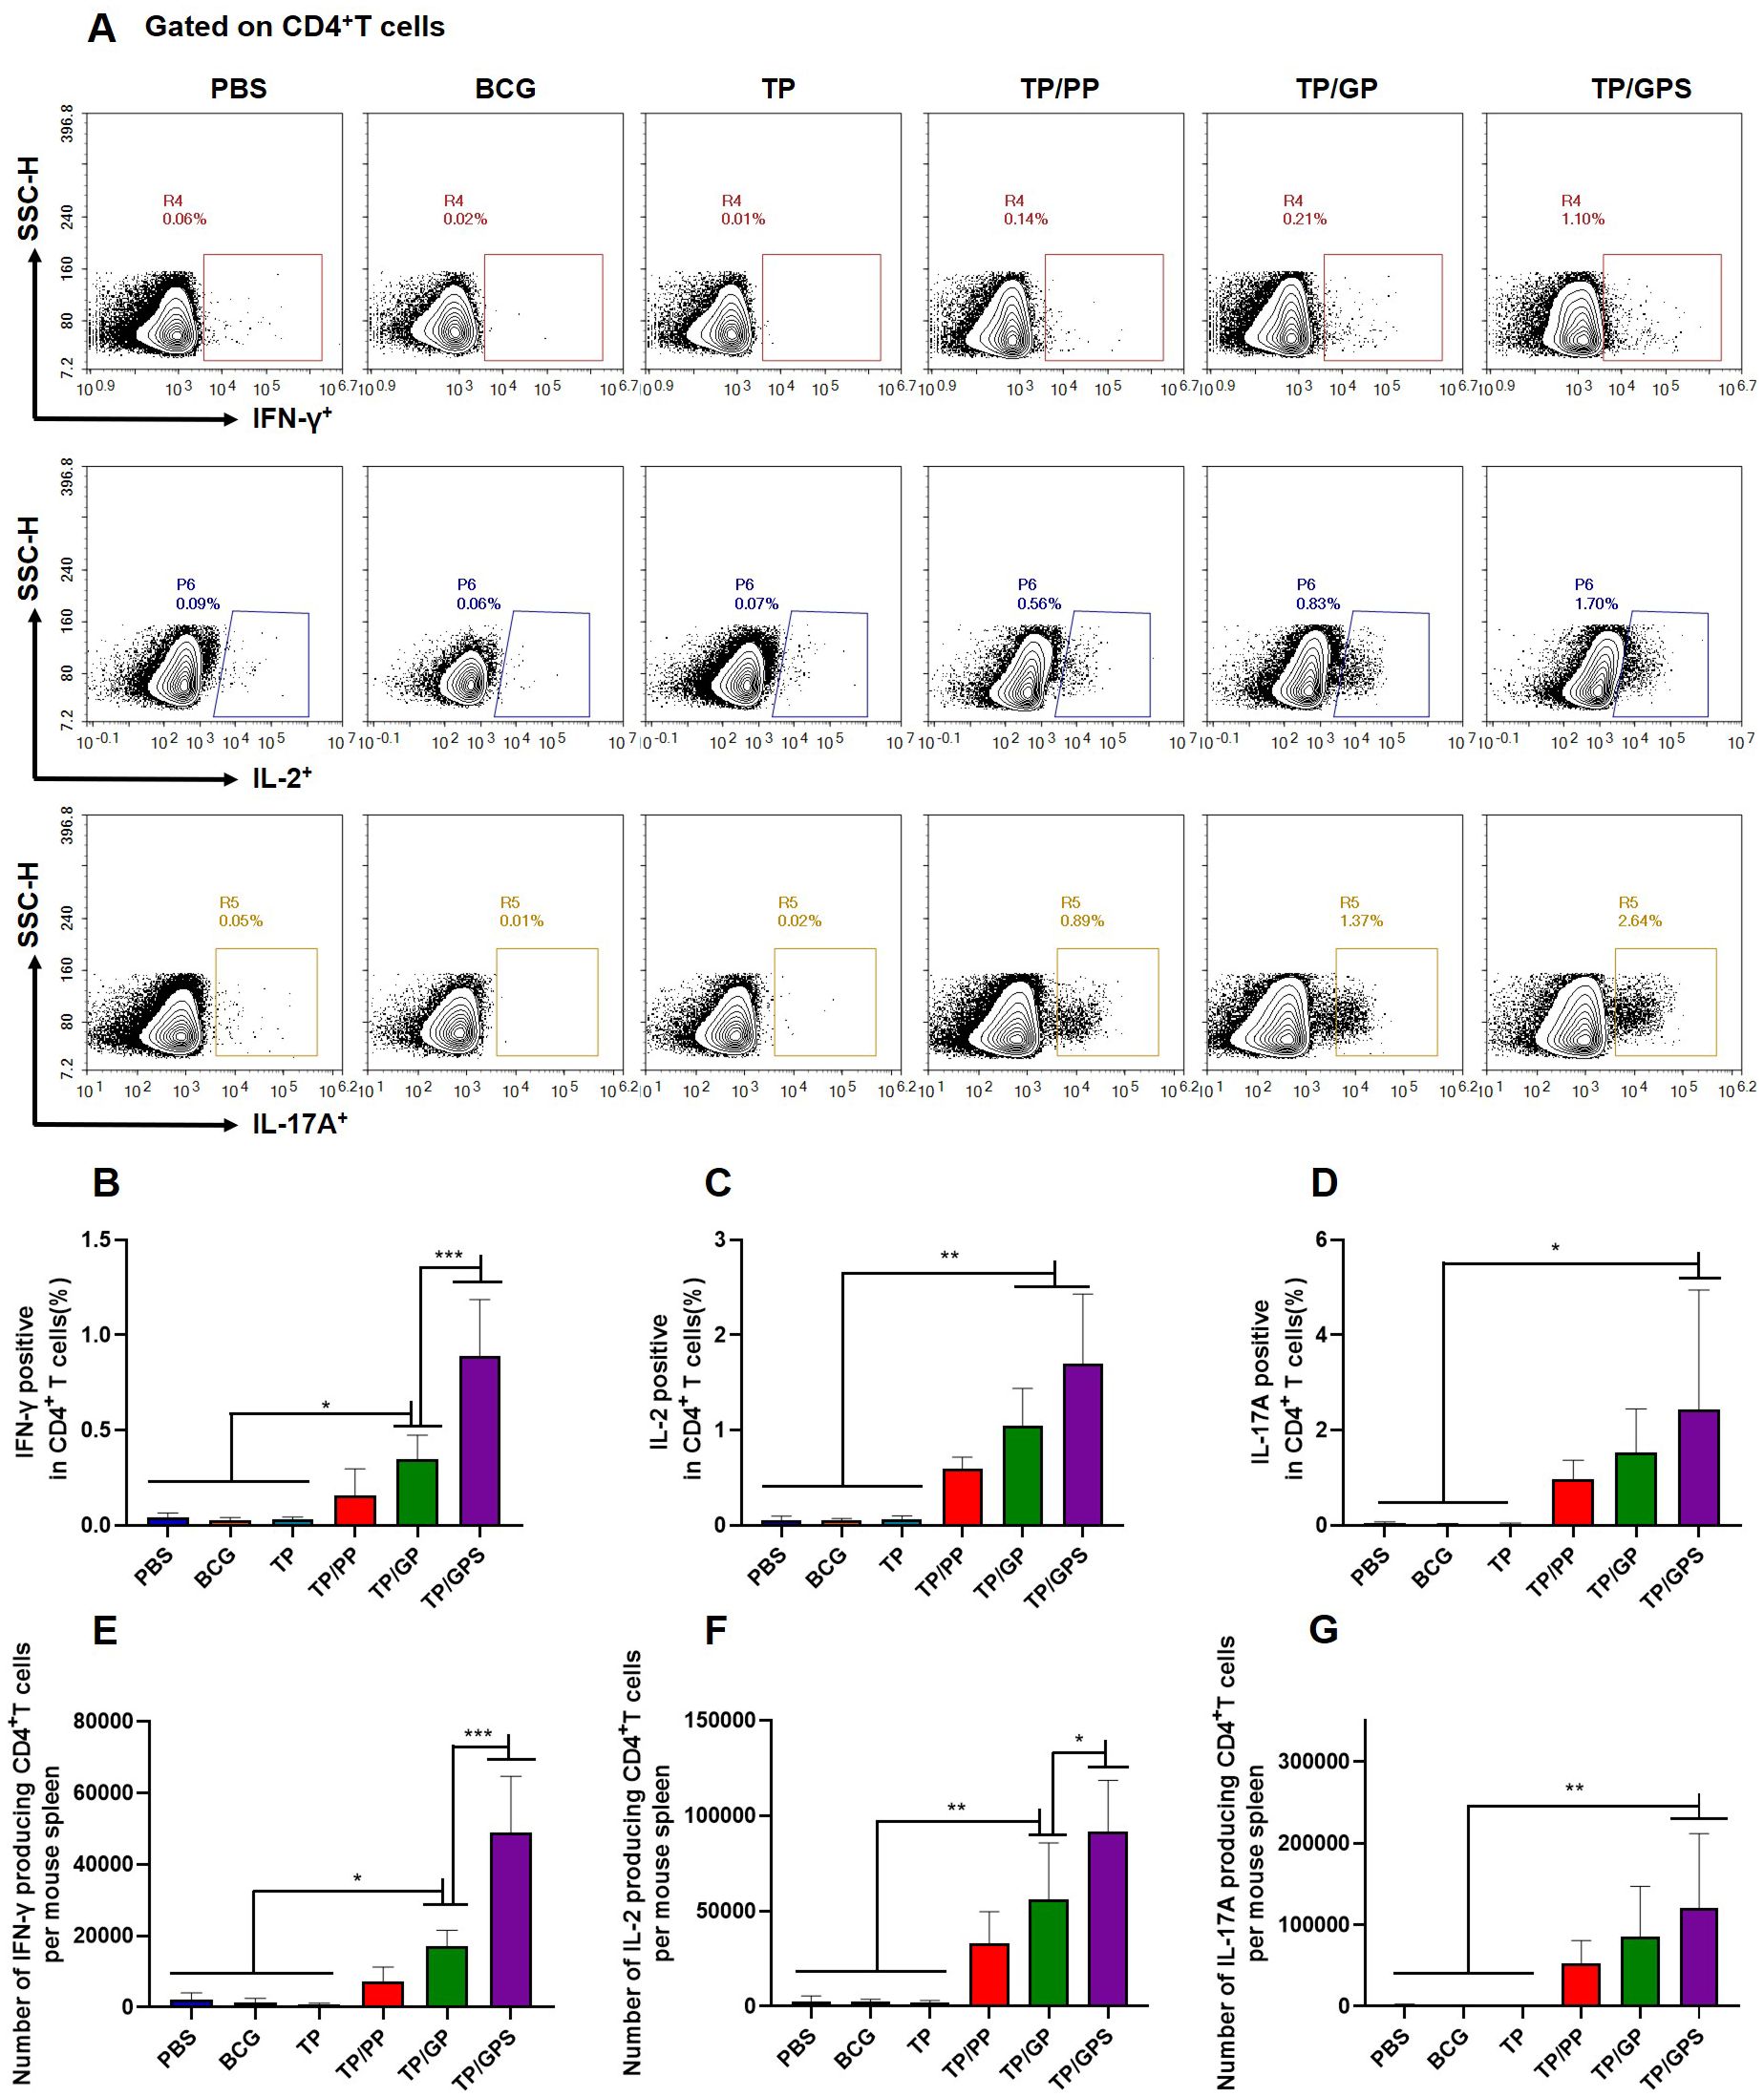
Figure 7. TP/GPS induce the production of antigen-specific memory CD4+T cells. At 12 weeks after the final immunization, mice were subcutaneously injected with individual antigens of TP for 3 days. Subsequently, mice were euthanized, and splenic lymphocytes were isolated and stimulated with individual antigens of TP for 12 h in vitro before analysis by flow cytometry. (A) Flow cytometric analysis of IFN-γ, IL-2, and IL-17A producing CD4+T cells. (B-D) Statistical analysis of the proportion of IFN-γ, IL-2 and IL-17A producing CD4+T cells. (E-G) Statistical analysis of the number of IFN-γ, IL-2, and IL-17A producing CD4+T cells among total spleen lymphocytes in each mouse. The results are shown as means ± SD (n=5), *p < 0.5, **p < 0.01, ***p < 0.001.
After the second antigenic stimulation, memory CD8+T cells differentiate into effector cells that secrete cytotoxic molecules such as granzyme B and cytokines like IFN-γ (48). We assessed the levels of IFN-γ secretion by CD8+T cells using flow cytometry (Figure 8A) and quantified granzyme B levels in the supernatant with an ELISA kit. The results demonstrate that compared to PBS, BCG, TP, TP/PP, and TP/GP, the TP/GPS significantly elevated numbers of antigen-specific IFN-γ secreting CD8+T cells (p<0.001) (Figures 8B, C). The levels of granzyme B produced from the TP/GPS and TP/GP group were higher than those from PBS, BCG, TP and TP/PP group (p<0.01) (Figure 8D). The results indicate that PLGA-PEG NPs modified with Tri-GalNAc and SR717 lead to the generation of a substantial number of long-lived CD8+ memory T cells.
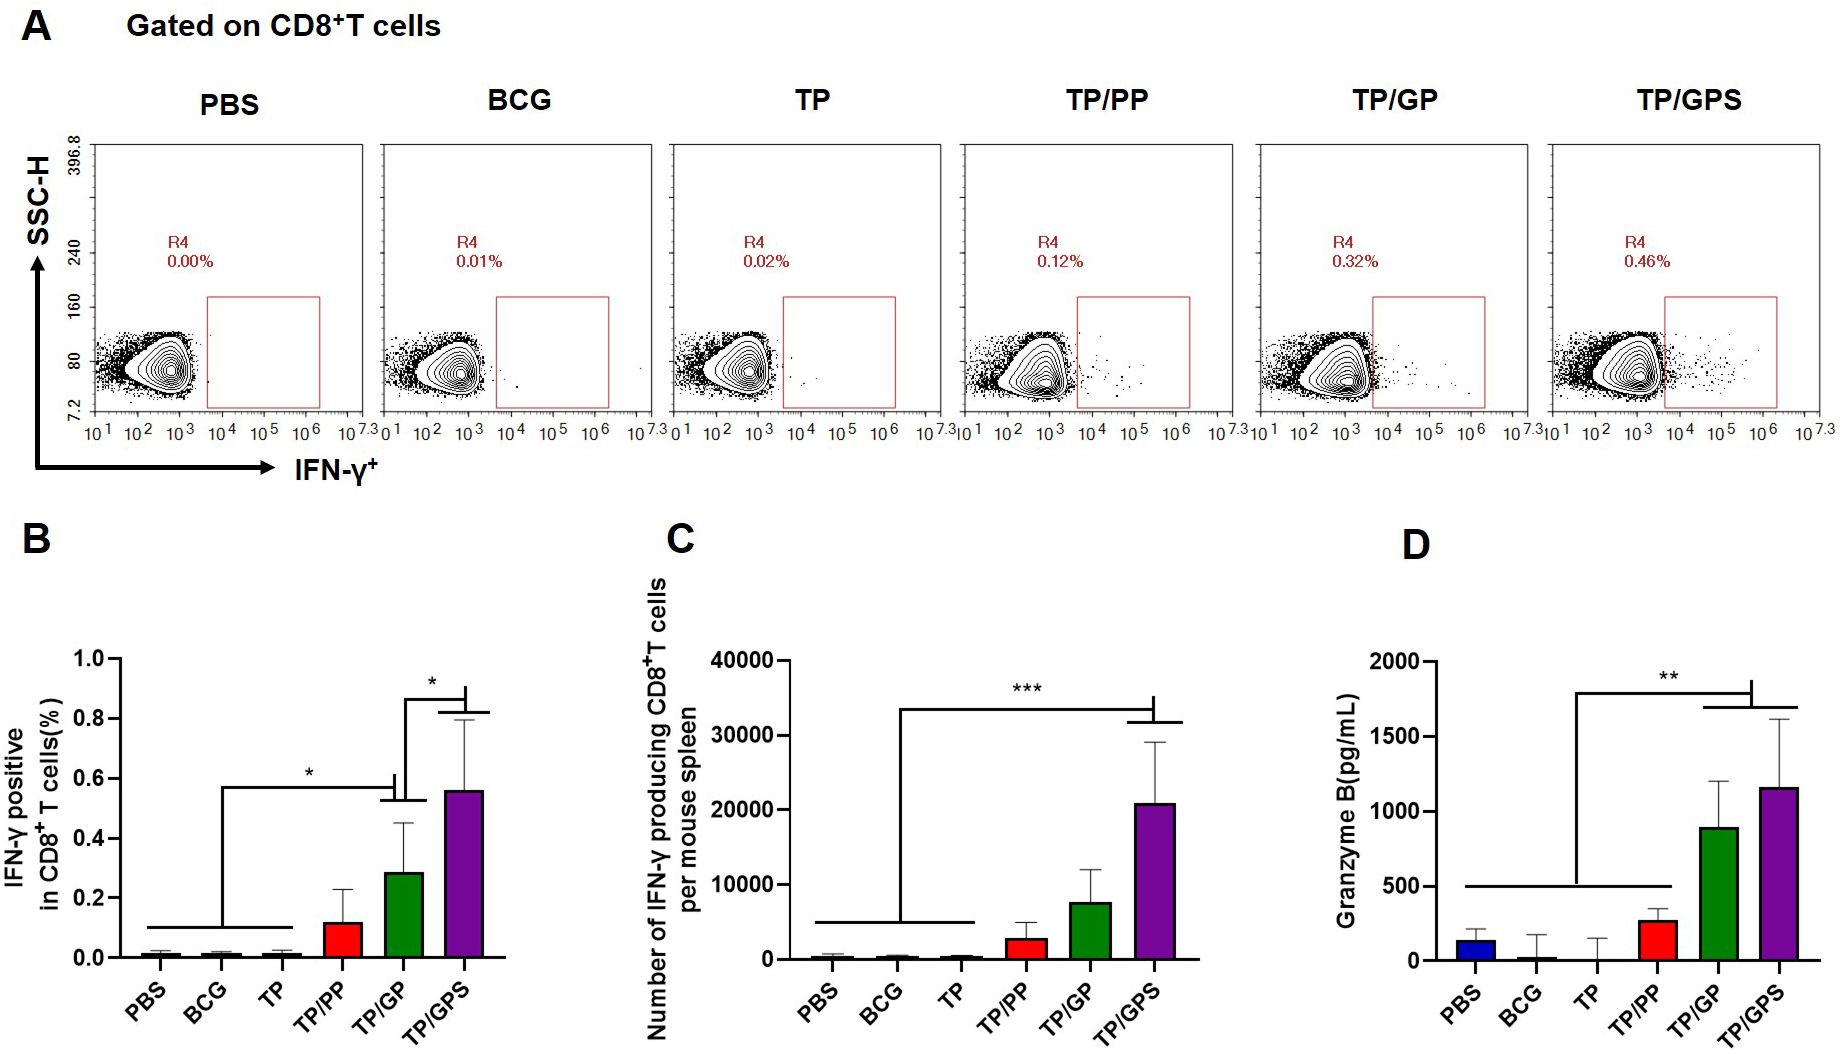
Figure 8. TP/GPS induce the production of antigen-specific memory CD8+T cells. (A) Flow cytometric analysis of IFN-γ producing CD8+T cells. (B) Statistical analysis of the proportion of IFN-γ producing CD8+T cells. (C) Statistical analysis of the number of IFN-γ producing CD8+T cells among total spleen lymphocytes in each mouse. (D) The amount of secreted granzyme B from spleen lymphocytes following the second antigen stimulation. The results are shown as means ± SD (n=5), *p < 0.5, **p < 0.01, ***p < 0.001.
3.6.3 TP/GPS promote the proliferation of T cellsMemory T cells can rapidly proliferate following second antigen stimulation. At 12 weeks after the last immunization, the proliferation capacity of memory T cells were analyzed using the EdU method. Compared to PBS, BCG, TP, and TP/GP groups, the proportion of EdU+T cells in the TP/GPS group was significantly increased(p<0.05) (Figure 9). Taken together, PLGA-PEG NPs modified with Tri-GalNAc, encapsulating TP and SR717 enhance the proliferative capacity of CD4+ and CD8+ T cells.
留言 (0)