Sepsis is characterized as an abnormal host response to infection that can result in multiorgan failure, acidosis and death (1, 2). Data show that the in-hospital mortality rate of sepsis is 17%-26%, accounting for 36.9%-55.9% of all in-hospital deaths in the United States (3, 4). Hospitalizations for sepsis have increased dramatically over the past decade (5). Sepsis not only manifests as increased inflammation, but also immunosuppression, leading to cellular dysfunction and systemic organ failure, including the respiratory system, cardiovascular system, nervous system (6), etc.
ARDS, or acute respiratory distress syndrome, is a frequently occurring clinical complication of sepsis. It is marked by the sudden development of low blood oxygen levels, noncardiogenic pulmonary edema, low blood oxygen levels, and the necessity for mechanical breathing support (7). Sepsis is a leading cause of ARDS, accounting for approximately 75% of cases (8). Sepsis-induced ARDS is associated with higher severity of illness, lower success rates of extubation, and increased mortality compared to ARDS not caused by sepsis (9). There are still challenges in the individualized treatment of ARDS. Although the implementation of lung-protective ventilation, strict fluid management, and the application of extracorporeal membrane oxygenation (ECMO) have improved ARDS symptoms, the mortality rate for ARDS remains high at 40% (10, 11). The extremely high mortality rate of sepsis and ARDS has brought a huge burden to human health and socioeconomic development (12, 13). At present, the relationship between sepsis and ARDS is not completely clear, and the common diagnostic targets for sepsis and ARDS remain under-researched. There is substantial evidence that early detection of sepsis and organ failure reduces severity and ultimately mortality (14, 15). Therefore, it is an urgent need for biomarkers that can accurately identify the occurrence of sepsis and ARDS and predict their poor prognosis (15–17).
Biomarkers are essential for early diagnosis, detecting organ dysfunction, and improving prognosis. Current sepsis biomarkers include acute phase proteins, cytokines, and cellular markers, but their performance remains suboptimal (18, 19). ARDS diagnosis mostly relies on clinical symptoms, leading to missed or delayed cases (20). Recent studies identify SCAMP5, NDUFB3, and LILRA5 as potential sepsis biomarkers, with LPIN1, CYBB and FCAR linked to prognosis (21–25). For ARDS, TYMS and STAT3 may assist in diagnosis, and LCN2 could predict survival (26–28).
However, few studies have explored biomarkers that can simultaneously predict both the diagnosis and poor prognosis of sepsis and ARDS. Although sepsis-induced ARDS has been investigated as a single illness (29, 30), the relationship between sepsis and ARDS is not well understood. There is limited research into their shared regulatory mechanisms, despite these two conditions being prevalent and difficult to manage in clinical practice. The novelty of our study lies in the identification of three genes that are not only associated with the diagnosis of both sepsis and ARDS but are also predictive of poor patient outcomes. Our research clearly demonstrates the existence of common molecular targets between these two diseases, highlighting a potential shared pathway for therapeutic intervention. This provides valuable insight into the overlapping mechanisms of sepsis and ARDS, offering a foundation for future studies aimed at improving diagnostic and treatment strategies for both conditions.
Our study identified shared indicators of ARDS and sepsis that predict diagnosis and prognosis. Using bioinformatics techniques and machine learning models, we analyzed data from GEO and ArrayExpress, pinpointing the diagnostic genes CX3CR1, PID1, and PTGDS, which predict poor prognosis. We conducted gene set enrichment analysis, compared immune cell differences via single-cell sequencing, and explored potential treatments through molecular docking. Validation was performed using PBMCs from healthy volunteers and patients, as well as mouse samples. Our findings provide insights into the mechanisms of ARDS and sepsis, highlighting key genes and therapeutic targets for early diagnosis and prognosis.
2 Materials and methods2.1 Data collection and processingThe peripheral blood expression profile was downloaded from GEO (http://www.ncbi.nlm.nih.gov/geo) and ArrayExpress (https://www.ebi.ac.uk/arrayexpress/) database. We have retrospectively enrolled 11 datasets. The dataset search criteria included: 1) experimental data types such as microarray or high-throughput sequencing; 2) patient samples collected within 48 hours of admission; 3) human blood samples; 4) studies concentrating on sepsis or ARDS; 5) datasets from the same sequencing platform, producing two separate expression profiles. Table 1 offers a brief overview of the comprehensive details of these datasets. The datasets GSE65682, GSE95233, and GSE167363 served as discovery cohorts for sepsis, while GSE32707, GSE10474, and GSE151263 were utilized as discovery cohorts for ARDS. Furthermore, datasets GSE57065, GSE54514, GSE13904, E-MTAB-5273, and E-MTAB-5274 served as validation groups for sepsis and ARDS, respectively. The essential steps carried out in this article are illustrated in the diagram (Figure 1).
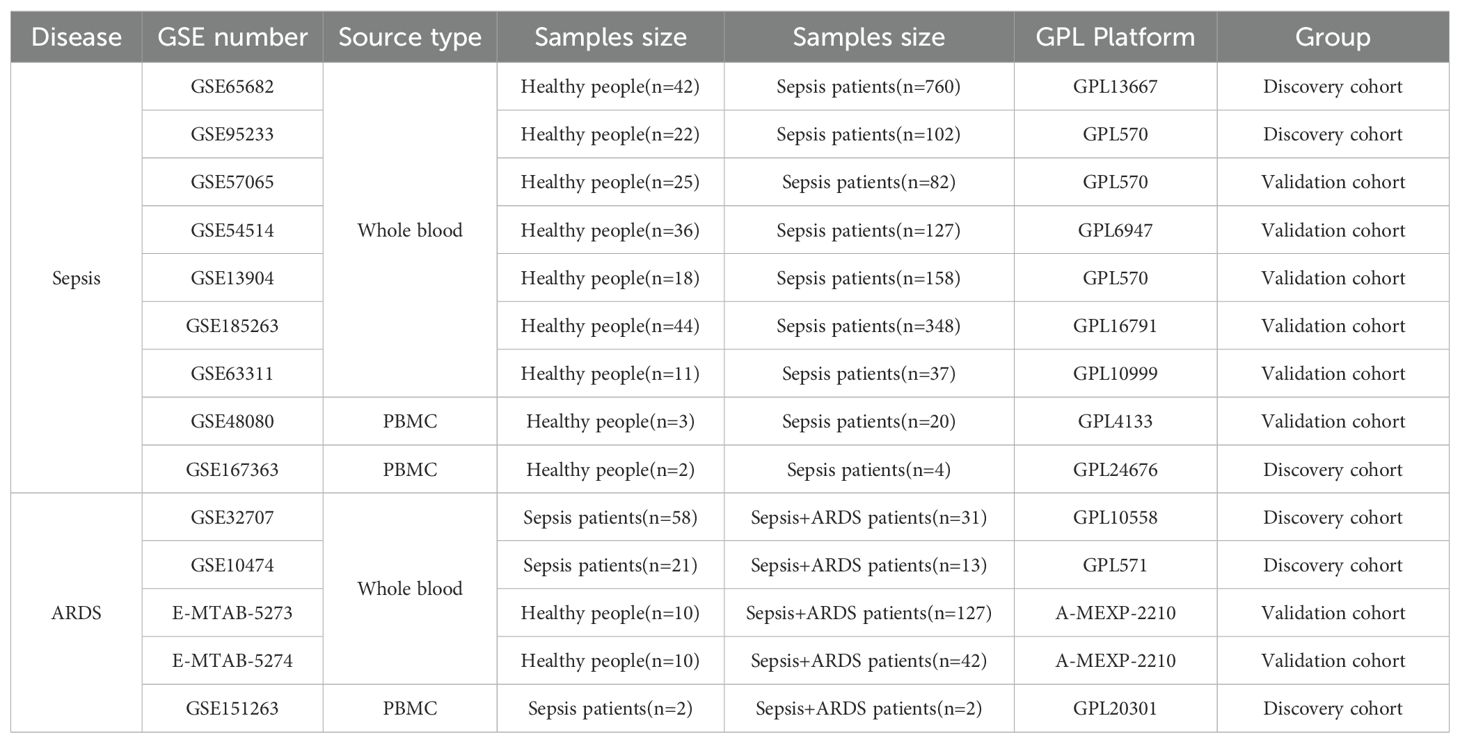
Table 1. Details of GEO datasets used in the study.
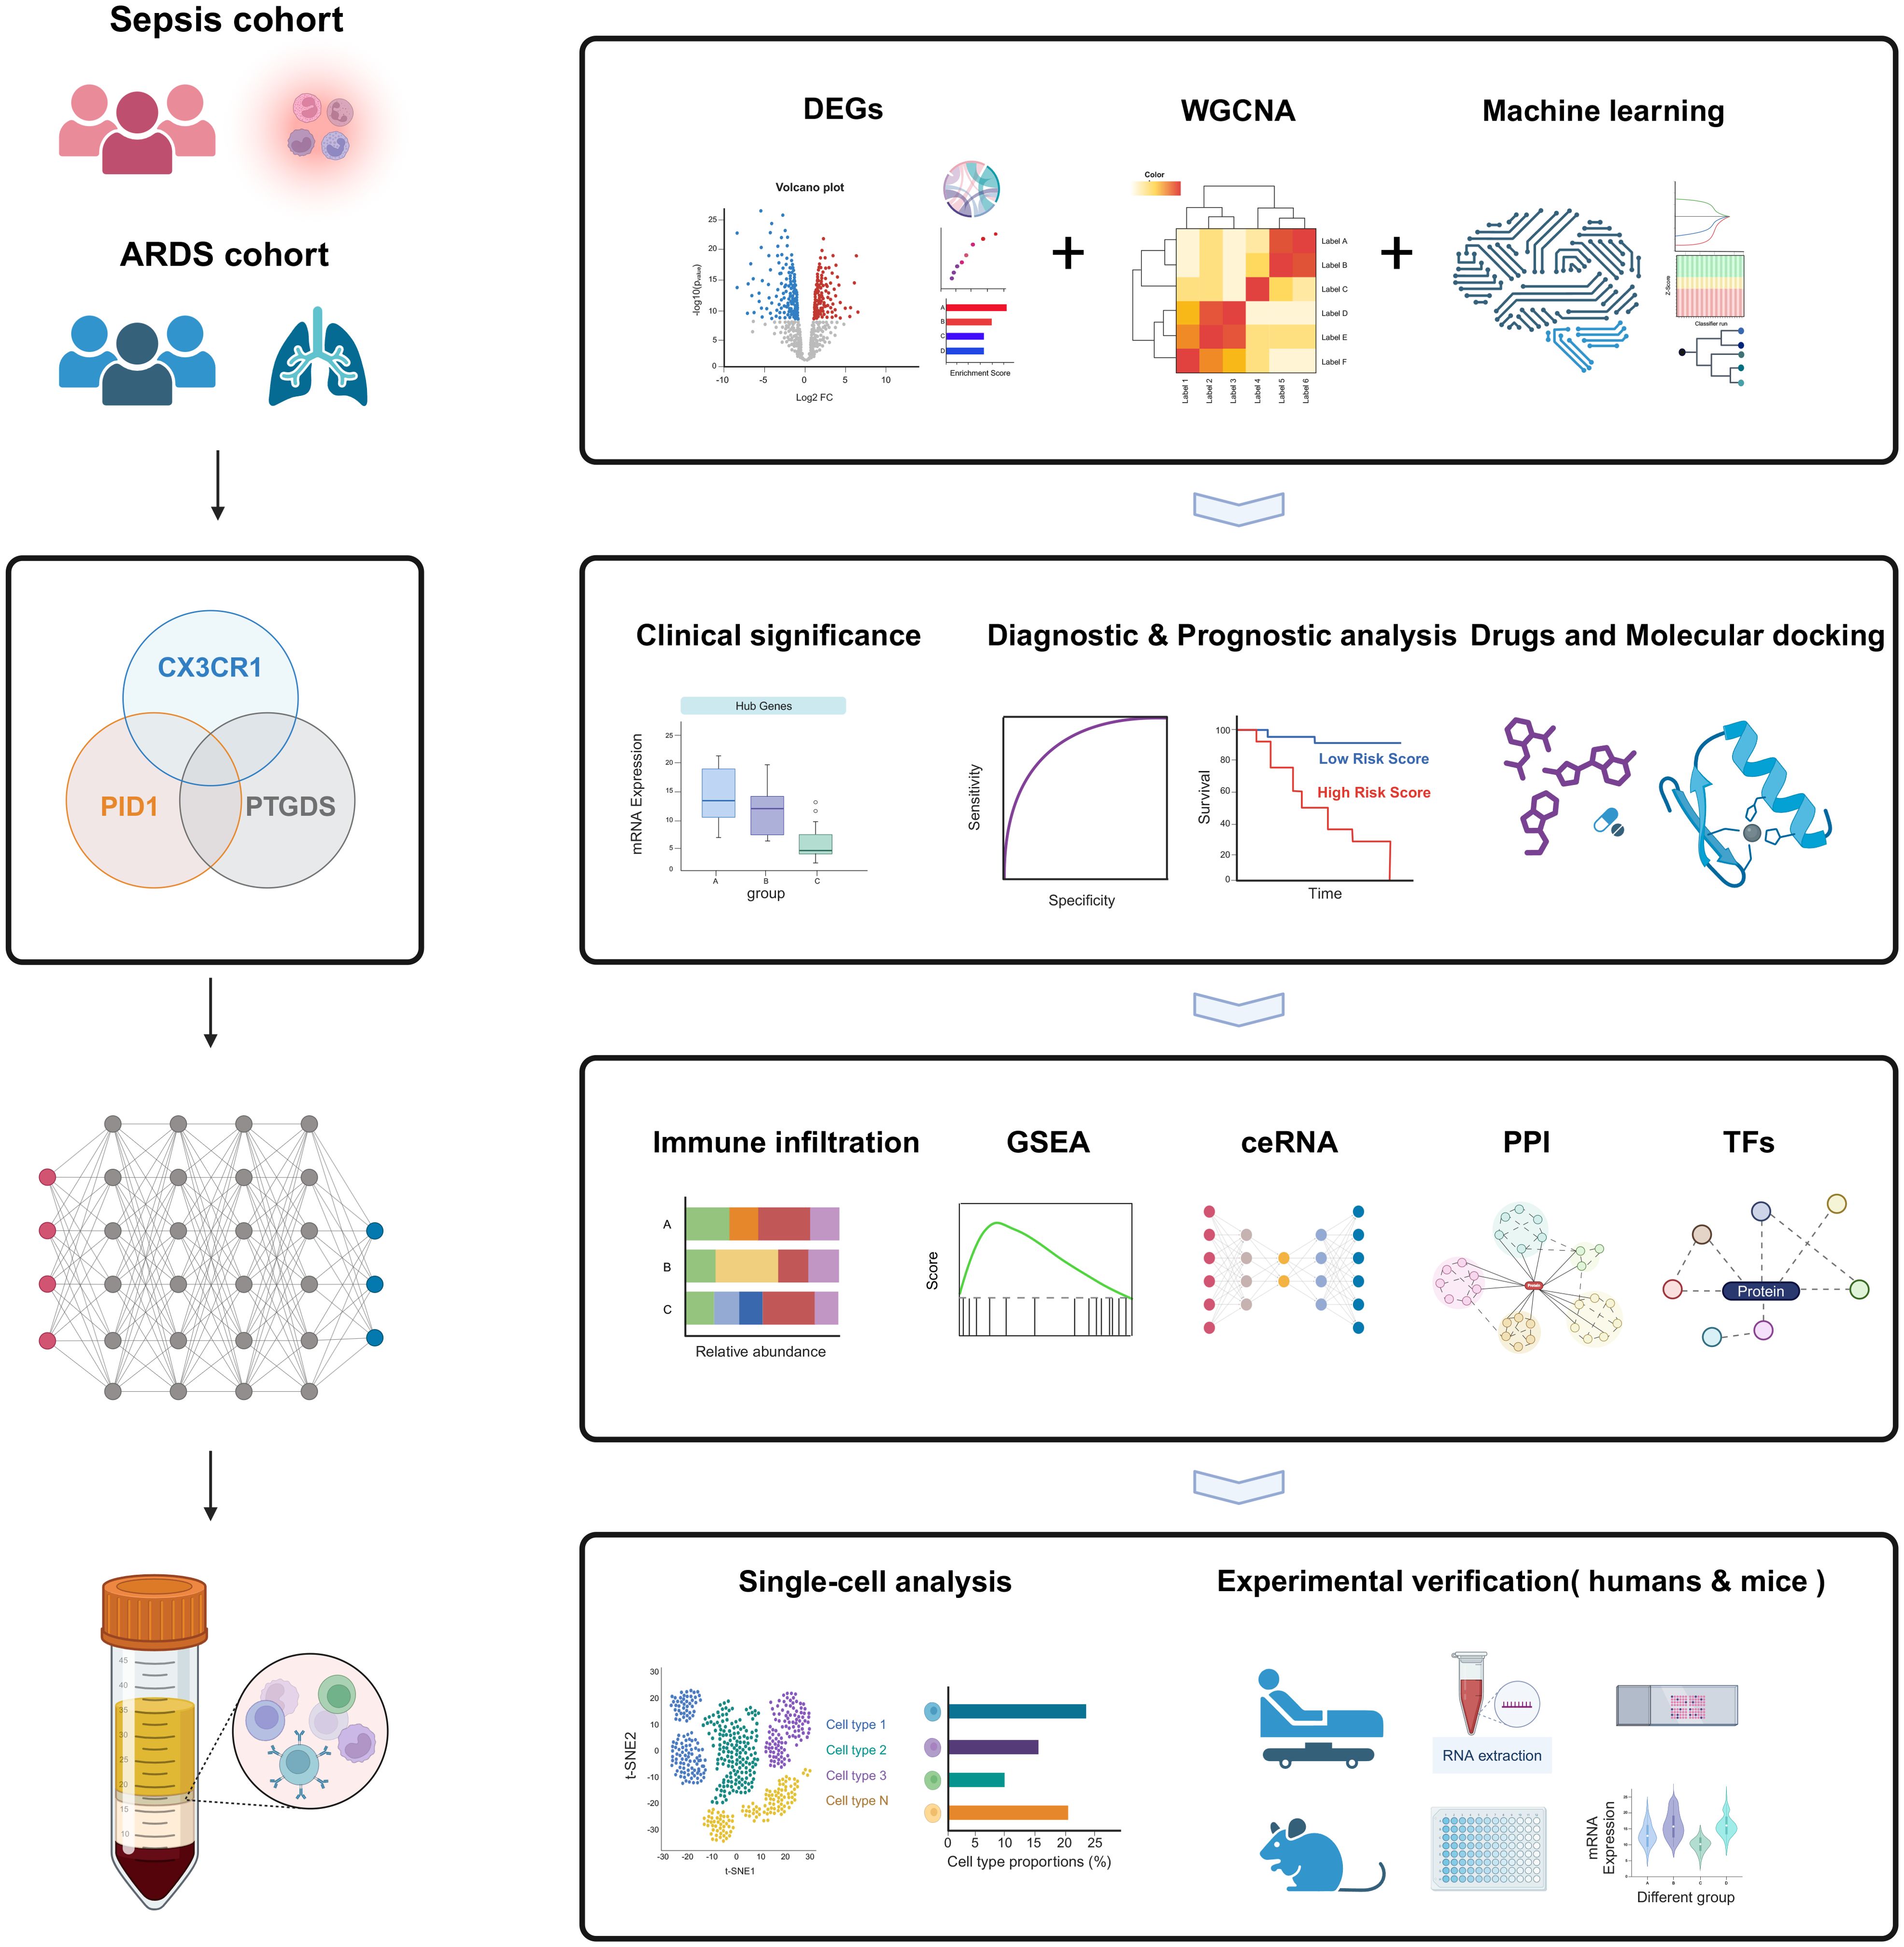
Figure 1. The flow chart for the whole design. Created with BioRender.com.
To ensure reliable analysis, we standardized datasets prior to processing. First, we applied median normalization by subtracting the median log ratio of each chip, ensuring a median log ratio of 0 across all chips for comparability. Next, we filtered out low-expressing genes, selecting those expressed in at least 75% of samples. Gene expression values were log2-transformed to normalize the data, which reduces the impact of extreme values and makes it suitable for statistical analysis. To account for batch effects, we applied uniform criteria for differential gene screening across datasets, selecting genes with a P-value < 0.05 and an absolute fold change > 0.3. Finally, we used a Venn diagram to identify common differentially expressed genes across datasets, improving the robustness of the results (31, 32).
2.2 Differentially expressed gene identificationThe LIMMA package in R (version 3.58.1) was employed to discover the genes with differential expression between the two groups. DEGs were identified as genes meeting the criteria of a P-value below 0.05 and an absolute fold change exceeding 0.3 relative to the control. The ‘ggplot2’ package was utilized to create volcano plots for differentially expressed genes in both sepsis and ARDS groups. The ‘VennDiagram’ package was utilized to identify the DEGs common to both sepsis and ARDS.
2.3 Functional analysis of DEGsTo explore the biological processes of the key genes connecting sepsis and ARDS, functional enrichment studies were conducted. The Omicshare web tool (https://www.omicshare.com/tools) was employed for gene ontology (GO) annotation to examine the functional annotation of DEGs. The identified DEGs were analyzed for pathways using the online Omicshare tool, referencing the KEGG pathway database. Annotation terms with a P value below 0.05 were considered significantly enriched, and the results were visualized through bubble charts, bar graphs, and cycle diagrams.
2.4 Building the network for weighted gene co-expression network analysisFocusing on the most variable 25% of genes, we employed the WGCNA package to identify the co-expression network and selecting genes from various clusters. The pickSoftThreshold function was employed to identify the soft threshold power (b), ensuring it met the scale-free topology criterion. Subsequently, gene co-expression clusters were determined using a single-step network building method. Every module included a minimum of 30 genes, and any leftover genes that were not grouped were placed in the grey module. Afterward, we calculated the correlation coefficients between the modules and phenotypes to determine which modules were closely associated with sepsis or ARDS. For ARDS, we selected the black module, which had the highest correlation, and conducted a further analysis of the associated genes. Nevertheless, several modules had a substantial association with sepsis, prompting us to use gene significance (GS) and module membership (MM) as filters for the genes. Subsequently, we selected genes within the hub modules that exhibited a |MM| value more than 0.6 and a |GS| value greater than 0.6 specifically for the sepsis group.
2.5 Screening hub genes by machine learningTo refine the selection of potential genes for diagnosing sepsis and ARDS, three different machine learning techniques were utilized. The first method, called Least Absolute Shrinkage and Selection Operator (LASSO) regression, improves prediction accuracy by choosing variables and using regularization, thereby refining statistical models (33). The second method, random forest (RF), excels because it imposes no restrictions on variable conditions and offers high levels of accuracy, sensitivity, and specificity. Random Forests are capable of predicting continuous values and offering stable forecasts (34). The Boruta algorithm, which is the third method, selects features by randomly shuffling each actual feature, evaluating their significance, and progressively eliminating those with low correlation to pinpoint the most pertinent variables (35). This research employed the Boruta package (v8.0.0) for feature selection, building 500 trees to assess the diagnostic significance of these biomarkers for various diseases. The R packages “glmnet”, “randomForest”, and “Boruta” were employed to conduct the machine learning analysis. The intersection of genes identified by LASSO regression, WGCNA, RF and Boruta were considered as candidate hub genes for diagnosing sepsis and ARDS.
2.6 Nomogram establishment and assessmentNomograms are effective instruments for combining various indicators to forecast the onset and advancement of diseases. In our research, we created a nomogram model that uses essential genetic indicators to forecast the onset of sepsis and ARDS, employing the ‘rms’ package in R. We used the ‘pROC’ R package to perform a receiver operating characteristics (ROC) analysis, measuring the model’s sensitivity and accuracy to evaluate its performance. The genetic characteristics were confirmed with a separate validation group. To confirm the nomogram’s predictive precision, we utilized calibration curves and performed validation on the test set. Additionally, we employed the ‘ggDCA’ R package to perform decision curve analysis (DCA) for the genetic signature as well as the nomogram model. This extensive analysis aimed to evaluate the clinical relevance of the model and explore its potential applications in real-world medical settings.
2.7 Construction of the prognostic prediction model by hub genesAt the start of the survival research, patients were classified as having high or low hub gene expression based on the best threshold value. Kaplan-Meier plots were created to determine the relationship between the expression of three critical genes and overall survival.
Secondly, key genes pinpointed via univariate Cox regression were chosen as markers for subsequent multivariate Cox regression evaluation. Using the ‘survival’ R package to calculate the median risk score, we compared the low-risk and high-risk groups. The ROC curve was generated with the ‘survivalROC’ package to assess the prediction model’s sensitivity and specificity. The predictive model’s effectiveness was evaluated by the area under the ROC curve (AUC), where a score between 0.5 and 0.7 denotes moderate performance, 0.7 to 0.8 indicates good accuracy, and anything above 0.9 signifies outstanding results. We create a predictive tool using essential genes from the prognostic framework and patient clinical data to estimate the 28-day mortality risk in individuals with sepsis.
2.8 Immune infiltration analysisCIBERSORT analysis was performed on each disease sample to assess the proportions of various immune cells. The CIBERSORT method determines the makeup of immune cells by analyzing gene expression profiles through deconvolution. LM22 has 22 known gene signatures, according to the CIBERSORT website (http://cibersort.stanford.edu/). We assessed 22 unique immune cell types based on the LM22 gene signature using CIBERSORT and 1000 iterations. We selected samples for the next analysis whose CIBERSORT P value was less than 0.05. In order to facilitate comparisons between immune cell types and datasets, the output estimates from CIBERSORT were adjusted to sum to one for each sample. The results were visualized using the R packages ‘corrplot,’ ‘vioplot,’ and ‘ggplot2’. Additionally, the relationship between immune cell infiltration and diagnostic biomarkers was assessed using Spearman’s nonparametric correlation.
2.9 Gene set enrichment analysisInitially, the samples in the dataset were classified as either high or low expression groups based on the expression level of a single key gene. Afterwards, the ‘clusterProfiler’ software was used for GSEA in order to identify the pathways associated with the important genes. An enrichment analysis was performed with a p-value cutoff of below 0.05. Enrichplot was employed to display the top five pathways that either activate or inhibit each gene within the two disease categories.
2.10 Competing endogenous RNAA ceRNA acts as a competitive binding agent for RNA molecules. A ceRNA regulatory network includes the entire set of interactions among ceRNAs, generally involving mRNA, miRNAs, and lncRNAs. We explored miRNAs that associate with hub genes using the databases miRDB (https://mirdb.org/), miRabel (http://bioinfo.univ-rouen.fr/mirabel/), miRWalk (http://mirwalk.umm.uni-heidelberg.de/), and Targetscan (https://www.targetscan.org/vert_80/). Afterward, we employed the lncBase database to find lncRNAs predicted to regulate various miRNAs. The alluvial plot of ceRNA was created using the OmicShare web-based tools.
2.11 Transcriptional regulatory analysisThe Cistrome Data Browser (Cistrome DB) is a specialized data portal for chromatin profiling methods (36, 37). This study explored the relationship between significant genes and TFs using the Cistrome database. The reference genome was aligned to hg38, with the transcription start point positioned at 10 kilobases. The transcription factor regulatory network was displayed using Cytoscape (38).
2.12 Analysis of protein interaction networksThe analysis of DEGs for protein-protein interactions (PPIs) utilized the STRING database (version 12.0). Interactions with an aggregate score exceeding 0.4 were deemed statistically meaningful. Pictures sourced from STRING were altered with Cytoscape, and the MCODE extension identified key interacting genes. For further analysis, all genes capable of interacting within the PPI network were chosen.
2.13 Screening of small molecule compounds and analysis of molecular-ligand interactions through dockingThe CMap database (https://clue.io/) is a resource for predicting drugs based on differential gene expression, mainly utilized to investigate the functional links between genes, small molecules, and diseases. The CMap database conducts transcriptome analysis on cell lines treated with various compounds and investigates the alterations in gene expression relative to untreated controls. The expression patterns of differentially expressed genes in sepsis and ARDS patients were uploaded to the CMap database. Substances with low enrichment scores could potentially alter the expression patterns of the uploaded gene data. After that, enrichment score ranking selected the top 10 small molecule compounds that potentially change uploaded gene expression. These compounds might have the capacity to avert the development of ARDS and sepsis in patients. Furthermore, we implemented Enrichr (https://maayanlab.cloud/Enrichr/) to identify potential molecular compounds could potentially influence critical genes. Enrichr offers numerous gene set libraries for analysis, enabling genome-wide gene-set enrichment exploration.
We prioritized four small molecules that were suggested in the literature to be active in inflammation-related biological processes for molecular docking, and the results showed that they have the potential to be further developed into drugs. Above all, small molecule ligand two-dimensional structures from PubChem were used for molecular-ligand docking investigations. Subsequently, Chem Office 20.0 software was utilized to convert these into 3D models, which were then stored in mol2 format. High-resolution protein target crystal structures from the RCSB PDB library (http://www.rcsb.org/) were chosen as molecular receptors. With PyMOL 2.6.0, the protein structures underwent refinement by eliminating water molecules and phosphate groups, and thereafter were stored as PDB files. MOE 2019 software facilitated energy minimization of the compounds, prepared the target proteins, and pinpointed active sites. Finally, the process of molecular docking was carried out using MOE 2019, with a total of 50 iterations. PyMOL 2.6.0 and Discovery Studio 2019 software were used to visualize the results of binding energy calculations, which were used to determine the binding affinity.
2.14 ScRNA-seq data collectionThe scRNA-seq dataset GSE167363, available in the GEO database, contains single-cell RNA sequencing information of PBMCs from healthy people, sepsis survivors, and those who did not survive gram-negative sepsis. The dataset comprised six samples: GSM5102900 (HC1, PBMCs from a healthy individual), GSM5102901 (HC2, PBMCs from another healthy individual), GSM5102903 (NS1, PBMCs from a non-survivor), GSM5511352 (NS2, PBMCs from another non-survivor), GSM5511354 (S1, PBMCs from a survivor), and GSM5511356 (S2, PBMCs from another survivor).
The GEO repository supplied the single-cell RNA sequencing dataset GSE151263, containing scRNA-seq data of PBMCs from individuals with sepsis and those with sepsis complicated by ARDS. A total of six samples were examined: GSM4569780 (S1, PBMCs from sepsis patients), GSM4569781 (S2, PBMCs from sepsis patients), GSM4569785 (NS1, PBMCs from non-survivors), GSM5511352 (SA1, PBMCs from non-survivors), GSM5511354 (S1, PBMCs from patients with sepsis and ARDS), and GSM4569786 (SA2, PBMCs from patients with sepsis and ARDS).
2.15 scRNA-seq data processing and analysisTo control for batch effects, we implemented the following steps: 1) Gene and Cell Filtering: We filtered the data using parameters of min.cells = 3 and min.features = 200, ensuring each cell expressed at least 200 genes and each gene was expressed in at least 3 cells. This reduced the impact of low-quality data; 2) Normalization: The gene expression matrix was standardized using the “NormalizeData” and “FindVariableFeatures” functions. “NormalizeData” ensured consistent expression levels, while “FindVariableFeatures” identified the top 2000 highly variable genes (HVGs) for further analysis; 3) Controlling Confounding Factors: Using the “ScaleData” function, we standardized HVG expression while accounting for mitochondrial and hemoglobin genes (“percent.mt,” “percent.HB”), minimizing their influence as confounding factors. This function also applied z-score normalization to the HVG matrix; 4) Batch Effect Removal: The “RunHarmony” function was used to correct for batch effects, integrating datasets to ensure a uniform distribution of cells with similar characteristics across batches; 5) Dimensionality Reduction: After Harmony correction, we applied UMAP via the “RunUMAP” function for dimensionality reduction, visualizing cell distribution and confirming batch effect removal.
Before data integration, we preprocessed raw data by filtering cells, retaining those that expressed at least 200 genes and genes expressed in at least 3 cells, mitigating low-quality data. Seurat objects were created, and the expression data was normalized, identifying the top 2000 HVGs. We also accounted for mitochondrial and hemoglobin gene proportions using the “ScaleData” function. After merging datasets, the “RunHarmony” function was employed for batch correction, followed by principal component analysis (PCA) for feature selection. Dimensionality reduction was performed using UMAP and t-SNE for visualization. Clustering was carried out using the “FindNeighbors” and “FindClusters” functions, with clusters visualized through UMAP plots. Marker genes were identified using “FindAllMarkers,” and cell types were annotated based on clustering results, followed by cell proportion analysis and further visualizations.
2.16 Isolation of PBMCs, RNA extraction and RT-qPCR analysisPatients who were eligible for sepsis (n=16) or sepsis-induced ARDS (n=15) within 24 hours in the intensive care unit of Shanghai Pulmonary Hospital were included in this study. Patients met the following criteria: 1) Patients aged 18 years or older; 2). The Third International Consensus Definitions for Sepsis (Sepsis-3) were used to diagnose sepsis (2). 3) Patients diagnosed with ARDS patients who met the ARDS criteria updated by the European Society of Intensive Care Medicine (ESICM) in July 2023 (39). Our study was approved by the Research Ethics Committee of Our study was approved by the Research Ethics Committee of Shanghai Lung Hospital (No. Q24-410), and informed consent was obtained from all participants. A table of the clinical characteristics of our collected patients is shown in Table 2.
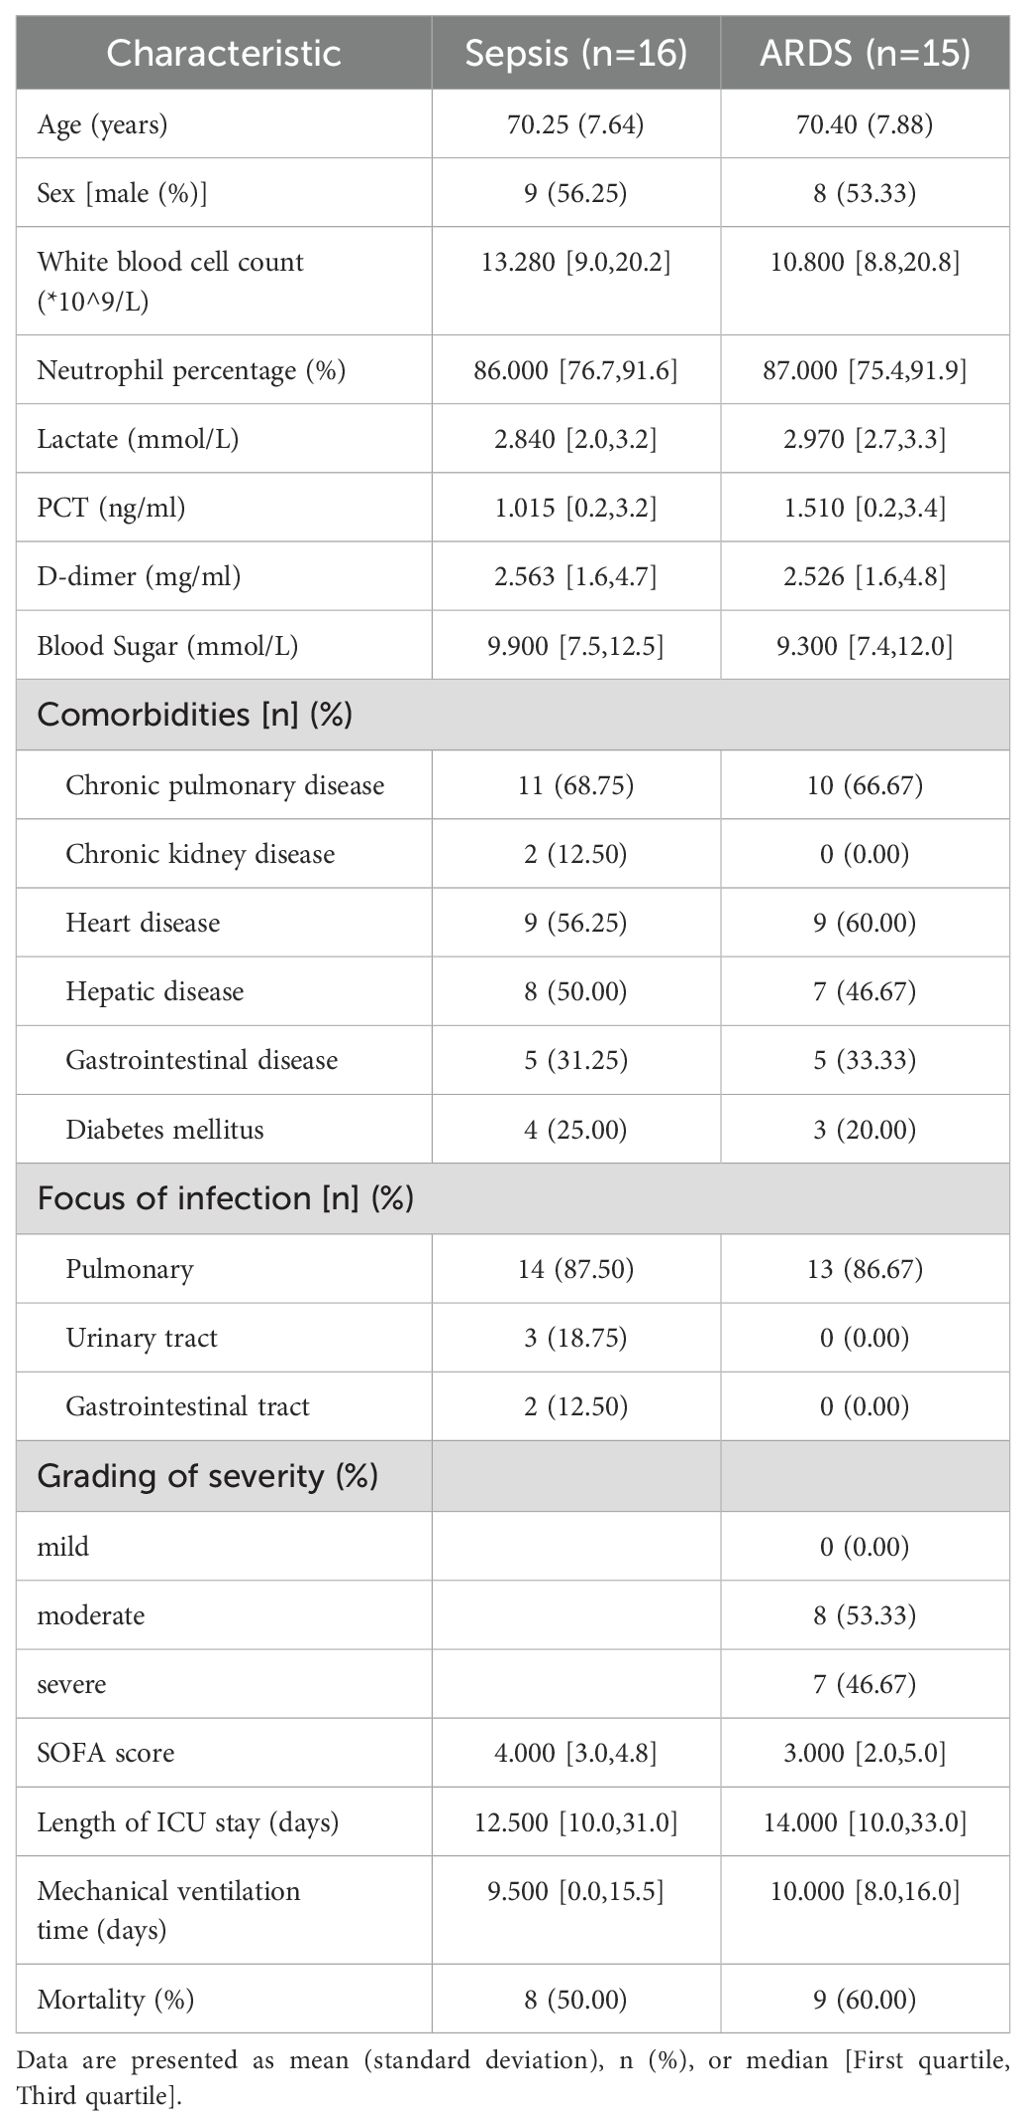
Table 2. Baseline characteristics of patients with sepsis and ARDS.
We collected blood of patients or controls and diluted with PBS (Servicebio, Wuhan, China). Subsequently, we meticulously applied blood onto the Lymphoprep density gradient medium provided by STEMCELL Technologies, located in Vancouver, BC, Canada. Following a 30-minute centrifugation at 700g, the PBMCs layer located in the middle of the solution was gently removed. After resuspending PBMCs in PBS, we added Red Blood Cell lysis buffer (Beyotime, Shanghai, China) and let it stand at room temperature for 10 minutes. We acquire the PBMCs by centrifuging at 300g for five minutes.
Total RNA was extracted from PBMCs using TRIzol reagent (Invitrogen, Carlsbad, California, USA). Subsequently, RNA was transformed into cDNA using the Hifair III First Strand cDNA Synthesis SuperMix for qPCR (Yeasen, Shanghai, China). Yeasen’s Hieff qPCR SYBR® Green Master Mix (Shanghai, China) was employed to perform real-time quantitative PCR (RT-qPCR). The 2-DDct technique was employed to determine relative gene expression levels. GAPDH was utilized as a control benchmark. Each experiment was conducted three times. The RT-qPCR primers for persons are as follows: GAPDH forward GGAGCGAGATCCCTCCAAAAT, reverse GGCTGTTGTCATACTTCTCATGG; CX3CR1 forward AGTGTCACCGACATTTACCTCC, reverse AAGGCGGTAGTGAATTTGCAC; PID1 forward TCCTGGAAATCCGGCCATTC, reverse AGGTCATCATTGATCTCCCTGT; PTGDS forward GGCGTTGTCCATGTGCAAG, reverse GGACTCCGGTAGCTGTAGGA. The RT-qPCR primers for mice are as follows: GAPDH forward AGGTCGGTGTGAACGGATTTG, reverse GGGGTCGTTGATGGCAACA; CX3CR1 forward GAGTATGACGATTCTGCTGAGG, reverse CAGACCGAACGTGAAGACGAG; PID1 forward AAGGAACCTATACCAGCAGTCC, reverse CCTTGCAGCCACTATGAGTCC; PTGDS forward GAAGGCGGCCTCAATCTCAC, reverse CGTACTCGTCATAGTTGGCCTC.
2.17 Rodent sepsis model caused by cecal ligation and punctureEight to ten-week-old, pathogen-free C57BL/6 male mice in good health were obtained from Shanghai Slack Laboratory Animal Co., LTD [license number: SExK(shanghai)2022-0004]. The rodents were sedated using a 2% solution of sodium pentobarbital at a dosage of 110 mg per kilogram. After shaving and disinfecting the abdomen with hair removal cream and povidone-iodine, a 1.0-2.0 cm incision along midline under diaphragm was made to expose cecum. The process of CLP was used to create sepsis, involving partial ligation of the cecum and two punctures with an 18-gauge needle, followed by gentle compression to expel a minor amount of cecal material. After repositioning the cecum back into the abdominal cavity, the incisions in the muscle and skin were sutured with 4-0 silk. The control group experienced the identical process, excluding cecal ligation and puncture. Following the operation, the mice were revived with a subcutaneous injection of 1 ml of phosphate-buffered saline heated to 37°C. Twenty-four hours post-CLP surgery, lung samples and peripheral blood were gathered for subsequent examination was collected from mice. In addition, we also gave mice airway inhalation of LPS (Solarbio, China) at 10 mg/kg to induce the development of ARDS.
For the mice undergoing drug intervention, the following drugs were administered: SB 216763 (Yeasen, Shanghai, China) at a dosage of 3 mg/kg, Withaferin A at 2 mg/kg, sodium dichloroacetate (Macklin, Shanghai, China) at 10 mg/kg, Epothilone B (Aladdin, Shanghai, China) at 1 mg/kg, and the CX3CR1 inhibitor AZD8797 (Bidepharm, China) at 3 mg/kg, as well as PTGDS protein from MedChemExpress (MCE, NJ, USA) at 0.5 mg/kg. All drugs were administered via tail vein injection, and after 3 hours, the mice were subjected to modeling. Following modeling, serum and lung tissue samples were collected to assess the therapeutic effects of the drugs on the mice.
2.18 Enzyme-linked immunosorbent assay, H&E staining and lung damage assessmentAfter mice were anesthetized, blood was drawn from the heart, coagulated at 25°C for 2 h, and centrifuged (2,000 × g, 4°C for 20 min). Serum is then collected. The blood levels of the pro-inflammatory cytokine IL-6 was measured using an ELISA kit (Thermo Fisher Scientific, Waltham, MA, USA) following the manufacturer’s protocol with purified serum. According to the instructions of the H&E staining kit, lung tissues were encased in paraffin, dewaxed, rehydrated, and then stained using hematoxylin and eosin. The stained sections were then mounted on slides and examined under the optical microscope. The degree of lung injury was assessed using a semiquantitative scoring method (40). Specifically, lung damage is defined by four key factors: fluid buildup, hemorrhage, neutrophil presence or aggregation in the alveolar space or vessel wall, and the thickening of the alveolar wall and/or formation of a hyaline membrane. The standards for assessing pathological findings were: 0 for no damage; 1 for minor and limited damage (less than 25%); 2 for moderate damage (25-50%); 3 for extensive or significant damage (50-75%); and 4 for severe and most significant damage (over 75%). Each item was rated from 0 to 4. The four scores were then summed to determine the lung injury score, which ranged from 0 to 16. Two independent researchers evaluated the lung injury score, and if their assessments differed, the average of their scores was taken.
2.19 Statistical analysisThe data were analyzed using R (version 4.3.3). The “limma” package identified differentially expressed genes. For continuous variables, independent t-tests and one-way ANOVA were applied to normally distributed data, while the Mann-Whitney U test and Kruskal-Wallis test were used for non-normally distributed data. Results were expressed as mean ± standard deviation for normal distributions, and median (interquartile range) for non-normal distributions. Categorical variables were analyzed using chi-square or Fisher’s exact tests. Pearson correlation assessed the relationship between hub genes and clinical features, and logistic regression explored the diagnostic significance of CX3CR1, PTGDS, and PID1 in sepsis and ARDS. A multivariable Cox regression model was used to predict 28-day mortality in sepsis patients based on hub genes. Kaplan-Meier survival curves and log-rank tests compared overall survival rates. ROC curves (pROC package) were used for binary classification prediction, and Spearman correlation assessed the relationship between hub gene expression and immune cells. Experimental data were expressed as mean ± standard deviation from at least three independent experiments, and statistical significance was determined using unpaired two-tailed Student’s t-tests (*P < 0.05; **P < 0.01; ***P < 0.001). Statistical analysis and graphics were generated with GraphPad Prism 9.0, and figures were edited using Adobe Illustrator.
3 Results3.1 The study framework and workflowThe workflow of the study design is depicted in Figure 1. First, we obtained sepsis and ARDS RNA-seq datasets from the GEO database (Table 1). Furthermore, we utilized comprehensive bioinformatics and WGCNA to identify gene modules, and emphasized crucial genes through three machine learning techniques: LASSO regression, Boruta and Random Forest. Then we found three critical hub genes (CX3CR1, PTGDS and PID1) and verified their diagnostic efficacy. Analysis of immune infiltration was then performed to figure out the relationship of three biomarkers and immune cells. We also constructed ceRNA network, PPI network and predicted TFs-hub genes interaction. Afterwards, we made predictions about the prospective medications or chemical compounds that may interact with hub genes. Additionally, we conducted molecular docking to confirm the interaction between the compounds and hub genes. We performed additional verification of the expression levels of crucial genes found in the scRNA-seq datasets for sepsis and ARDS. In order to confirm our bioinformatics results by RT-qPCR, we finally gathered our own PBMCs samples from healthy persons, sepsis patients, ARDS patients, as well as mice models. In addition, we also conducted different types of drug intervention on model mice and tested the therapeutic effects. It is anticipated that the association of genes identified here between sepsis and ARDS will offer novel insights into the biological mechanisms that underlie both diseases.
3.2 Identification of common DEGs between sepsis and ARDSAn overall number of 6038 DEGs were discovered in the sepsis dataset GSE65682. Of these DEGs, 3621 were up-regulated, whereas 3641 were down-regulated. The sepsis dataset GSE95233 included 7260 DEGs, with 3620 indicating up-regulation and 3640 showing down-regulation. Furthermore, 657 DEGs related with ARDS were discovered, including 153 upregulated and 504 downregulated genes. Using the volcanic maps, the expression pattern of each DEG in connection to sepsis (Figures 2A, B) and ARDS (Figure 2C) was demonstrated. Venn diagrams displayed that 242 overlapping differentially expressed genes were identified from GSE65682 dataset, GSE95233 dataset and GSE32707 dataset (Figure 2D). Results of differential expression analysis suggested that sepsis and ARDS may share some mechanistic similarities.
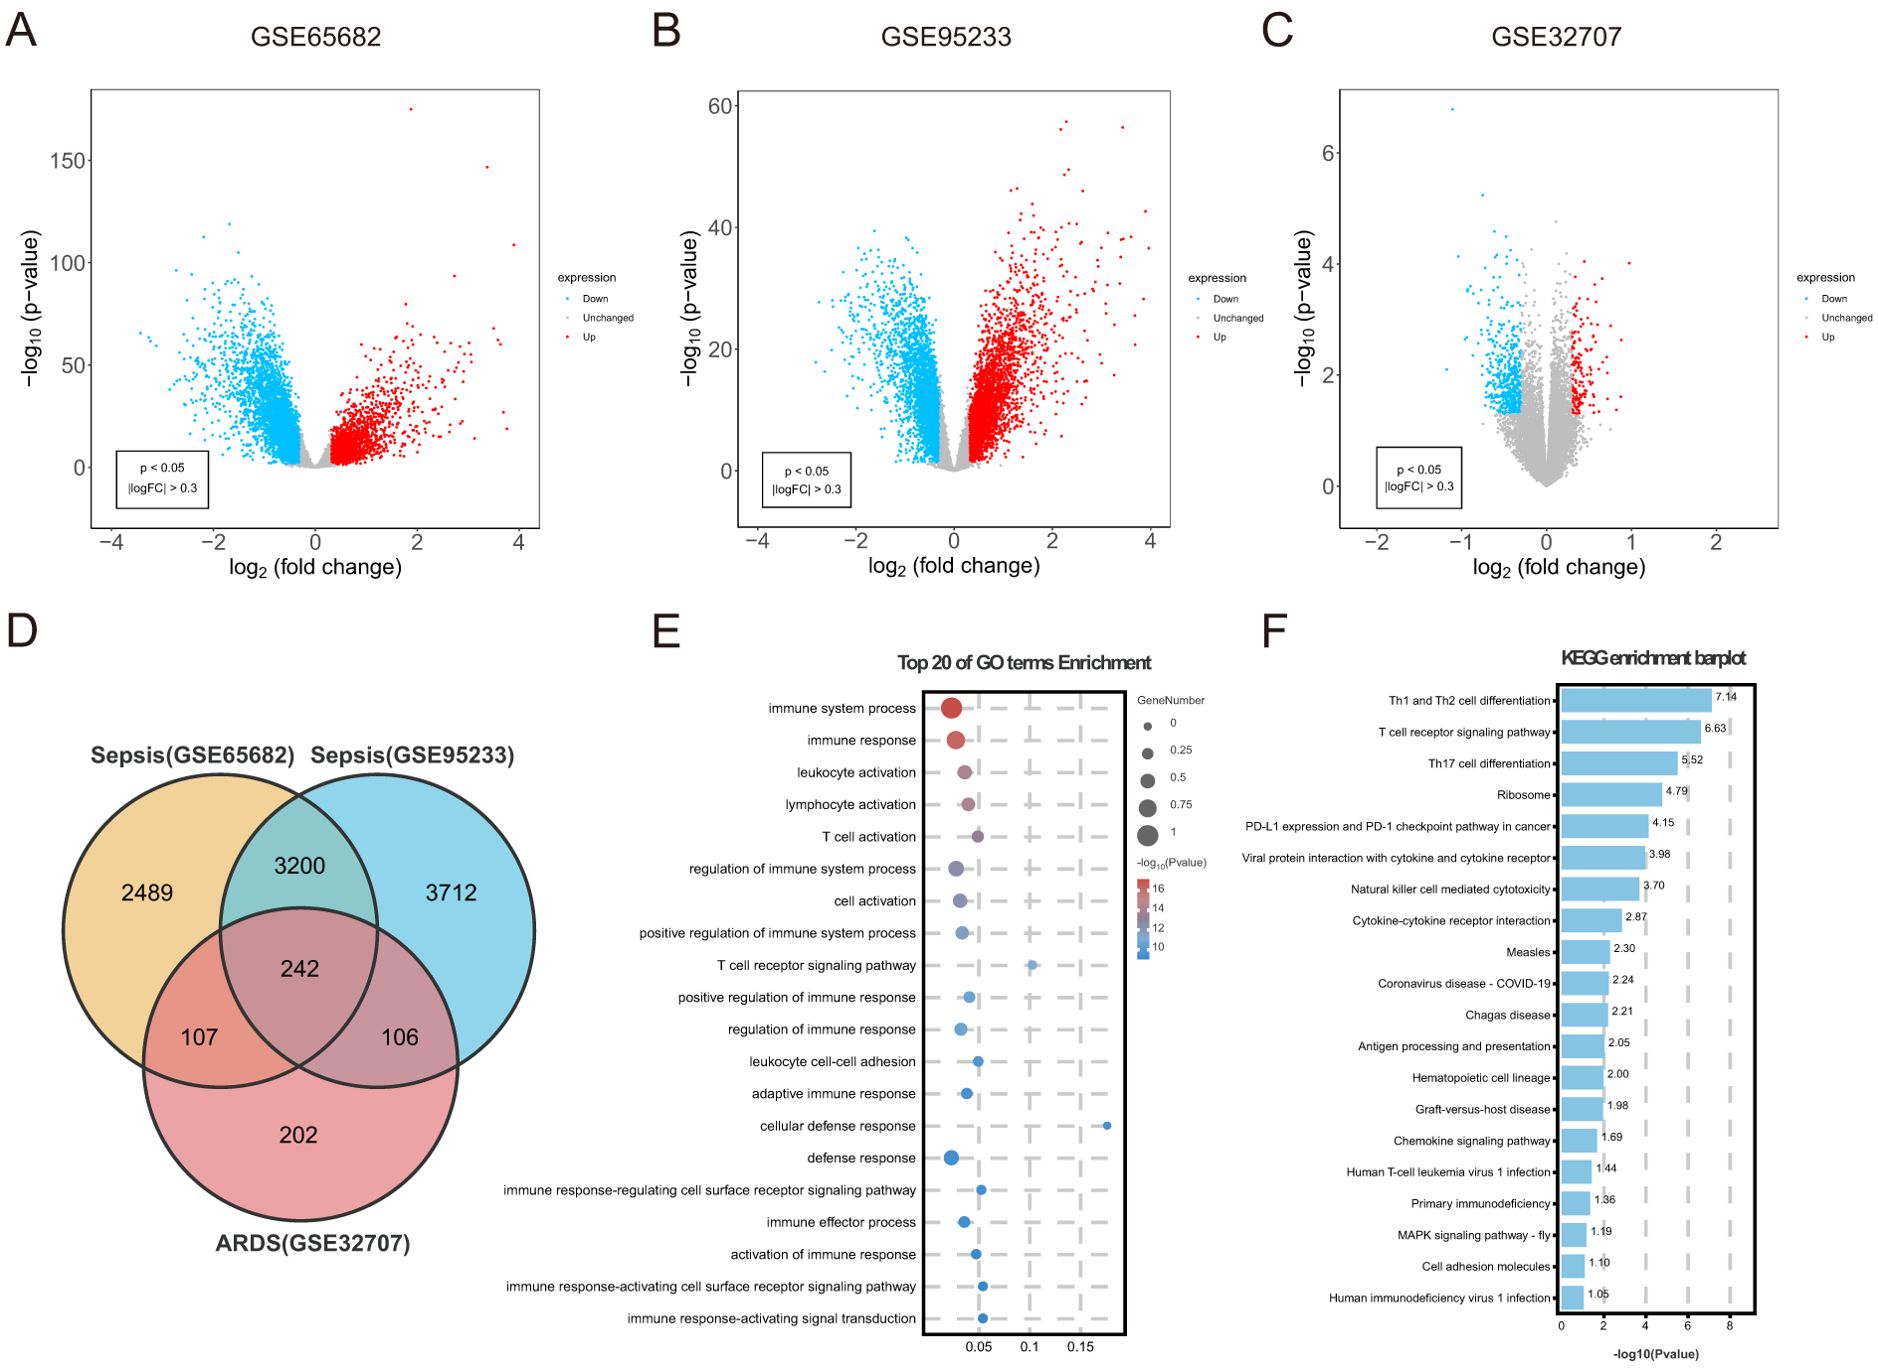
Figure 2. Identification of common DEGs between sepsis and ARDS, followed by GO and KEGG analysis. (A) DEGs shown on a volcano plot in GSE65682. (B) DEGs shown on a volcano plot in GSE95233. (C) DEGs shown on a volcano plot in GSE32707. (D) The shared DEGs between sepsis and ARDS by overlapping the DEGs of them. (E) GO enrichment analysis bubble graph for down-regulated DEGs. The larger bubble represents enrichment of more genes, and the increasing depth of red color represents more significant differences. (F) Histogram for KEGG enrichment in down-regulated DEGs.
3.3 Examination of common genes and their functional significanceTo understand the biological functions and pathways linked to sepsis and ARDS, GO enrichment and KEGG pathway analyses were conducted on the 242 common differentially expressed genes. During the GO enrichment analysis, the down-regulated DEGs were mainly linked to immune system activities, leukocyte activation, and T cell activation (Figure 2E). This implies that immune system suppression and the programmed death of immune cells might be crucial in the simultaneous onset of sepsis and ARDS. For these up-regulated genes, DEGs mainly contributed to the proteasome-mediated ubiquitin-dependent protein degradation and protein breakdown processes.
Additionally, KEGG pathway analysis demonstrated that these upregulated genes had a significant connection with platelet activation, autophagy, and human T-cell leukemia virus infection (Supplementary Figure S1B). Apoptosis caused by sepsis occurs through pathways involving death receptors and mitochondria. Additionally, KEGG analysis indicated that these frequently down-regulated genes were involved in Th1 and Th2 cell differentiation, NK cell-mediated cytotoxicity, antigen processing and presentation, and cytokine-cytokine receptor interactions (Figure 2F). Immunosuppression is increasingly acknowledged as a significant contributor to mortality in sepsis (41). Likewise, patients with ARDS often experience immunosuppression, and their mortality rates are higher compared to immunocompetent individuals (42).
3.4 Identifying crucial modules using WGCNAWGCNA was conducted to explore the possible correlations among significant genes and illnesses. Using the soft-thresholding technique, a co-expression network was constructed, with the parameter β playing a crucial role in maintaining a scale-free topology (Figures 3A, C). Gene expression data typically produce biological networks that exhibit a scale-free topology. In the sepsis group, a fit index exceeding 0.9 indicated a scale-free topology, with the parameter β set to 7. Utilizing the adjacency function, an adjacency matrix was generated, followed by hierarchical clustering based on the TOM dissimilarity measure (Supplementary Figures S1C, E).
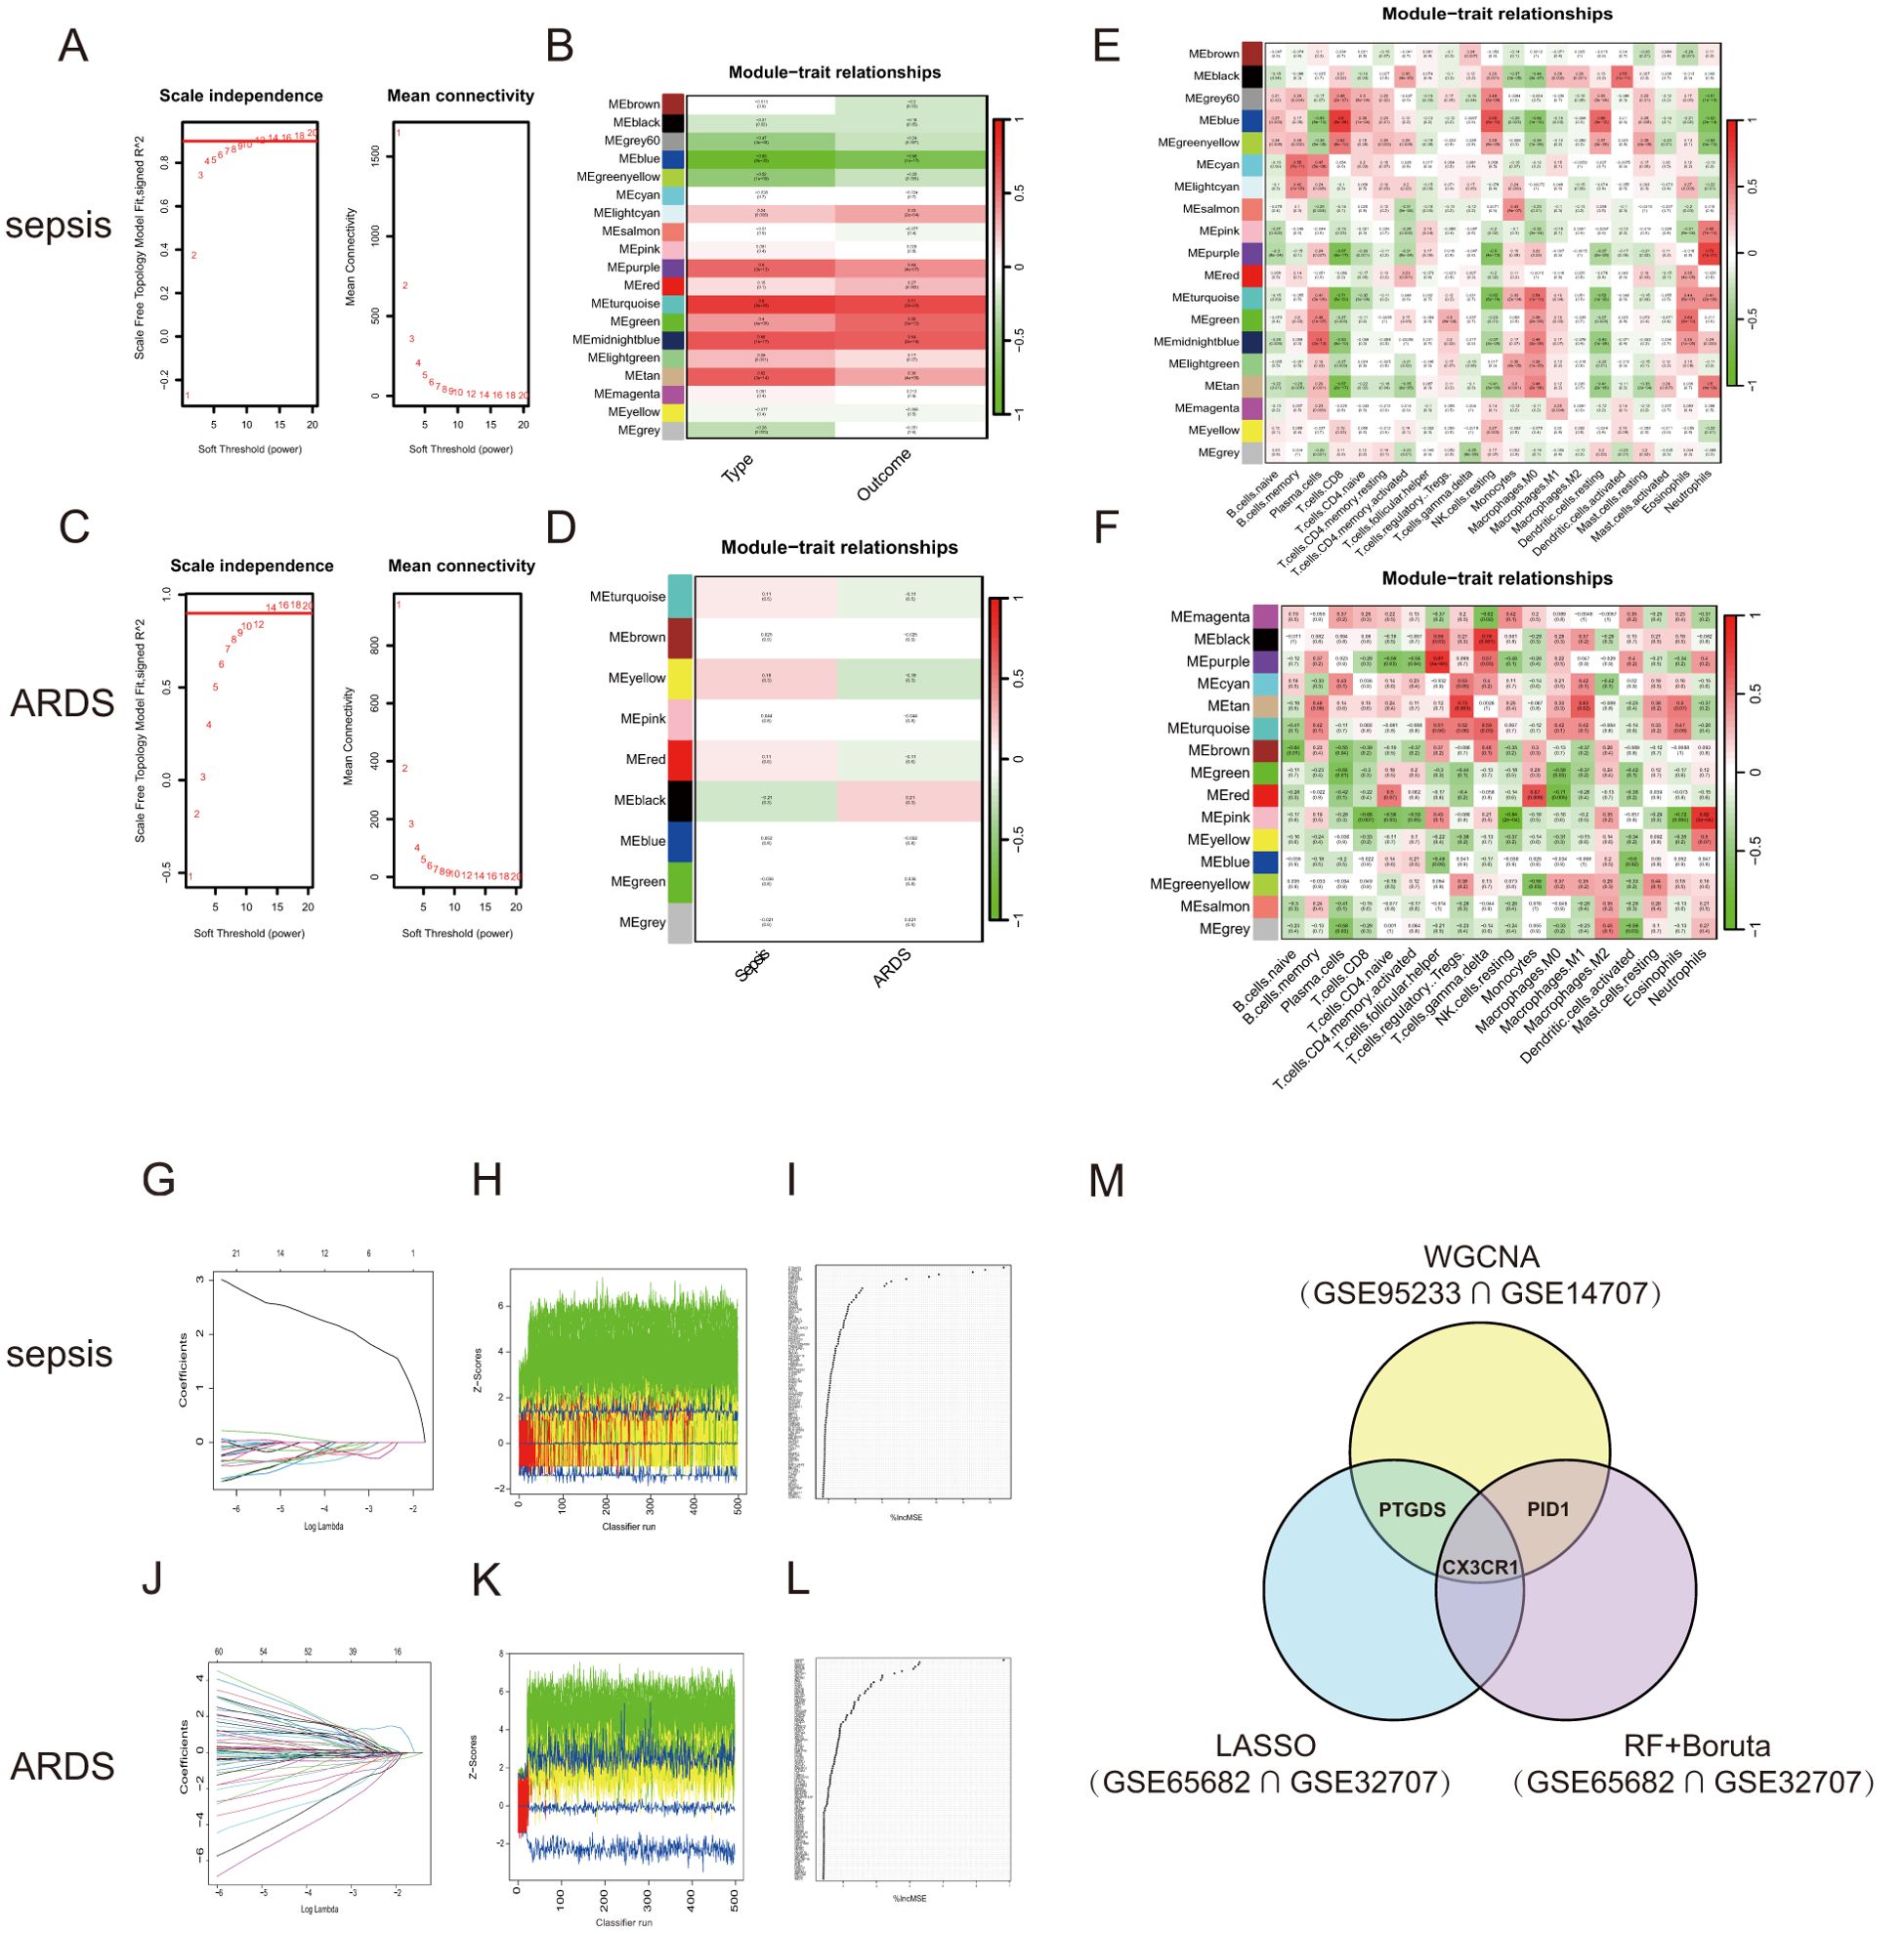
Figure 3. WGCNA and Machine learning in screening candidate diagnostic biomarkers for sepsis and ARDS. (A) Identifying the soft-threshold power in sepsis using GSE95233. (B) Interconnections among modules and traits in sepsis. Correlation coefficients and P values are incorporated in each cell. (C) Estimation of the soft-threshold power for ARDS using GSE10474. (D) Associations between modules and traits in ARDS. (E) Correlation heatmap between module eigen genes and immune infiltration cells in sepsis. (F) Correlation heatmap between module eigen genes and immune infiltration cells in ARDS. (G, J) The LASSO regression was used to identify the minimum and lambda values for diagnostic biomarkers for sepsis and ARDS. (H, K) The utilization of the Boruta aimed at identifying common diagnostic genes of sepsis and ARDS. (I, L) Genes in sepsis and ARDS identified for their discriminatory power in the RF algorithm. (M) Venn diagram shows that three candidate diagnostic genes are identified via the above three algorithms and WGCNA.
We looked for the most significant connections after correlating sepsis clinical features to modules. Figure 3B showed the correlation values between the modules and traits (type: Sample types of healthy or sepsis patient, and outcome: whether sepsis patients died). This study found that the turquoise module had the most significant link to the onset of sepsis and its unfavorable outcome. We further selected 1478 genes with |MM| > 0.6 and |GS| > 0.6. Following the examination of gene module interactions, topological overlap matrix charts for a gene network were created using the related hierarchical cluster dendrograms and modules (Supplementary Figure S1D). Figure 3E illustrated the relationship between gene modules and immune cell characteristics in sepsis. Likewise, the ARDS cohort was subjected to WGCNA, pinpointing β = 14 as the optimal soft power value (Figure 3C). The dark module, containing 3351 genes, showed the strongest positive association with ARDS occurrence (Figure 3D). Figure 3F demonstrated the connections between various gene modules and multiple immune cell characteristics in ARDS. The genes found in the crucial modules of both groups could act as potential markers specific to certain cell types.
3.5 Identification of shared diagnostic markers using machine learning techniquesWe applied three machine learning techniques—LASSO regression, Random Forest, and Boruta—to the GSE65682 and GSE32707 datasets to pinpoint the top predictors for sepsis and ARDS. We utilized the ‘glmnet’ library to perform LASSO regression analysis (Figures 3G, J; Supplementary Figures S1G, H). To enhance the identification of diagnostic biomarkers, we developed a random forest (RF) model using the ‘randomForest’ package in R, as shown in Figures 3I, L. Additionally, we employed the Boruta algorithm for further analysis (Figures 3H, K; Supplementary Figures S1I, J). Combining the findings from both algorithms and WGCNA, three shared biomarkers (CX3CR1, PID1 and PTGDS) were discovered for both the sepsis and ARDS groups. A Venn diagram (Figure 3M) was used to display the overlap of the top three critical genes identified by LASSO regression, Random Forest, Boruta, and WGCNA. We proposed that these three genes could be linked to the onset of sepsis and ARDS, sharing a mutual connection.
3.6 Creating a predictive tool for diagnosing sepsis and ARDS, along with assessing its accuracyA predictive model for sepsis was created using three crucial genes—CX3CR1, PID1, and PTGDS—to enhance diagnostic precision. Each risk factor received a score, and these individual scores were aggregated to determine the total score for estimating the probability of sepsis in each patient (Figure 4A). Figure 4B illustrates that the calibration curves in the dataset closely matched the standard curve, demonstrating the nomogram’s high precision in forecasting sepsis. The ROC curve analysis indicated an AUC of 0.966 for the risk score within the discovery dataset, as shown in Figure 4C. Similarly, the risk score’s AUC was 0.941, 0.989, and 0.933 when the ROC curve was generated with the validation dataset (Figures 4D–F). Figures 4C–F depict the expression levels of the three critical genes. The results suggested that the risk-score model has strong predictive capabilities, with the three main diagnostic biomarkers being crucial in the progression of sepsis.
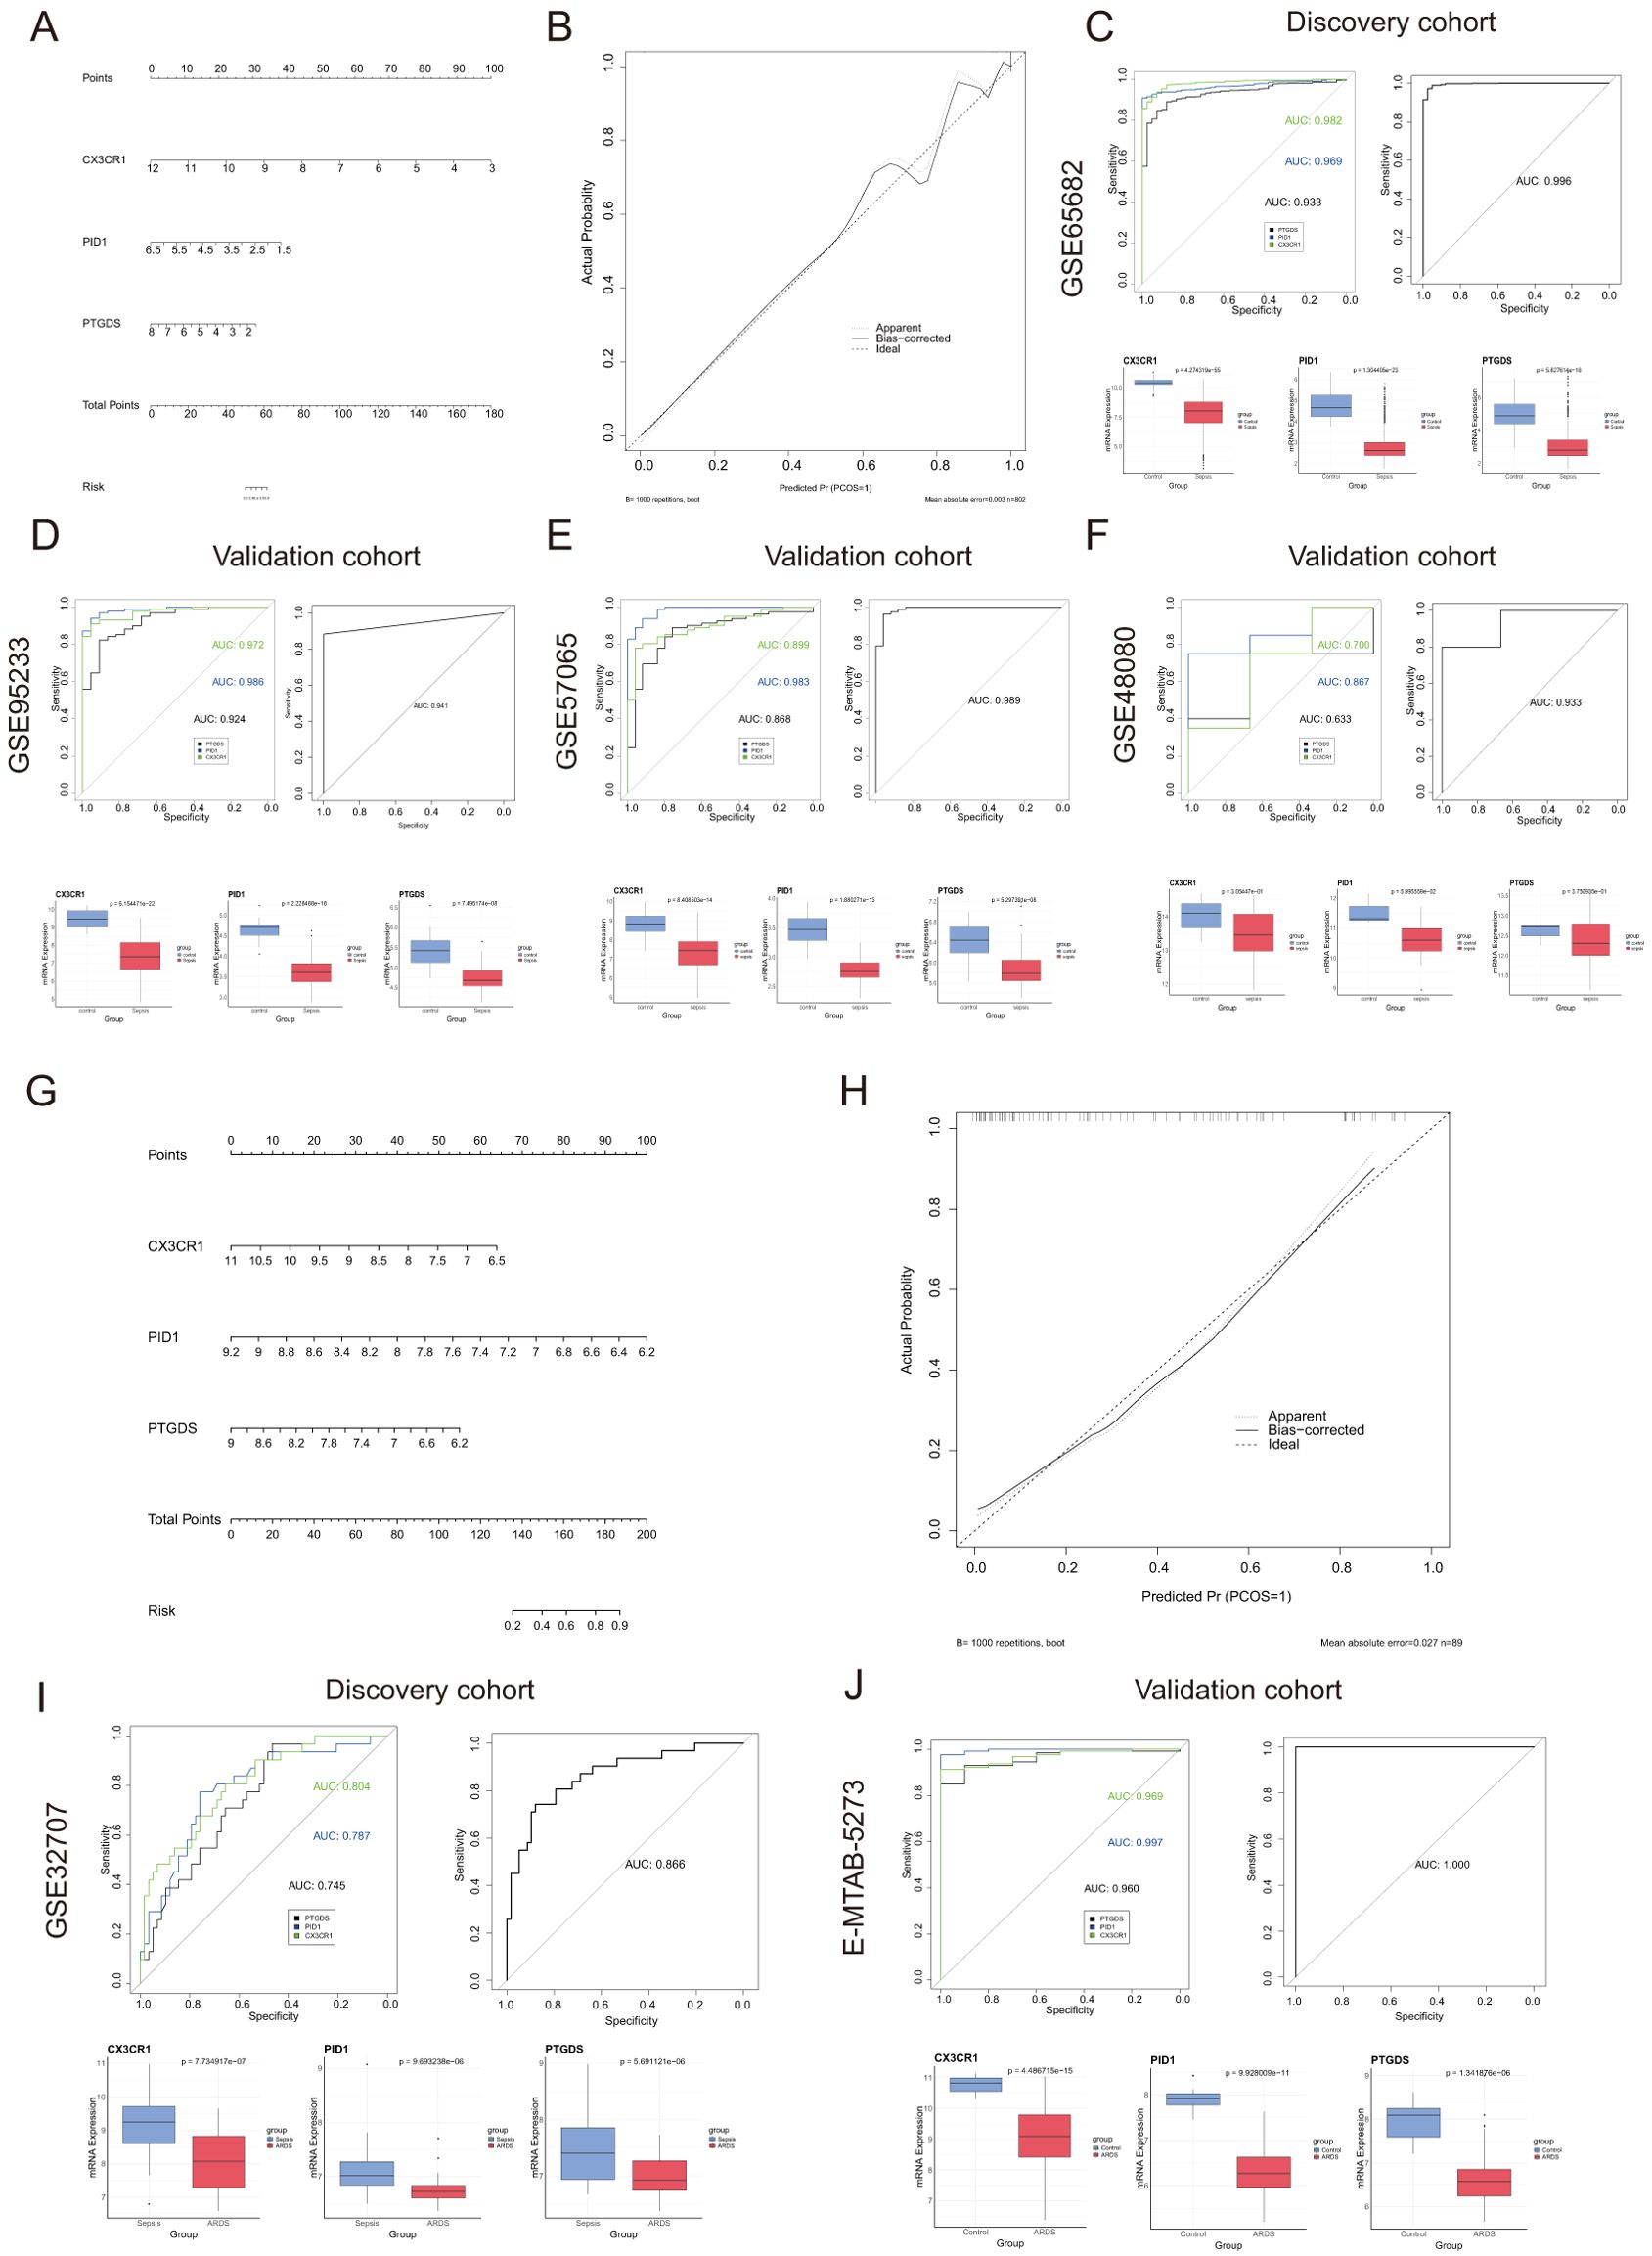
Figure 4. Nomogram construction and the diagnostic value evaluation in sepsis and ARDS. (A) Nomogram constructed based on the diagnostic biomarkers for risk prediction of sepsis using GSE65682. (B) Calibration curve for assessing the performance of the nomogram. (C–F) ROC curve and the CX3CR1, PID1 and PTGDS expression levels in the discovery cohort and the validation cohort in sepsis. (G) The visible nomogram for diagnosing ARDS using GSE32707. (H) Calibration curves were used to evaluate the predictive performance of the nomogram model. (I, J) The ROC curve of each candidate gene and the gene expression levels show the significant ARDS diagnostic value.
Similarly, we developed a nomogram specifically for ARDS patients utilizing these three unique genes (Figure 4G). The model achieved a remarkable AUC score of 0.866 when analyzing the ROC curve (Figure 4I). Additionally, we confirmed the expression of the critical genes in an external dataset (E-MTAB-5273, Figure 4J). Figure 4H illustrated that the calibration curve results validated the remarkable precision of the nomogram model in predicting patient outcomes for ARDS. As shown in Figures 4I, J, the levels of CX3CR1, PID1 and PTGDS gene expression were found to be lower in the ARDS group induced by sepsis compared to both the sepsis-only and control groups.
3.7 Creation and validation of a forecasting model for outcomes in sepsis and ARDSWe categorized the sepsis dataset by patient survival outcomes and examined the mRNA expression levels of the genes CX3CR1, PID1, and PTGDS. Among the three genes, the highest expression levels were observed in the healthy control group, with the sepsis survivor group showing intermediate levels, and the sepsis non-survivor group exhibiting the lowest levels (Figures 5A–C). This implied that these genes are linked to the prognosis of sepsis patients. Kaplan-Meier curves indicated that low levels of CX3CR1, PID1, and PTGDS were correlated with poor overall survival (OS) (Figures 5D–F). A multivariate Cox regression analysis incorporated these genes to develop a prognostic model aimed at forecasting 28-day mortality in individuals with sepsis. The formula is presented in Additional file 1: Table S1. According to the median risk score, 479 sepsis patients were divided into high-risk (n=239) and low-risk (n=240) categories (Supplementary Material: Table S1). According to Figure 5G, the 28-day mortality rate was significantly elevated in the high-risk cohort. The ROC curve showed an AUC of 0.800, indicating good model accuracy for predicting 28-day mortality (Figure 5H). External validation using the GSE95233 and GSE54514 datasets showed AUC values of 0.856 and 0.707, respectively (Figures 5I, J). Moreover, the model reliably predicted ARDS outcomes, achieving AUC scores of 0.812 (Figure 5K). Consequently, this 3-gene signature may effectively predict the prognosis of sepsis and ARDS, further supporting its clinical value.
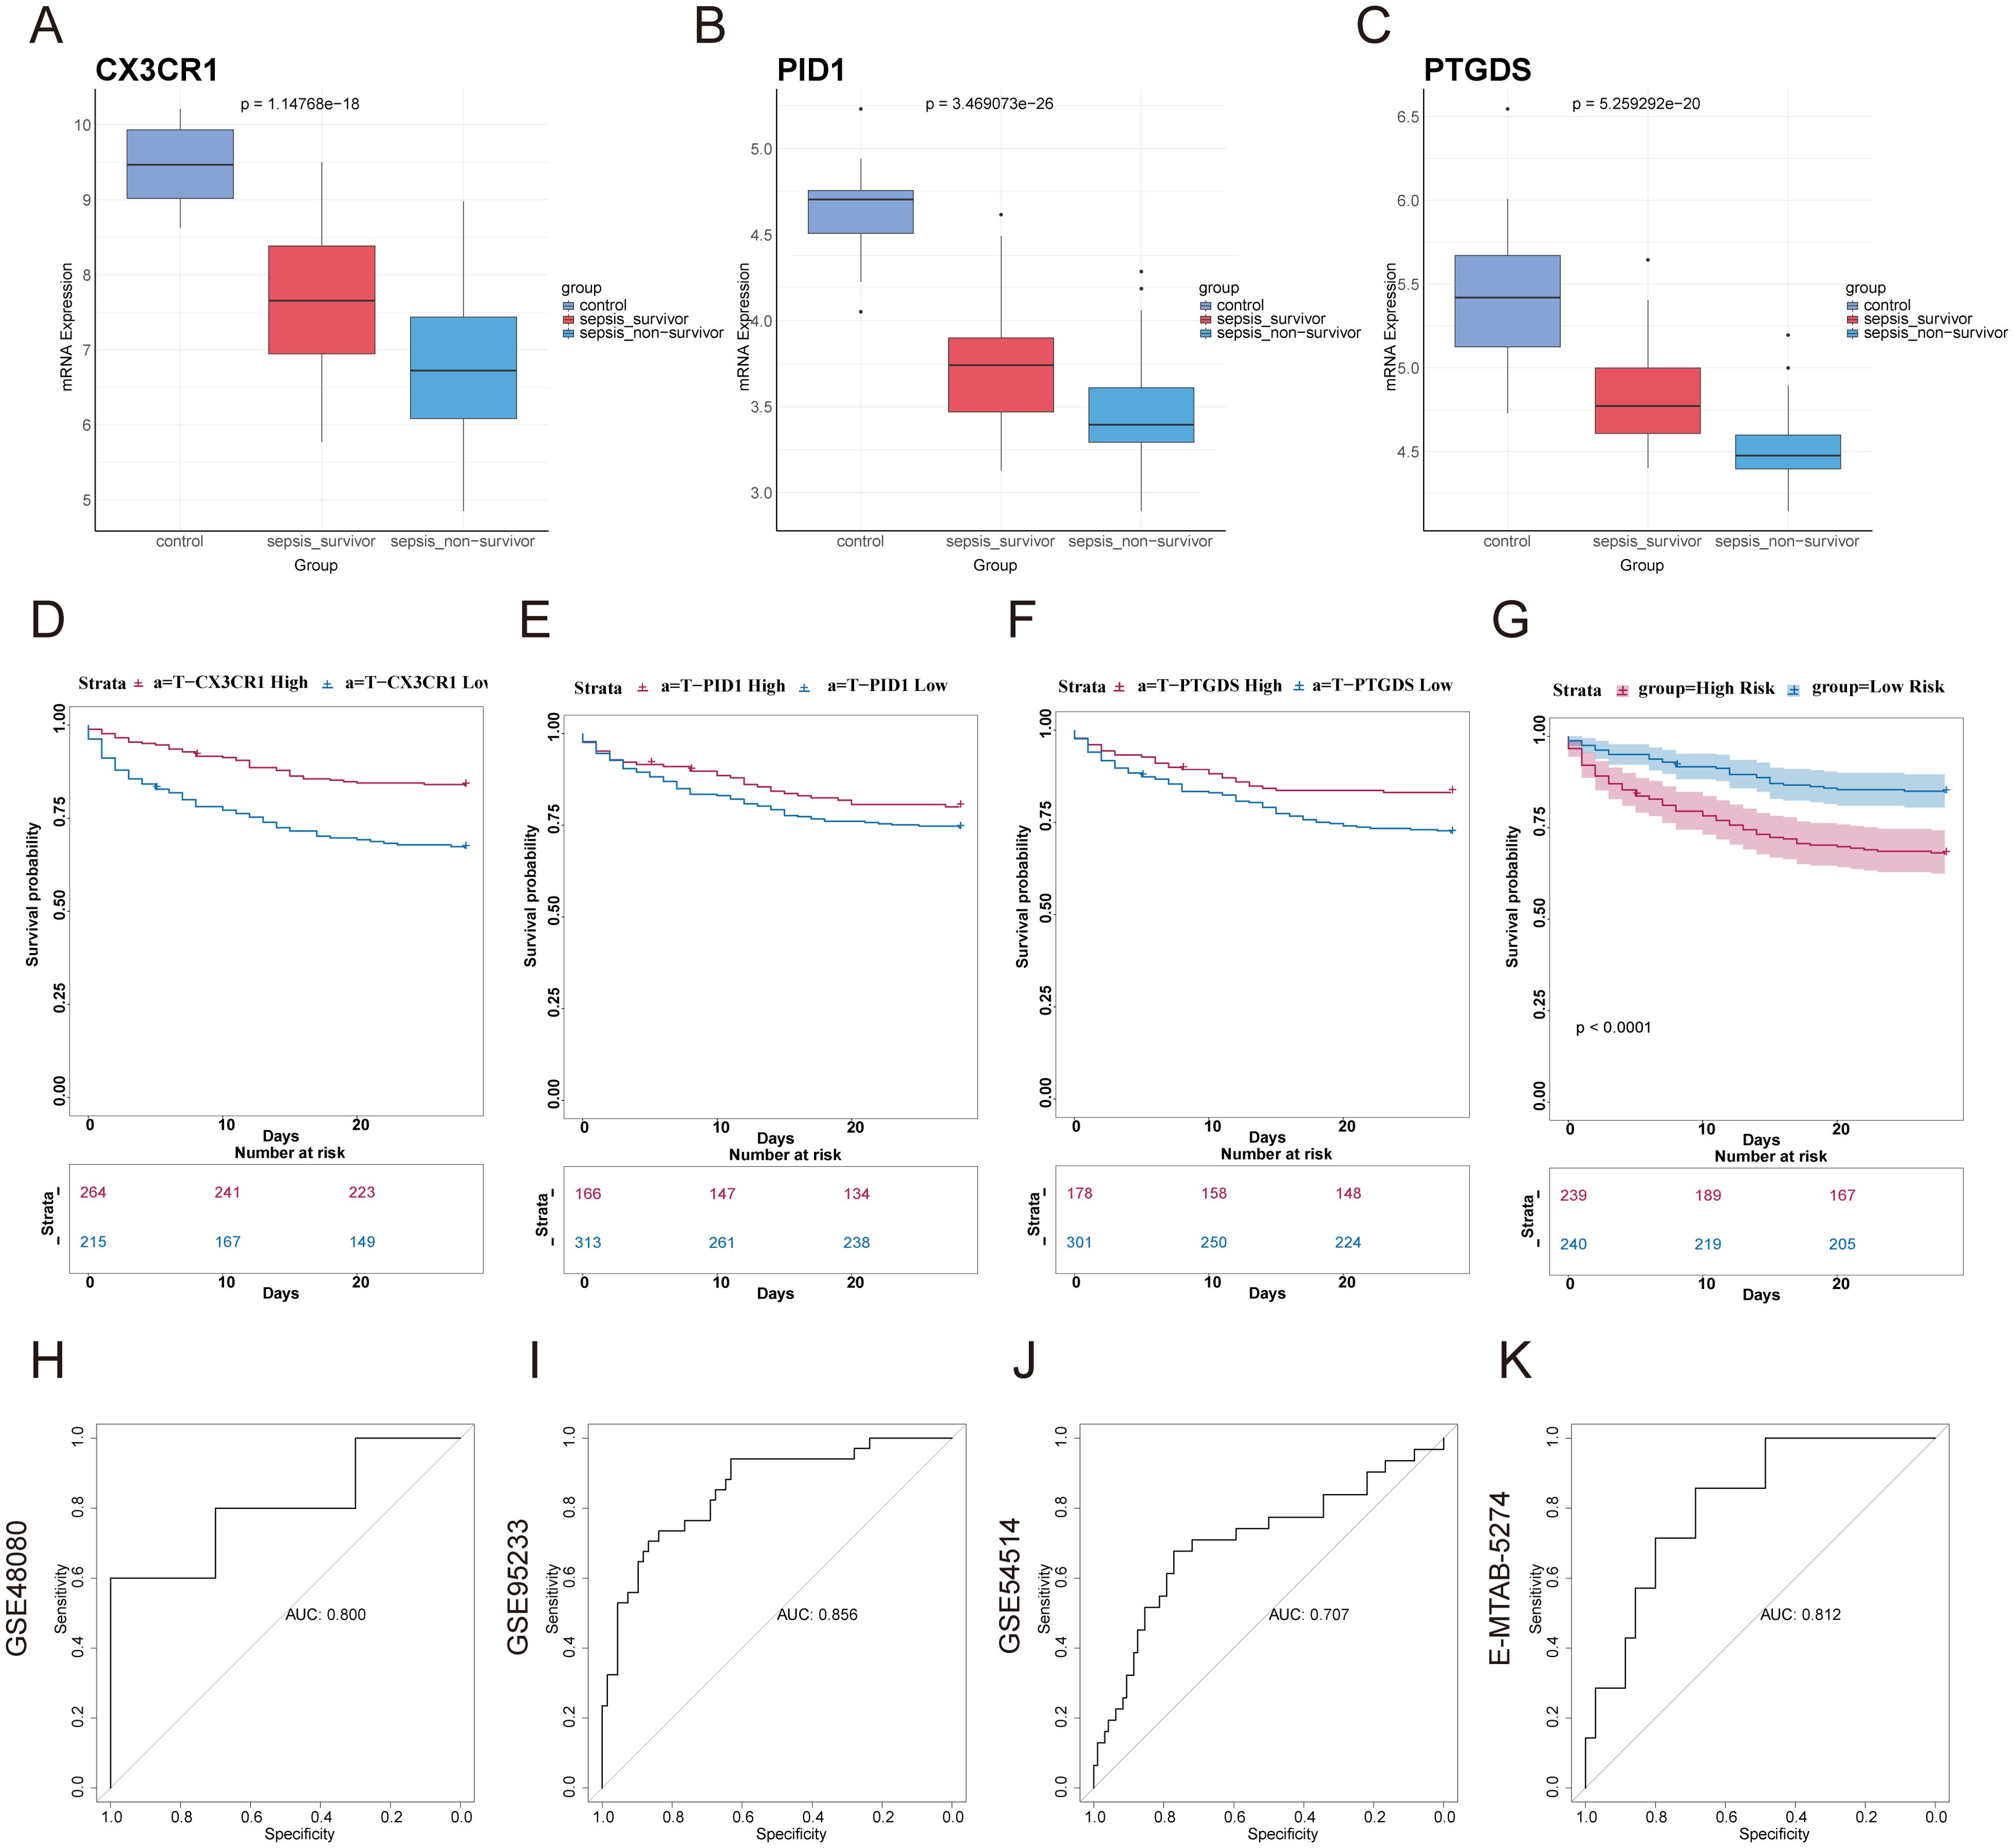
Figure 5. Construction of prognostic model based on hub genes and prognostic efficacy in sepsis and ARDS. (A–C) The expression levels of the three genes were analyzed in the healthy control group, sepsis survivor group, and sepsis non-survivor group from the dataset GSE95233. (D–F) Using GSE65682, Kaplan–Meier survival analysis was performed to assess the prognostic value of these candidate genes in sepsis. (G) Kaplan-Meier survival analysis of 28-day mortality between high-risk (red) and low-risk (blue) groups in sepsis. The color of each survival line indicated the 95% Cl of probability of survival at each time point. (H) The ROC curve showed the AUC value of the prognostic model in the GSE48080 sepsis dataset. (I) The ROC curve for the GSE95233 sepsis dataset. (J) The ROC curve for the GSE54514 sepsis dataset. (K) The ROC curve for the E-MTAB-5274 ARDS dataset.
We also analyzed the expression of these three genes in correlation with key clinical outcomes (death outcome, SOFA score at 24 hours after admission, number of organ failures, etc.) in different datasets. We found a negative correlation between the expression of the three genes, CX3CR1, PID1 and PTGDS, and various adverse clinical outcomes (Supplementary Material: Table S2). In the GSE95233 dataset, gene expression was negatively correlated with mortality (correlation coefficients: -0.450, -0.455, -0.554, p < 0.01). In GSE185263, gene expression was also negatively correlated with SOFA score (correlation coefficients: -0.261, -0.239, -0.149, p < 0.01). In GSE63311, CX3CR1 and PTGDS expression were negatively correlated with organ failure counts (correlation coefficients: -0.476, -0.324, p < 0.01), while PID1 was not significant (p > 0.05). In addition, we found that the expression of the three genes was also correlated with sepsis survival, SOFA score, clinical diagnosis of sepsis, and number of organ failures, and that their expression levels tended to decrease with worsening prognosis, further supporting their value as potential biomarkers(Supplementary Figures S2A–F).
3.8 Investigating the infiltration of immune cells and its relationship to common hub genesThe preliminary enrichment study indicated a connection between the core genes CX3CR1, PID1, and PTGDS and processes related to inflammation and immunity. As a result, a comprehensive examination of immune cell information in different groups was carried out using CIBERSORT. In instances of sepsis, there was an elevated count of monocytes, macrophages, memory B cells, and neutrophils, whereas the healthy control group exhibited a higher number of CD8 T cells, naive CD4 T cells, and resting NK cells (Figures 6A, B). The correlation study revealed positive associations between activated CD4 memory T cells and resting NK cells, along with connections between CD8 T cells and activated NK cells. Conversely, a negative correlation was observed between monocytes and resting neutrophils (Figure 6C).
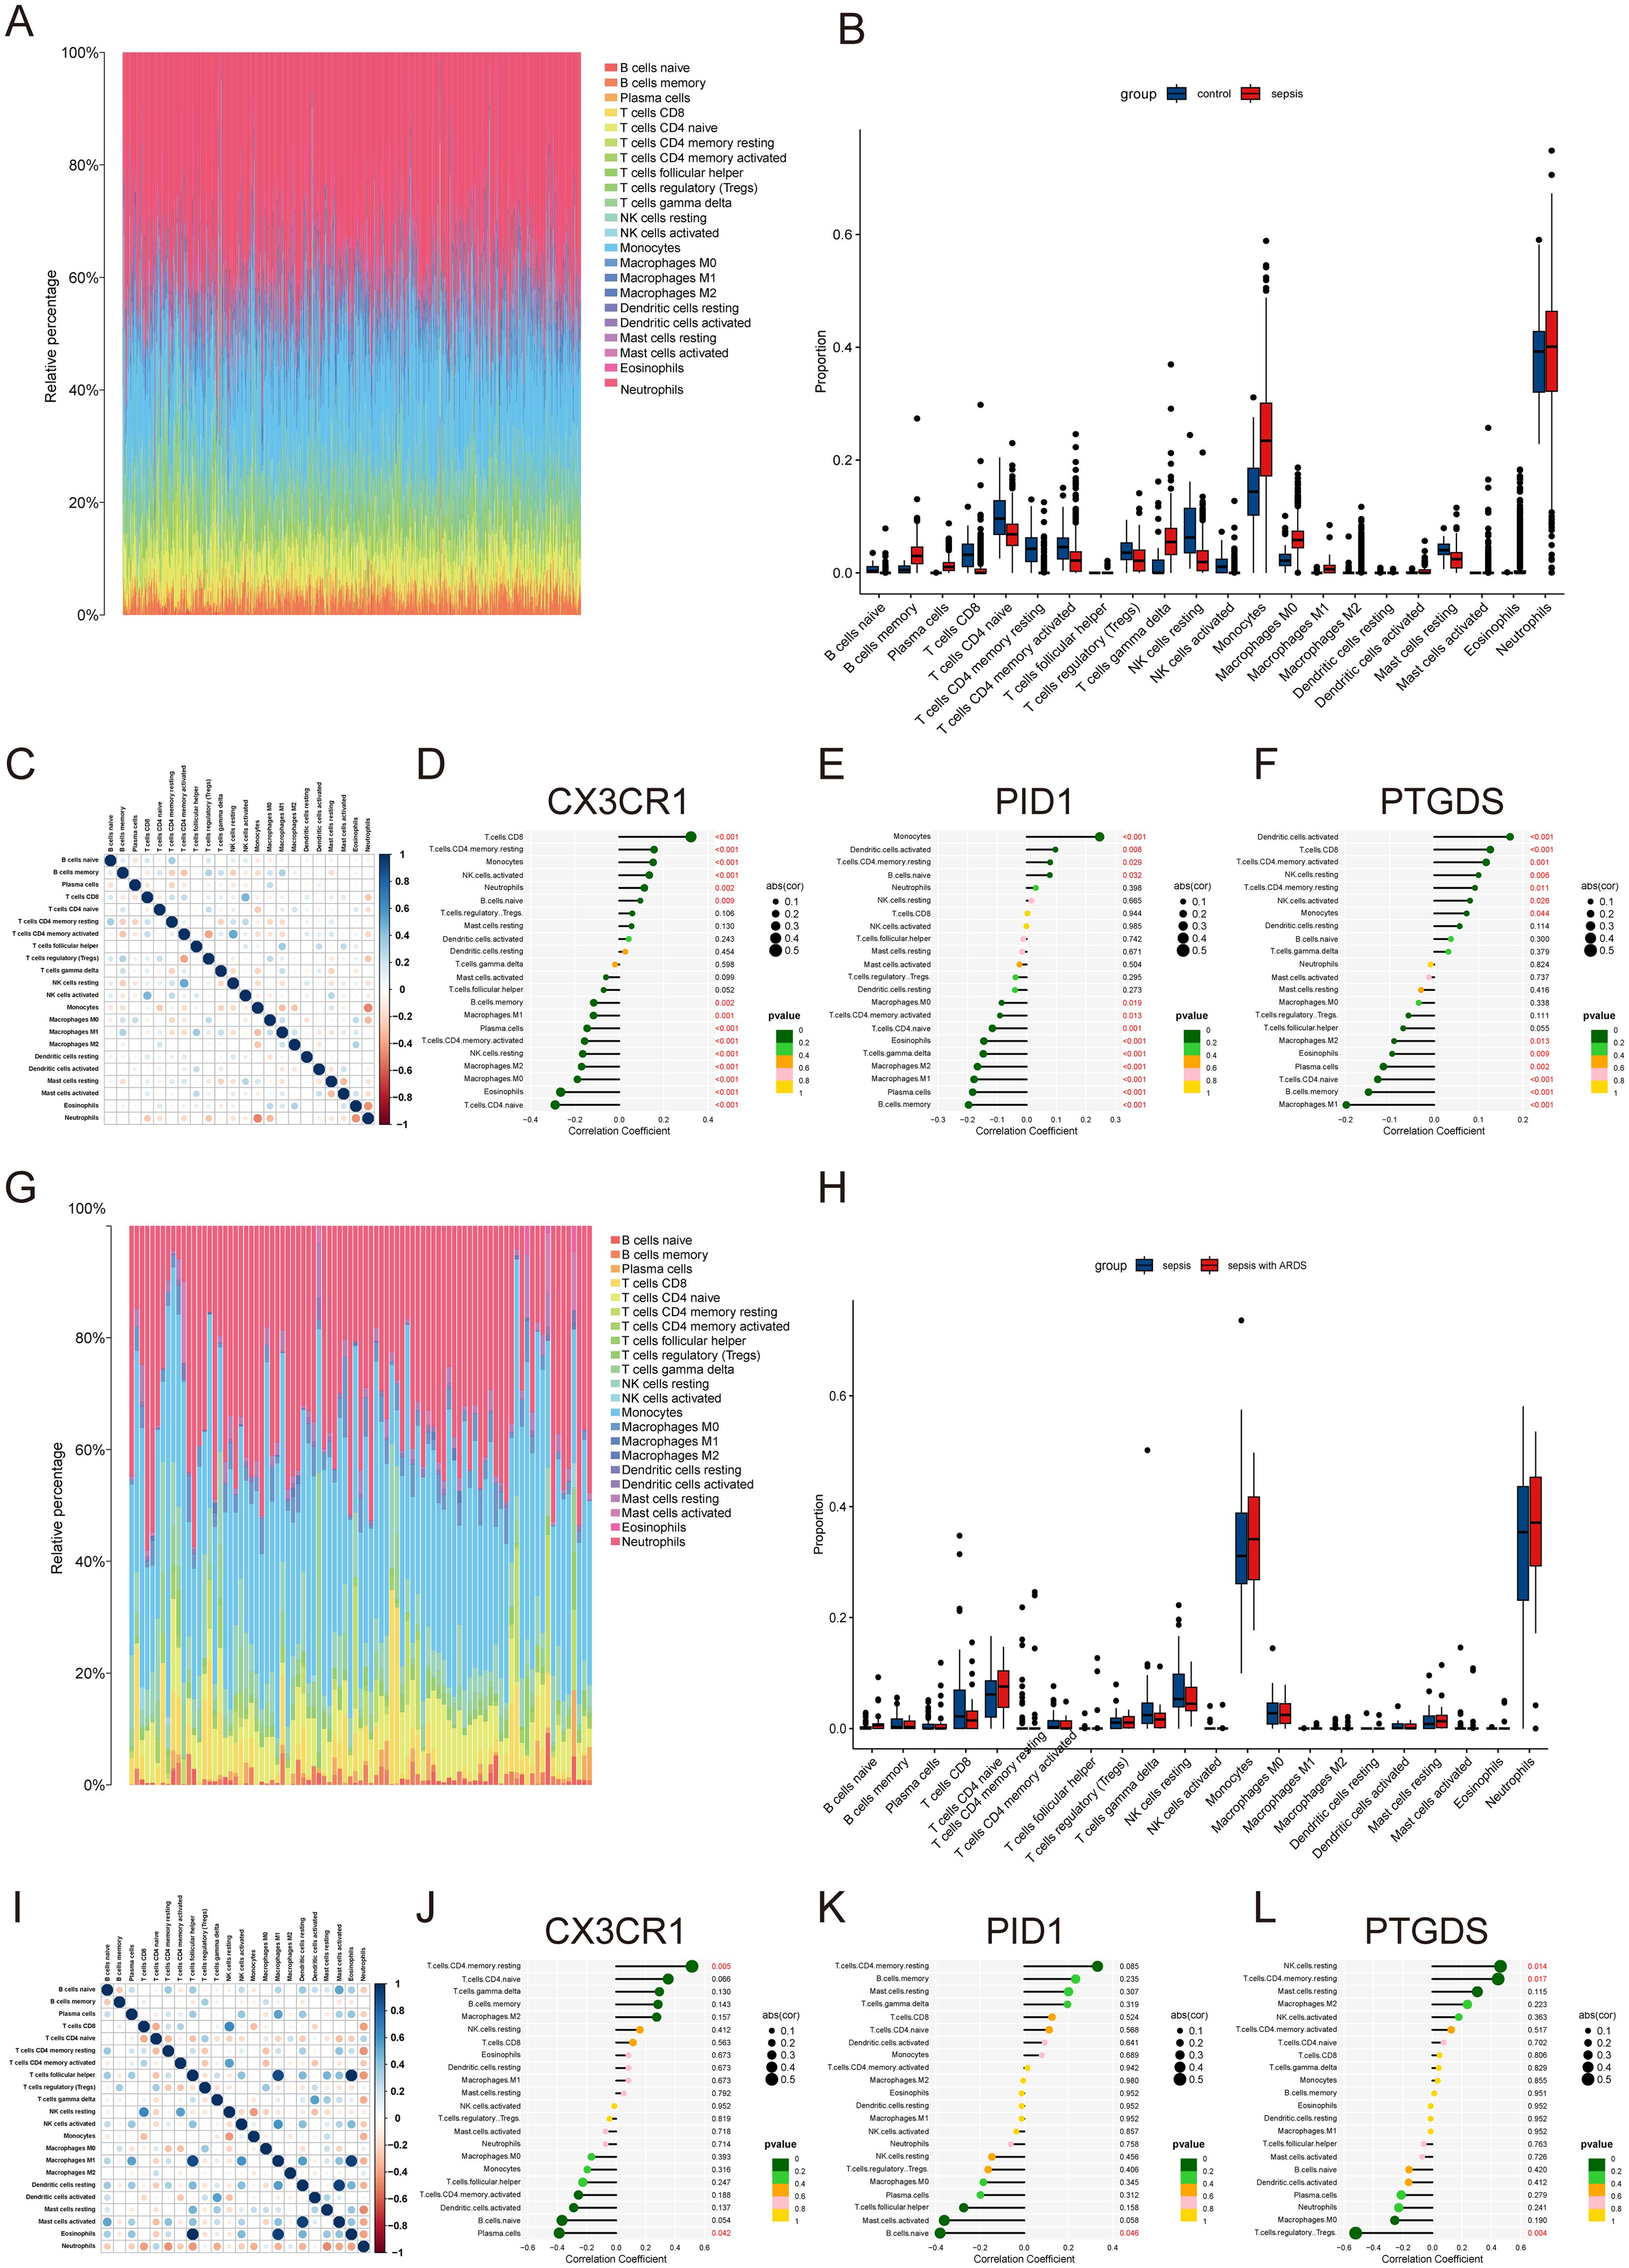
Figure 6. Immune infiltration landscape in sepsis and ARDS. (A) Proportional graph of 22 immune cells in GSE65682. (B) The proportion of 22 kinds of immune cells in different samples visualized from the barplot. (C) Correlation of 22 immune cells by compositions. Both horizontal and vertical axes demonstrate immune cell subtypes. (D–F) Correlation of CX3CR1, PID1 and PTGDS with infiltrating immune cells in sepsis group. (G) Proportional graph of 22 immune cells in GSE32707. (H) Barplot indicating the comparison of 22 types of immune cells between the sepsis and sepsis with ARDS groups. (I) Heatmap of correlations among 22 immune cells. (J–L) The association between CX3CR1, PID1 and PTGDS expression with different immune cell infiltration in the ARDS group.
Further investigation revealed correlations across the hub genes to specific immune cell categories. CX3CR1 was found to have a positive association with activated CD8 T cells and a negative one with naive CD4 T cells (Figure 6D). PID1 showed a positive relationship with monocytes and a negative one with memory B cells (Figure 6E). PTGDS exhibited positive correlations with activated dendritic cells and negative correlations with M1 macrophages (Figure 6F). In ARDS, we analyzed 22 types of immune cells in datasets of sepsis and sepsis with ARDS (Figures 6G, H). Patients suffering from ARDS and sepsis had elevated levels of monocytes, neutrophils, and naive CD4 T cells, while those with only sepsis had higher counts of CD8+ T cells and resting NK cells. Additionally, CX3CR1 and PID1 levels were positively linked to resting CD4 memory and naïve CD4 T cells, but inversely related to plasma cells and naïve B cells (Figures 6I–K). PTGDS showed a positive association with activated resting NK cells and mast cells, while it was inversely related to Tregs (Figure 6L).
3.9 The GSEA of hub genesSubsequently, we employed GSEA analysis of the three biomarkers in sepsis and ARDS datasets, respectively. We discovered notable associations between the central genes and multiple signaling pathways. For sepsis (Figures 7A–C), CX3CR1, PID1 and PTGDS are strongly associated with immune pathways such as “Allograft rejection” and “Asthma”. They are also involved in metabolic pathways like “Glycosphingolipid biosynthesis,” “Nitrogen metabolism,” and “Type I diabetes mellitus”. Interestingly, CX3CR1 and PTGDS are involved in “Fatty acid biosynthesis”, whereas PID1 specifically affects “Glycine, serine and threonine metabolism” and “Nicotinate and nicotinamide metabolism”. Additionally, PTGDS is specifically enriched in “Pantothenate and CoA biosynthesis”. For ARDS (Figures 7D–F), these genes similarly highlight their involvement in immune response and metabolic pathways.
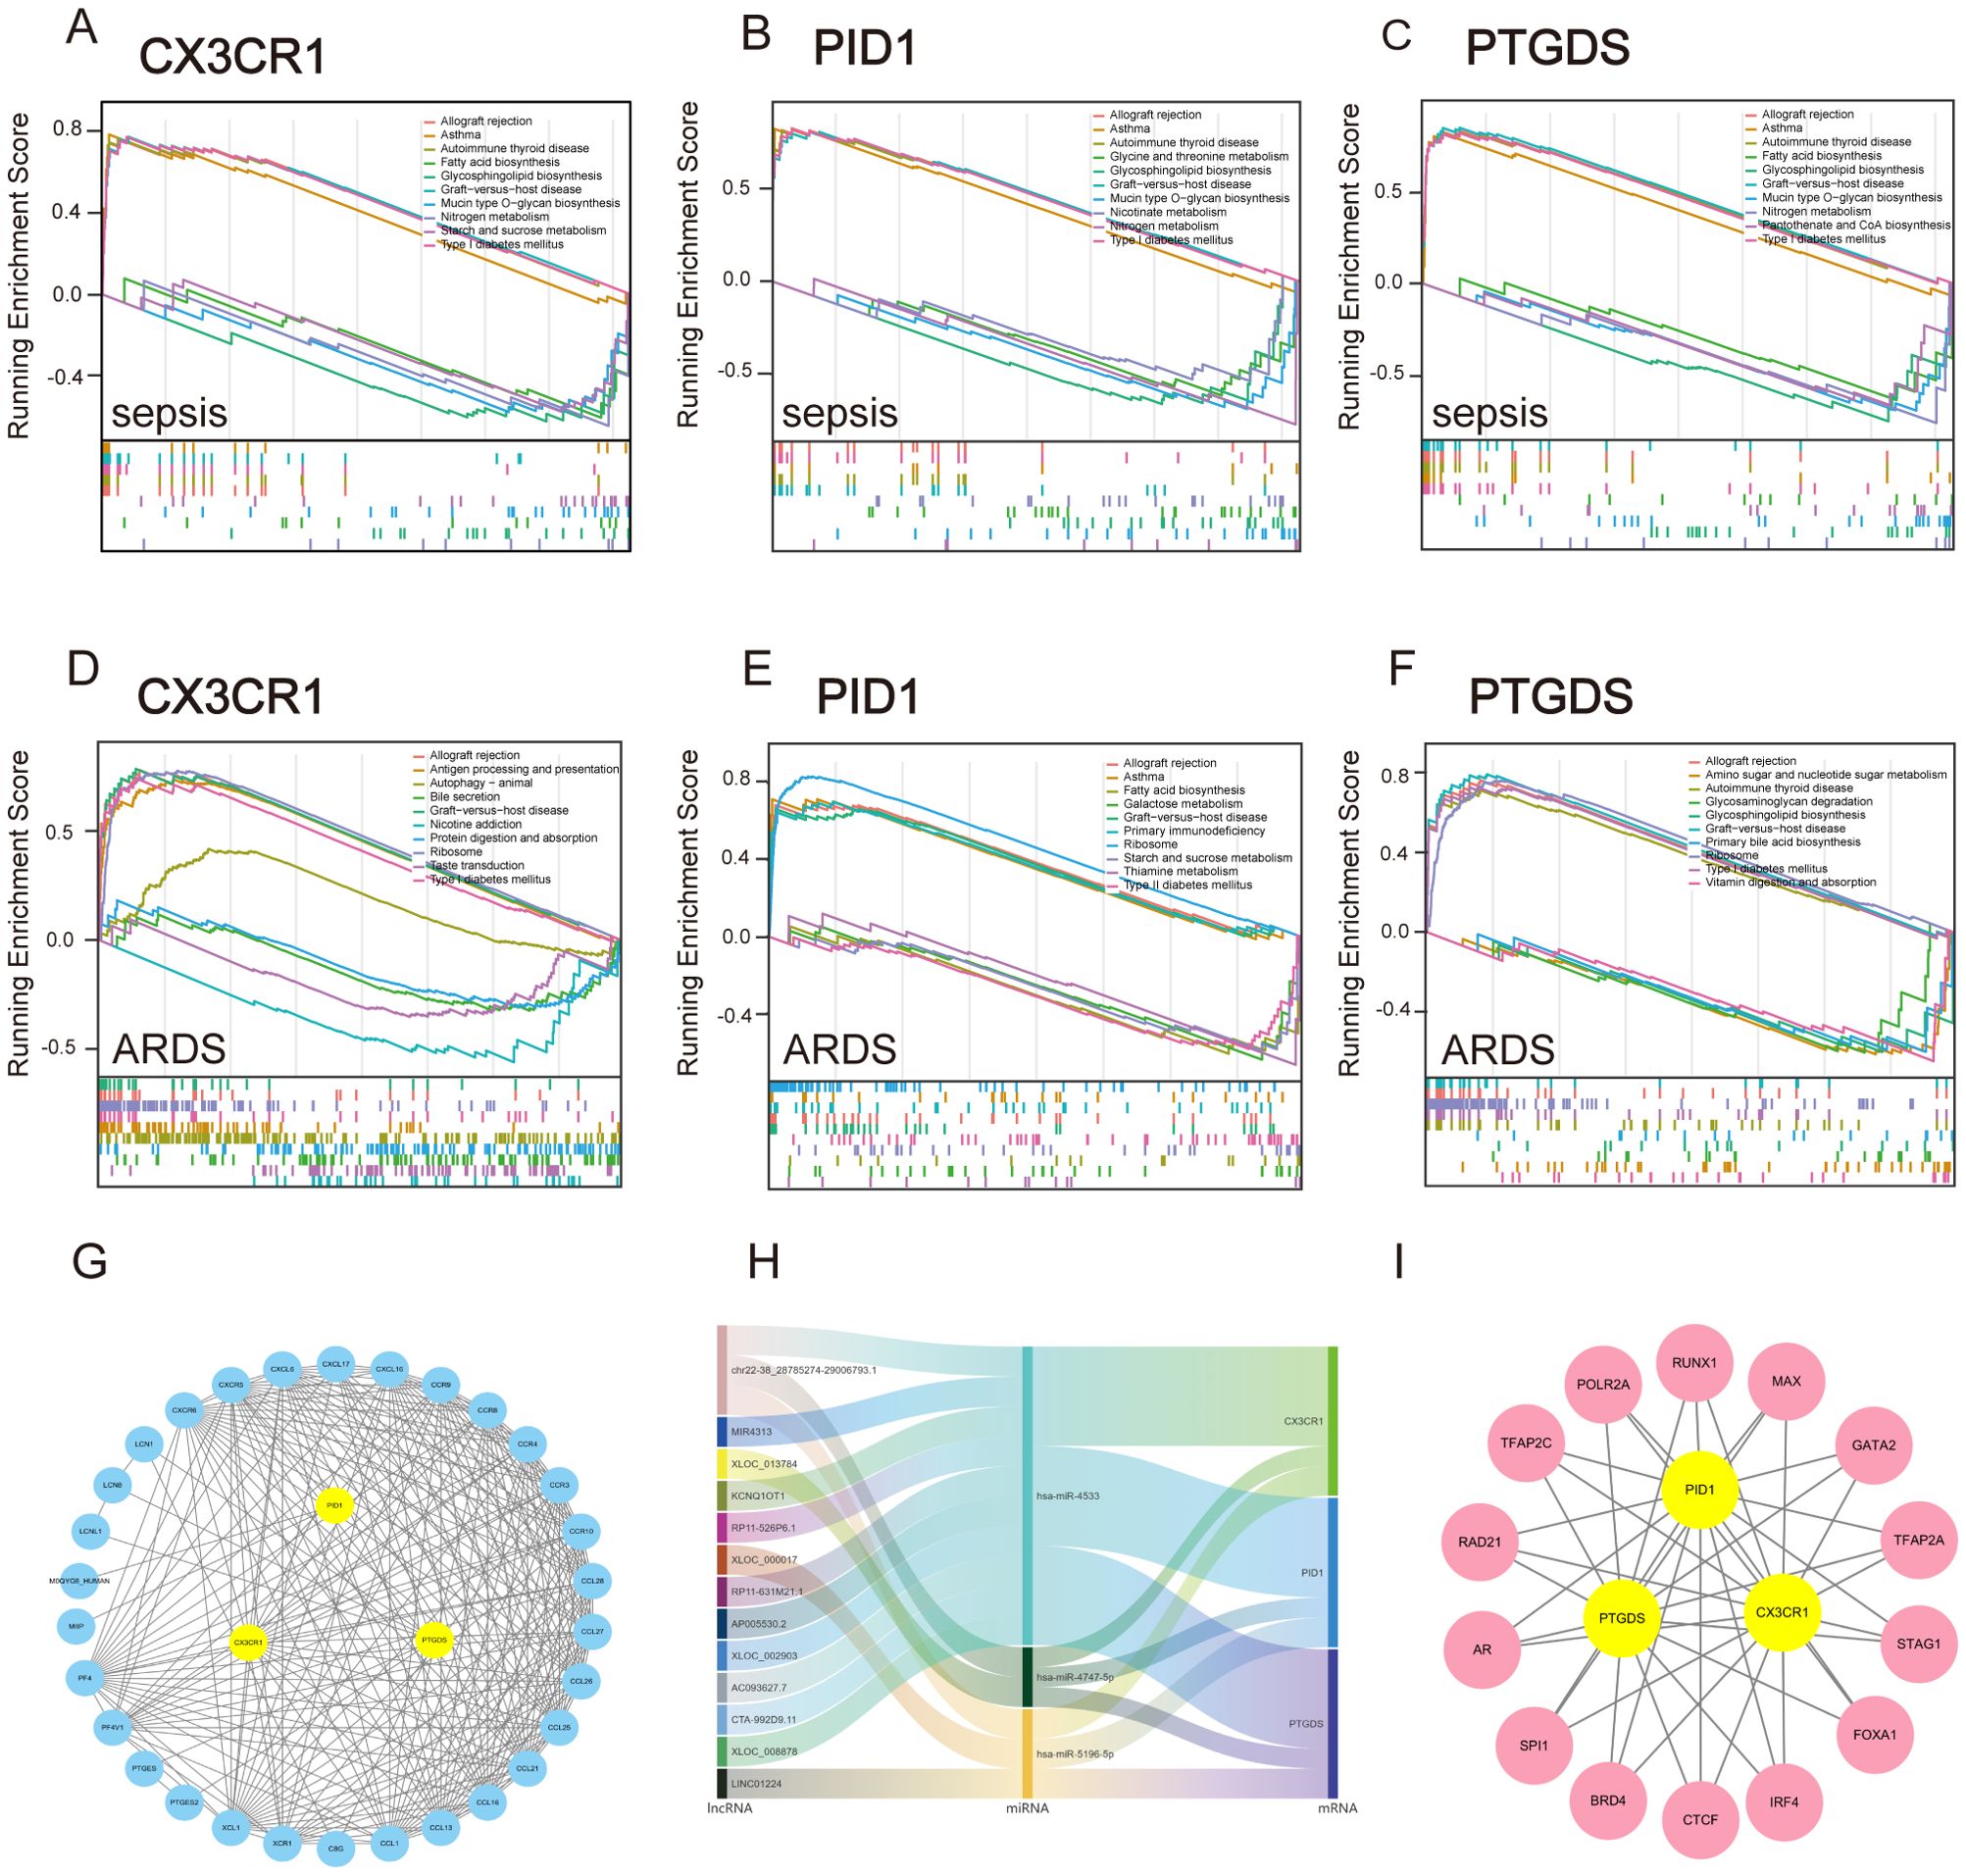
Figure 7. GSEA analysis and construction of TFs, ceRNA and PPI network based on three marker genes. (A–C) GSEA analysis for CX3CR1, PID1 and PTGDS in the sepsis group in GSE65682. (D–F) GSEA analysis for CX3CR1, PID1 and PTGDS in ARDS group in GSE32707. (G) STRING-based PPI network of three hub genes. (H) The Sankey diagram displays the lncRNA–miRNA–mRNA regulatory module, with lncRNAs on the left, miRNAs in the middle, and mRNAs on the right. (I) Network of shared TFs based on three hub genes.
These findings suggest that CX3CR1, PID1 and PTGDS are integral to both immune regulation and metabolic processes, playing multifaceted roles in conditions like sepsis and ARDS. Their participation in various immune mechanisms underscores their promise as indicators or treatment targets for diseases related to the immune system.
3.10 Analysis of transcription factors, ceRNA regulatory networks and prote
留言 (0)