Lung cancer has one of the highest incidences and mortality rates globally, with non-small cell lung cancer (NSCLC) comprising approximately 80-85% of all lung cancer cases (1). Limited progress has been achieved in the treatment of squamous lung cancer over the past few decades, and platinum-based chemotherapy continues to be the primary first-line treatment option (2). Due to significant advancements in immunotherapy, PD-1 inhibitors have gained widespread usage in patients diagnosed with squamous lung cancer. Nevertheless, the efficacy of immunotherapy for advanced NSCLC in unselected populations is merely 20%-40% (3), and a subset of patients may experience severe adverse events or expedited mortality due to tumor hyper-progression. The U.S. Food and Drug Administration has authorized the use of PD-L1 expression and tumor mutational load as clinical prognostic indicators for survival in patients undergoing treatment with immune checkpoint inhibitors (ICIs) (4, 5). However, the clinical application of these predictive biomarkers is restricted due to their high cost, complexity, and time delay in obtaining results. Furthermore, cancer immunity undergoes continuous changes during immunotherapy, and the repeated utilization of tissue biopsies for longitudinal immunoassays is not clinically viable, particularly in cases of rapid clinical deterioration. Blood-based immune biomarkers can overcome these limitations associated with tissue-based immunomarkers in tumor immunotherapy, since peripheral blood sampling is readily accessible, minimally invasive, and reproducible.
In recent years, blood cell counts (6), peripheral blood inflammation indicators (7, 8), and tumor markers (such as CEA, NSE, CA129, and SCC) (9, 10) have gained widespread utilization in predicting the prognosis of chemotherapy or targeted therapy in NSCLC. Apart from PD-L1, the investigation of inflammatory biomarkers, including the neutrophil/lymphocyte ratio (NLR) and lactate dehydrogenase (LDH), is still at an early stage (11). The objective of this study was to retrospectively evaluate the correlation between dynamic changes in peripheral blood and prognosis among patients diagnosed with squamous lung cancer who underwent immunotherapy. Moreover, pertinent clinical prediction models were developed to provide guidance for the implementation of immunotherapy in clinical settings.
2 Materials and methods2.1 Research designWe conducted a retrospective study of patients diagnosed with inoperable locally advanced or advanced squamous cell lung cancer who were treated with PD-1 inhibitors between January 2018 and July 2023 at the Harbin Medical University Cancer Hospital. All patients and clinical information were analyzed according to the Declaration of Helsinki and its amendments. The following inclusion criteria were applied:(1) Patients were administered intravenously every three weeks, with a routine therapeutic dose of 200 mg (240 mg for Teraplizumab) of PD-1 inhibitors. (2) In combination with/without combination of chemotherapeutic or antiangiogenic agents, with chemotherapeutic agents mainly being albumin paclitaxel, gemcitabine, docetaxel, cis/carboplatin, and antiangiogenic drugs mainly bevacizumab, erlotinib, and endo;(3) Efficacy assessment every two cycles. The following patients were excluded: (I) unclear pathology or inability to obtain pathological tissues; (II) patients with LUSC amenable to surgical treatment; (III) imperfect imaging data (CT, MRI, ultrasound and PET/CT), missing data; (IV) accompanied by severe comorbidities (acute cerebral infarction, acute hepatic and renal failure, severe coronary artery disease, cardiac arrhythmia and so on); and (V) concomitant with other malignant tumors. Because this was a retrospective study, informed consent was waived by the Harbin Medical University Cancer Hospital Ethics Committee.
Baseline covariates encompassed patients’ age, gender, smoking history, Eastern Cooperative Oncology Group performance status assessment (ECOG score), clinical stage, history of radiotherapy, history of surgery, PD-L1 expression, treatment modality (monotherapy, chemotherapy combined with immunotherapy, anti-angiogenesis + immunotherapy, chemotherapy + immunotherapy + anti-angiogenesis), number of lines of immunotherapy (1, ≥2), presence of distant metastases (liver, bone, brain), adverse reactions to immunotherapy, time to disease progression, and short-term efficacy assessment. Furthermore, peripheral blood markers such as SCC, CEA, NSE, Hb, LDH, WBC, and RBC were regularly assessed at weeks 0, 6, and 12 during the course of immunotherapy.
2.2 Research endpointsThe primary endpoints were the objective response rate (ORR) and the disease control rate (DCR), while survival outcomes were assessed using progression-free survival (PFS) and overall survival (OS). ORR was defined as the proportion of patients achieving CR (CR) or partial remission (PR), while DCR was defined as the proportion of patients achieving CR, PR, or stable disease (SD). Additionally, ORR and DCR were evaluated based on RECIST 1.1 criteria. For patients without evidence of disease progression, PFS was censored at the time of the last follow-up. OS was defined as the time from diagnosis to either death or the last follow-up.
2.3 Statistical analysisStatistical analysis was performed using SPSS 27.0 and R4.3.2 software, and graphs were plotted using GraphPad Prism 10.0. A two-sided P < 0.05 was considered statistically different. The Kolmogorov-Smirnov test was used to determine whether continuous variables conformed to a normal distribution. For continuous variables that conformed to normal distribution, the mean ± standard deviation (x ± s) was used. For continuous variables that did not conform to normal distribution, median and interquartile range (IQR) were used. Categorical variables were expressed using the number of cases and percentage (n, %). In order to study the influence of peripheral blood on prognosis, we divided the indexes of peripheral blood into two parts according to the critical value of ROC curve. For survival outcomes, we calculated the relationship between peripheral blood indices of optimal treatment response by multifactorial logistic regression. We used the Kaplan-Meier method to generate PFS and OS survival curves and Log-rank tests for survival outcomes in patients with each factor. Relative risk was assessed by risk ratios and 95% confidence intervals. In addition, we constructed Cox risk-proportional models to analyze independent prognostic factors. Factors with P < 0.05 in the univariate Cox regression analysis were further included in the multivariate analysis to identify factors independently associated with survival. Finally, we tested the proportional risk hypothesis by the Schenfeld residual method for indicators that were significant in the multivariate analyses and created column-line plots to predict the probability of patient survival. In addition, the accuracy of the column-line plots was predicted by plotting calibration curves.
3 Results3.1 Patient characteristicsThis study included a total of 212 patients diagnosed with advanced squamous lung cancer. Supplementary Table 1 presents the baseline characteristics of the patients. The patients had a median age of 61.33 years, with approximately 85.8% being male. Among the patients, 63.7% were smokers, and the majority (94.4%) had ECOG scores ranging from 0 to 1, while only 5.6% had scores ≥2. Among the 212 patients with squamous lung cancer, all patients received PD-1 inhibitor-based therapy. Among them, 170 patients received first-line immunization therapy, and 19.8% received immunization therapy after multiple lines of treatment. The most commonly used PD-1 inhibitor, Tislelizumab, accounted for approximately 56.6% of the patients, while the remaining patients were treated with Pembrolizumab (18.9%) and Sintilimab (17%). Additionally, PD-L1 expression was evaluated in only 81 patients. Among them, 4.2% tested negative for PD-L1, 34% had received radiotherapy.
3.2 Hematologic parametersThe median levels of SCC, CEA, Hb, LDH, NSE, RBC, and WBC at 0, 6, and 12 weeks were as follows: 1.50 ng/mL, 1.00 ng/mL, 1.10 ng/mL, 3.17 ng/mL, 3.18 ng/mL, 3.14 ng/mL, 137.00 g/L, 128.50 g/L, 125.00 g/L, 188.50 U/L, 188.00 U/L, 189.50 U/L, 14.88 ng/mL, 13.36 ng/mL, 12.70 ng/mL, 7.36×10⁹/L, 6.48×10⁹/L, 6.16×10⁹/L, 4.58×10¹²/L, 4.28×10¹²/L, 4.01×10¹²/L. Detailed information is shown in Supplementary Table 1.
3.3 Optimal cut-off valuesThe optimal cutoffs for SCC, CEA, NSE, Hb, LDH, WBC, and RBC at 0, 6, and 12 weeks were obtained by using the maximum dominance index [sensitivity - (1 - specificity)] calculated from the subjects’ work characteristic curves. In addition, area under the curve analysis was performed and found that SCC12w had the highest area under the curve among the peripheral blood indices. The details are shown in the Supplementary Table 2 and Supplementary Figure 1.
3.4 Multivariate logistic regression analysis of DCR and ORRTo predict the correlation between peripheral blood markers and response to PD-1 inhibitor therapy, we used multivariate logistic regression, calculated as
logit(p)=ln(p1−p)=β0+β1x1+β2x2+⋯+βnxnWe found that RBC12w<3.81×10 12/L (HR = 0.405, 95% CI: 0.155-0.971, p = 0.034) was associated with a lower ORR and WBC6w<9.34× 10 9/L (HR = 2.510, 95% CI: 1.997-6.322, p = 0.041) was associated with higher DCR. (Supplementary Table 3)
3.5 Univariate and multifactorial Cox analysisUnivariate analysis identified ECOG score (0-1), Treatment, Radiotherapy, SCC levels (SCC0w, SCC6w, SCC12w), NSE levels (NSE0w, NSE6w, NSE12w), LDH12w, and RBC0w at baseline and post-treatment as significant prognostic factors for both PFS and OS. Among these, ECOG score, Treatment, Radiotherapy, SCC12w, NSE6w, and RBC0w were specifically associated with PFS, while Treatment, CEA levels (CEA0w, CEA6w), NSE6w, Hb levels (Hb0w, Hb12w), and LDH levels (LDH6w, LDH12w) were associated with OS.
To address potential multicollinearity, significant factors from the univariate analysis were further screened using Lasso regression. For PFS analysis, when the optimal λ was taken to be a value of 0.0047, SCC6w and NSE12w were excluded due to multicollinearity (Figures 1A, B). Similarly, when taking the optimal λ value of 0.0056, in OS analysis, SCC0w, SCC6w, CEA6w, Hb0w, Hb12w, LDH6w, and RBC0w were excluded (Figures 1C, D).
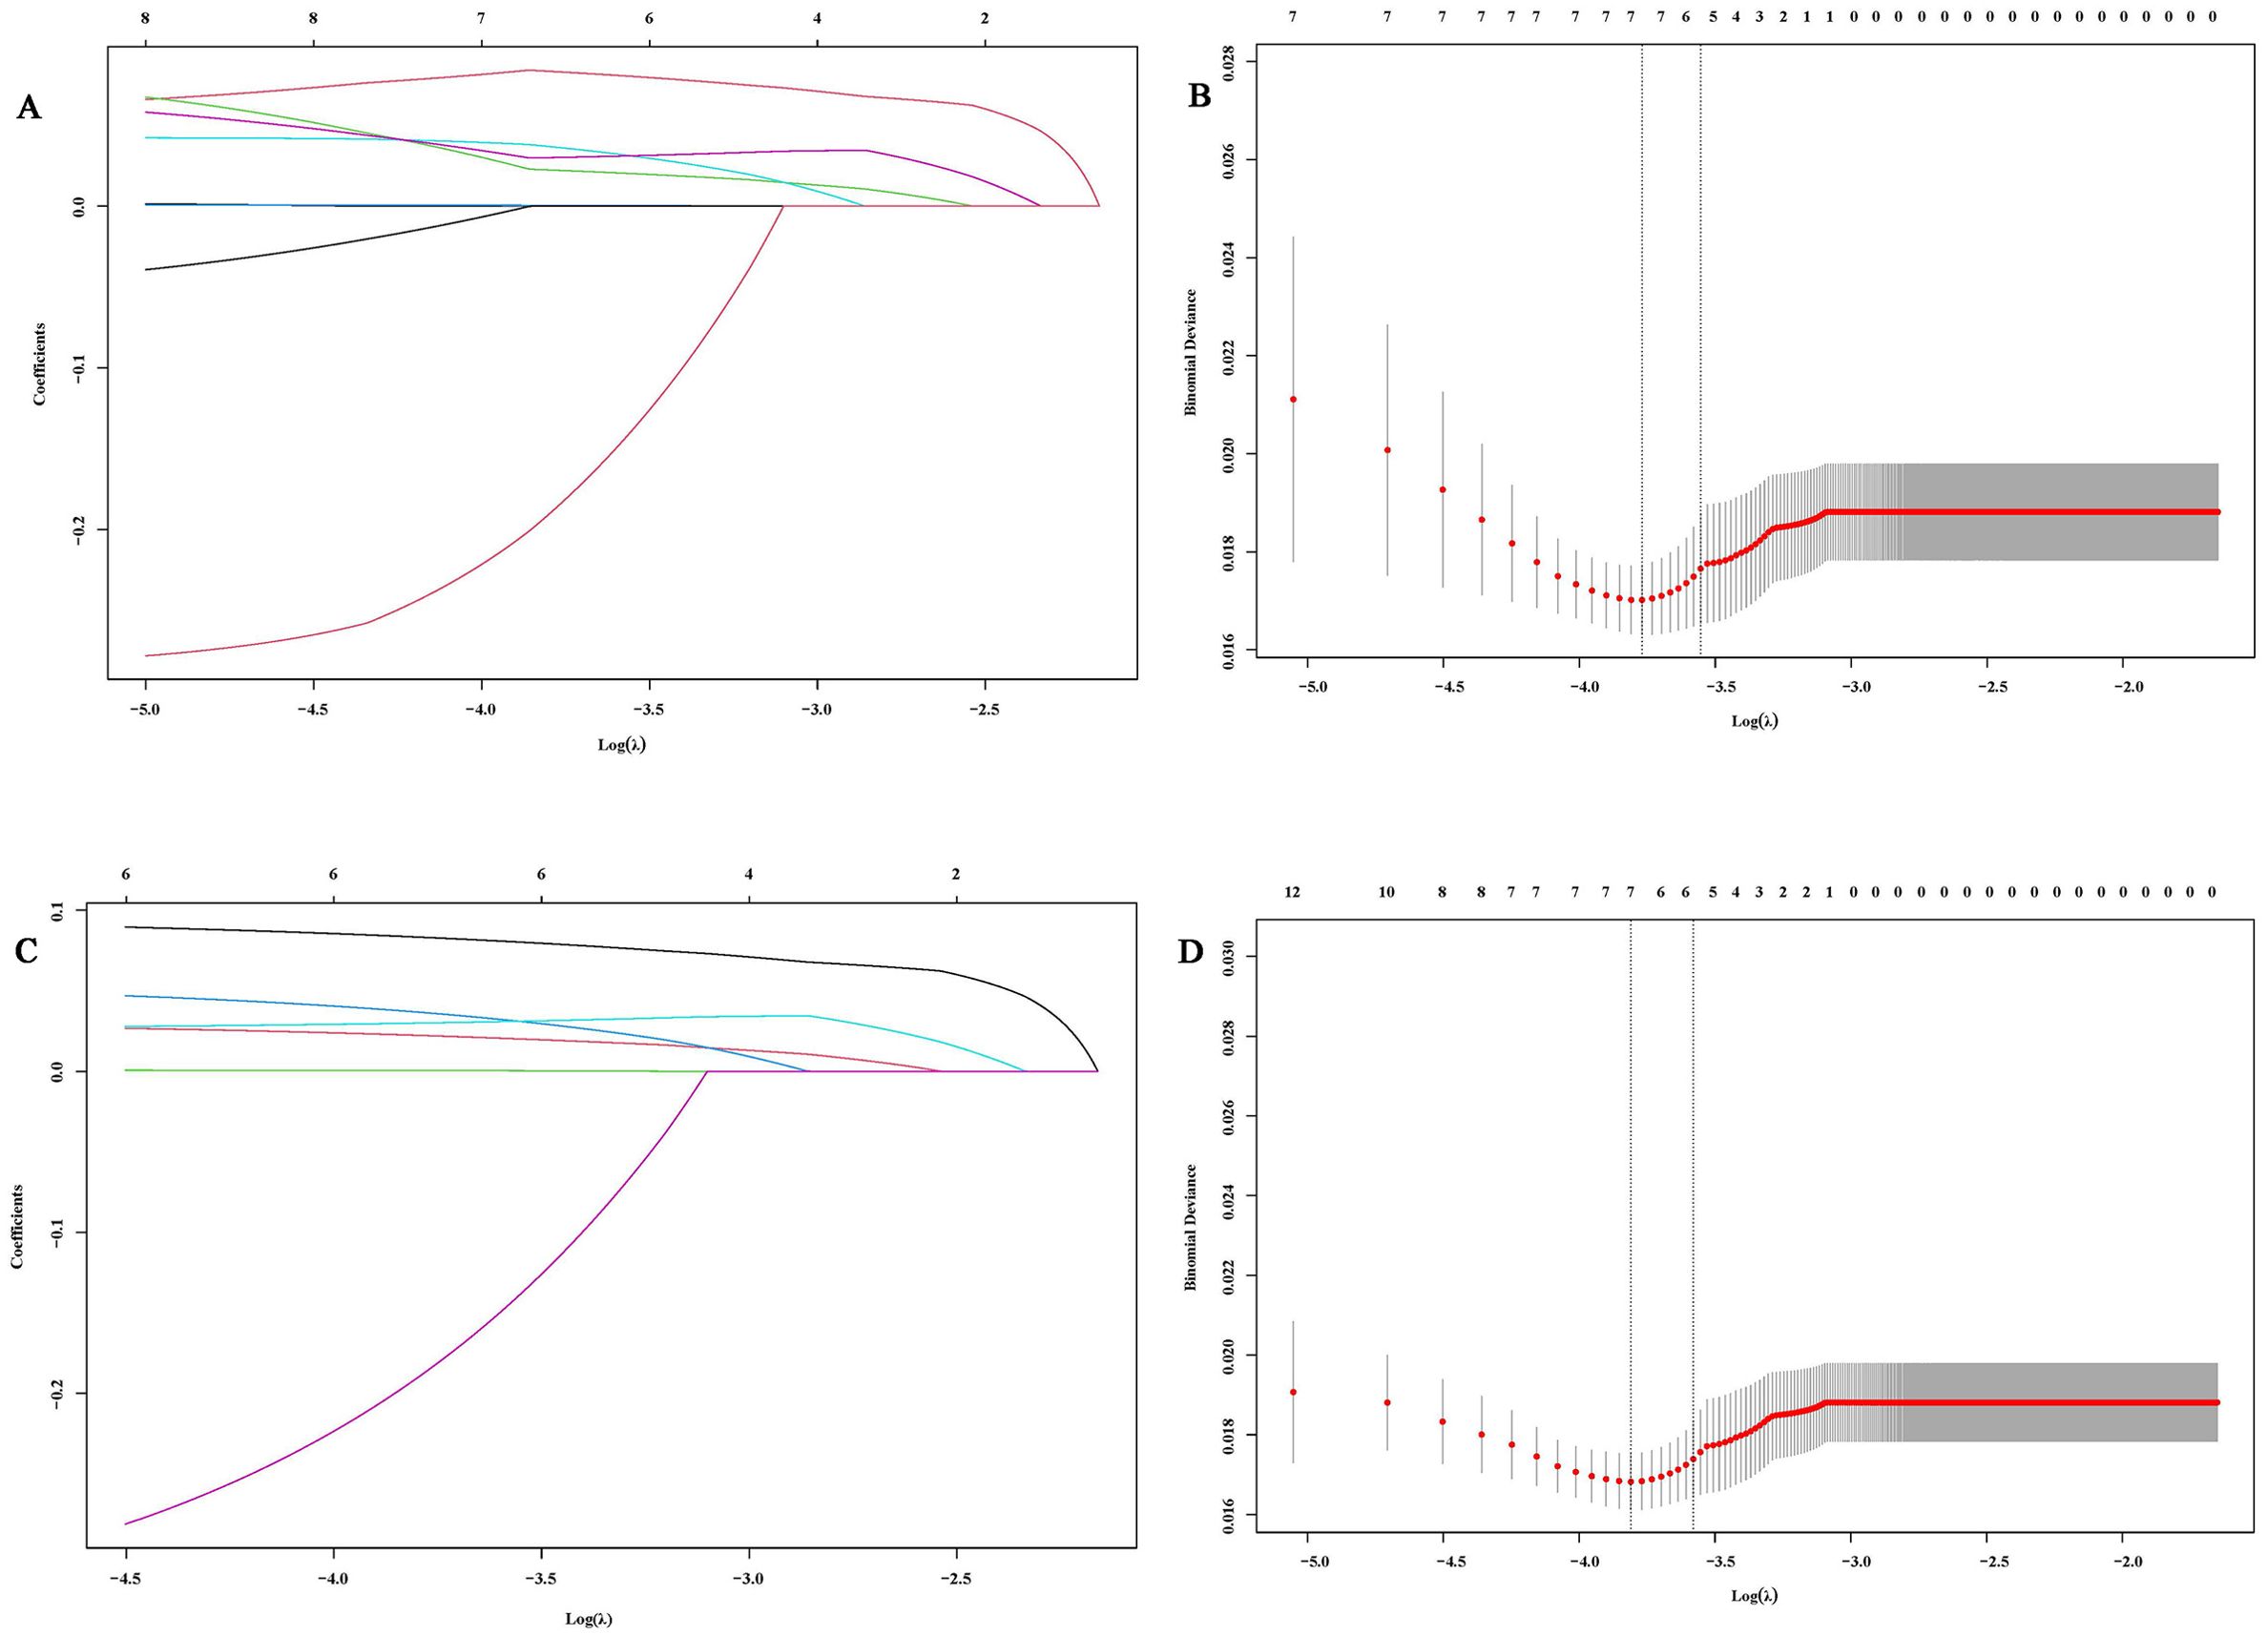
Figure 1. Variable selection based on Lasso regression. (A, C) Characteristic changes in the coefficients of variables for PFS and OS; (B, D). The process of selecting the optimal value of parameter λ in the Lasso regression model through cross-validation methods.
Multivariate analysis ultimately revealed that Treatment, SCC12w, and NSE6w were independent prognostic factors for both PFS and OS. Additionally, RBC0w was identified as an independent predictor for PFS. Detailed information is shown in Tables 1, 2.
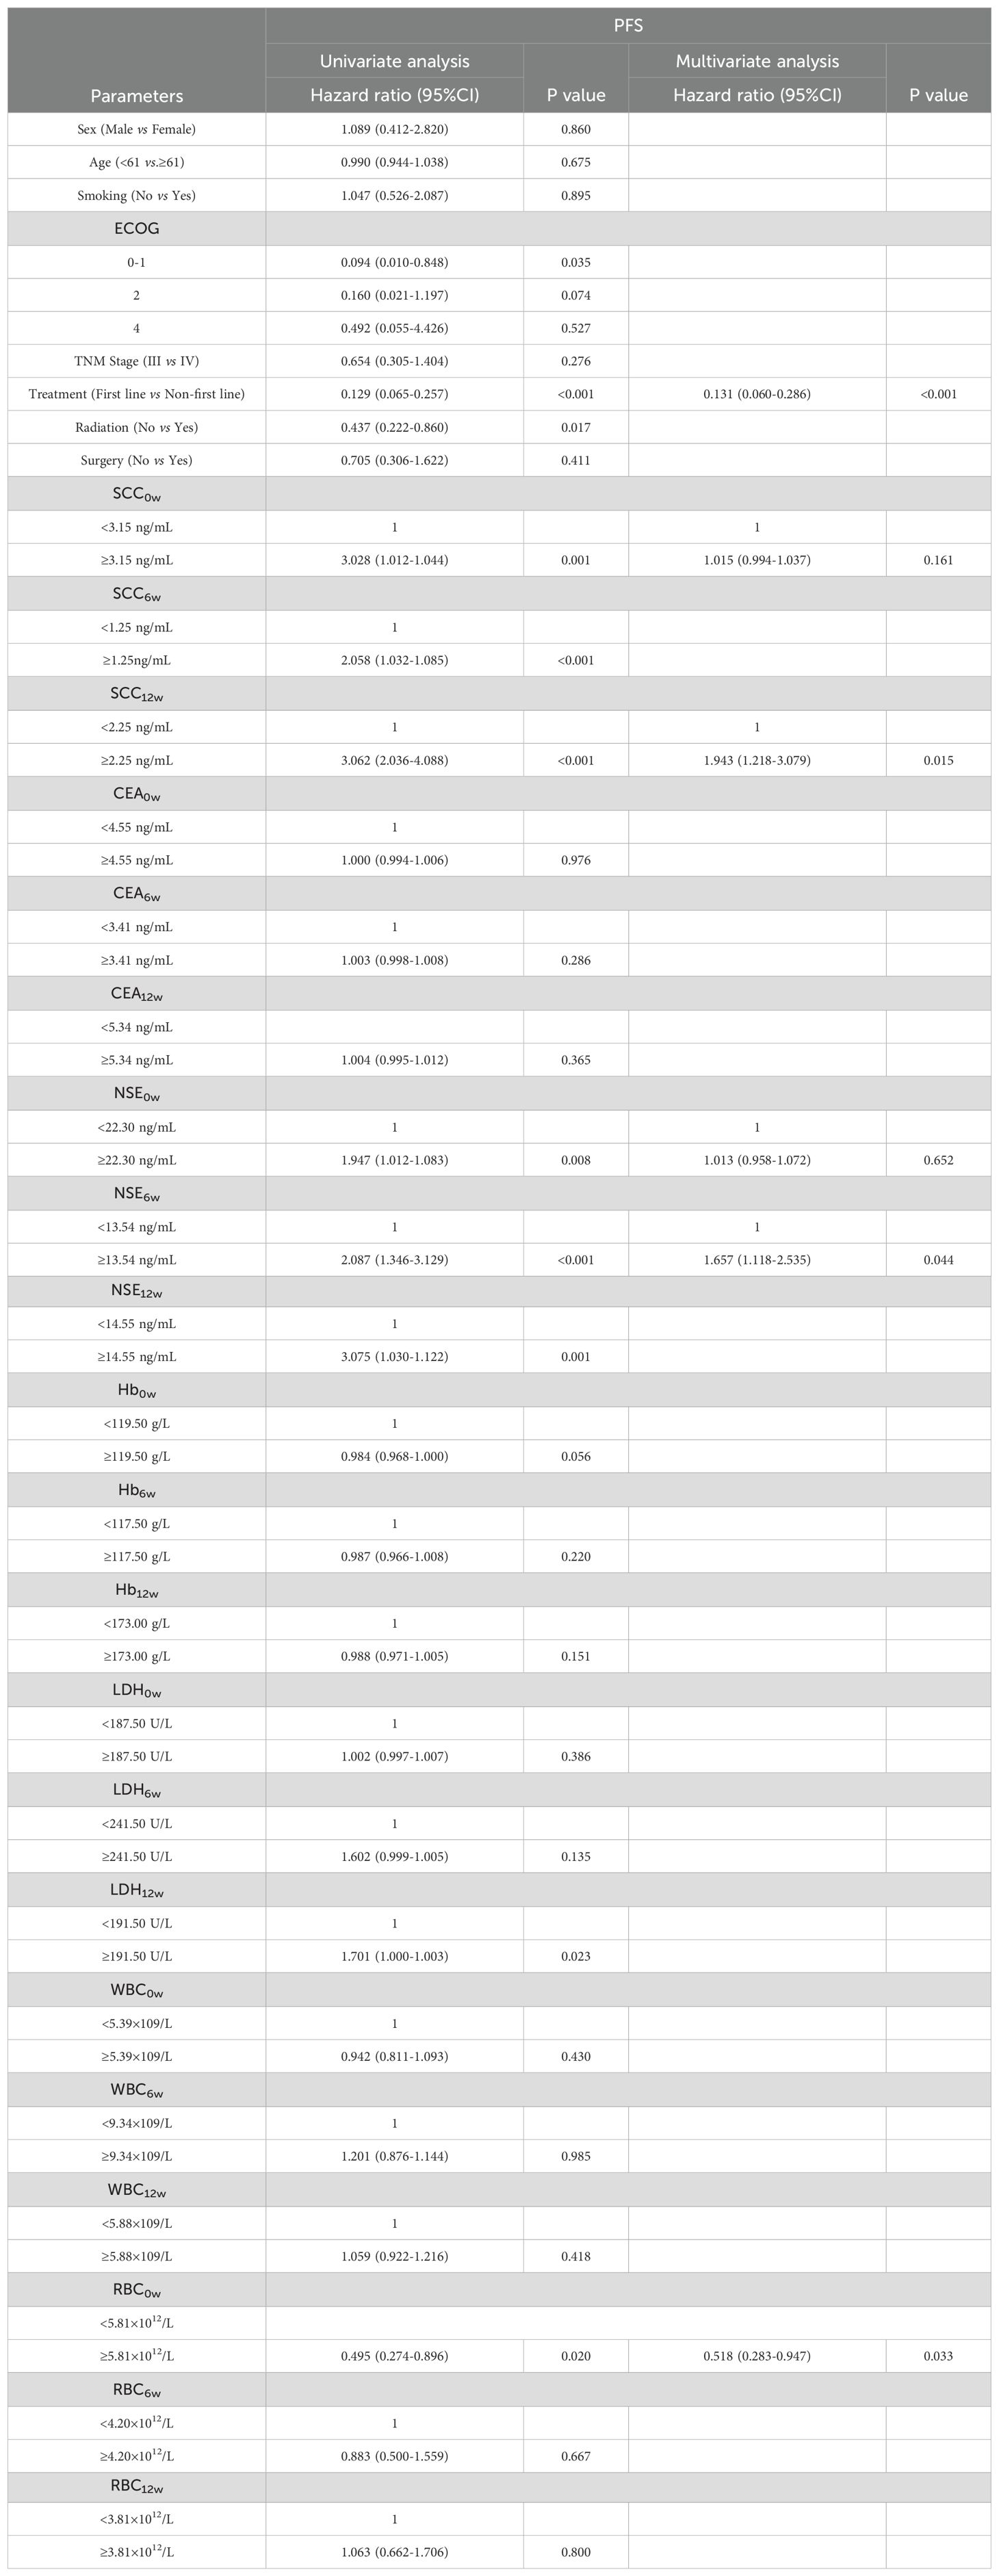
Table 1. Univariate and multivariate analyses for PFS.
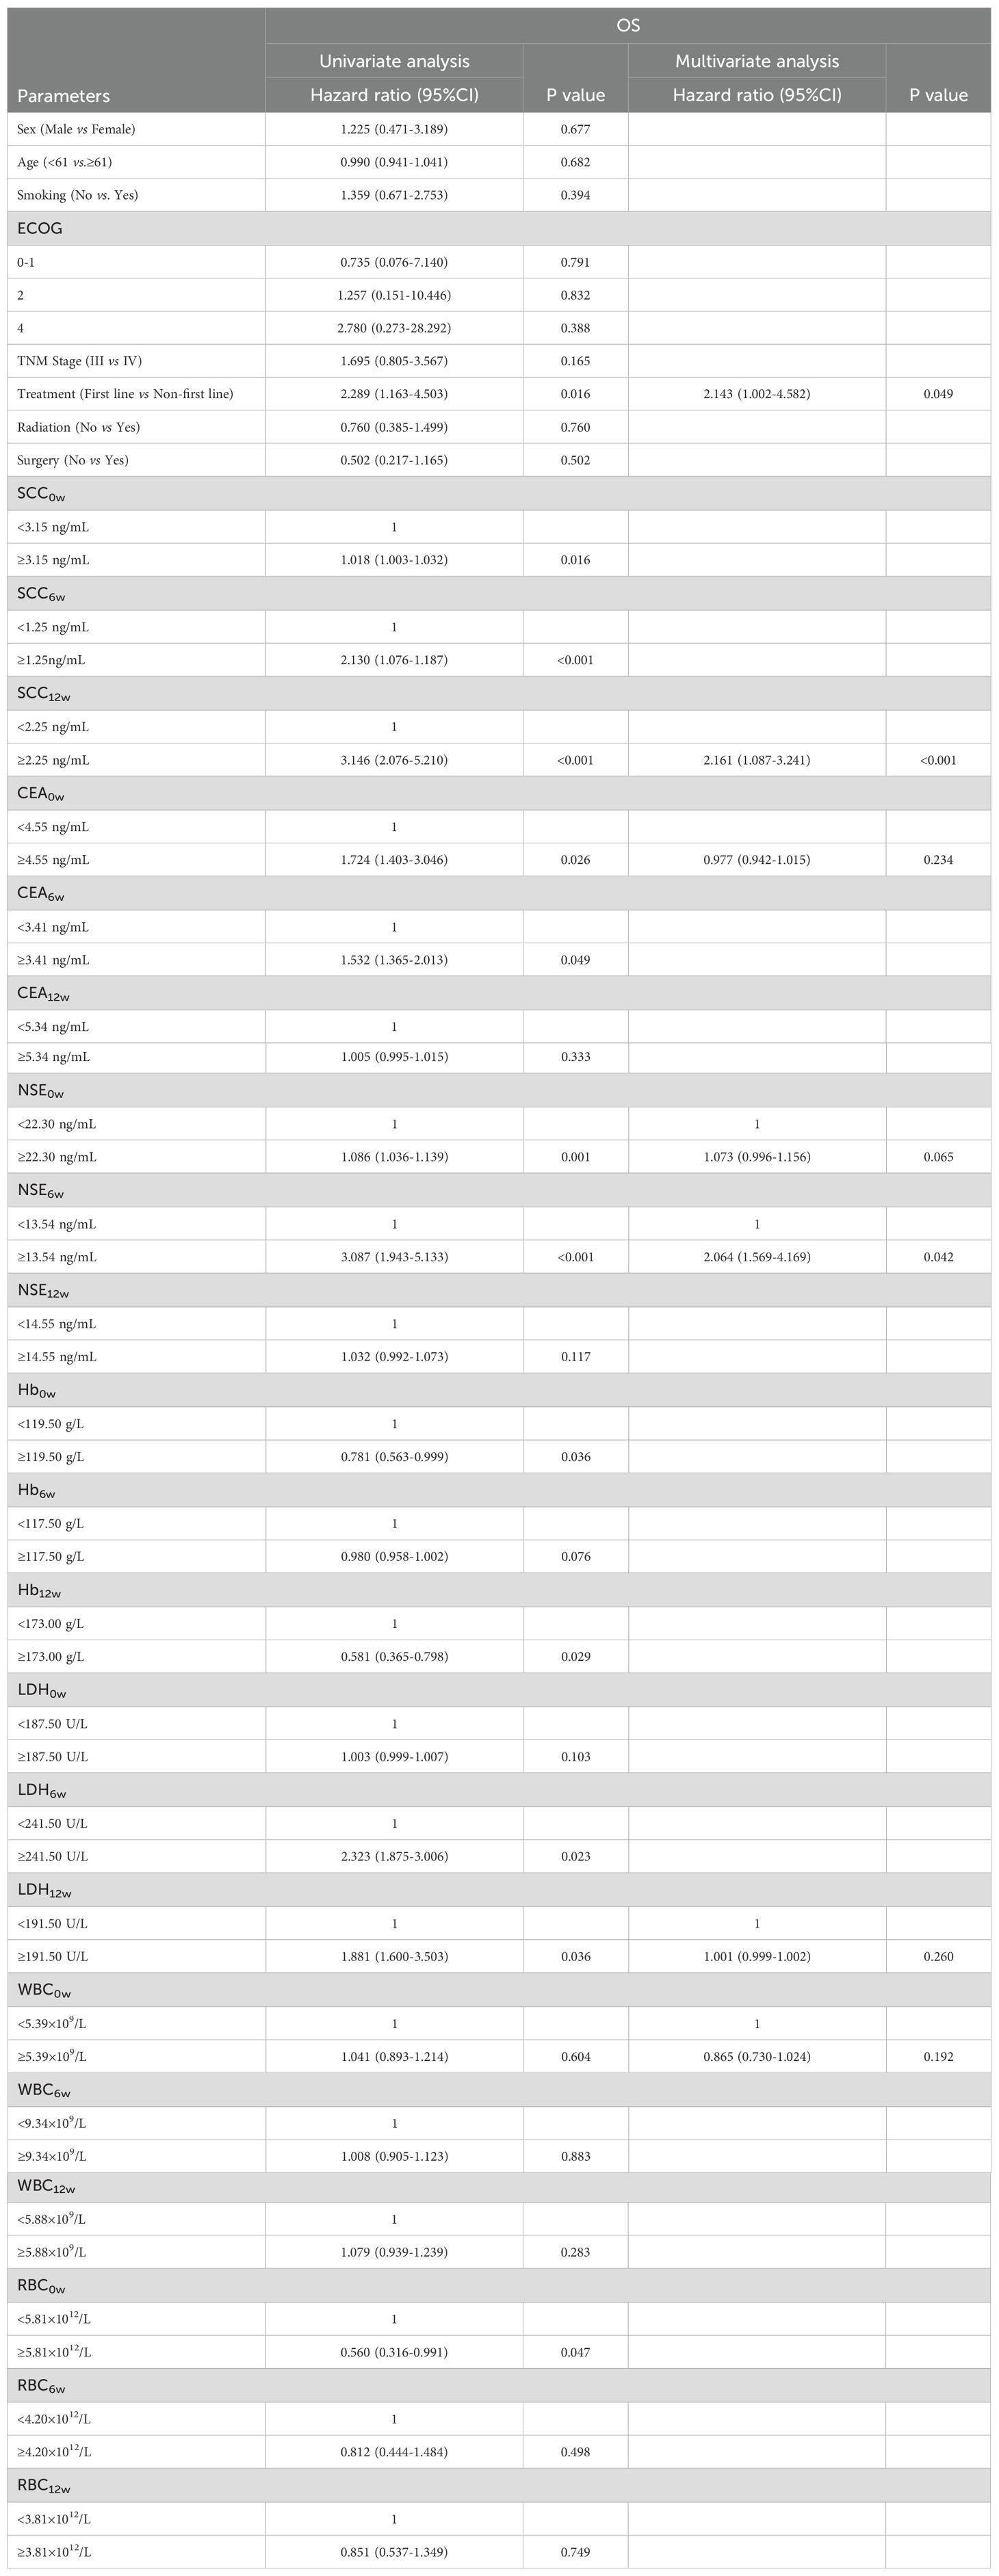
Table 2. Univariate and multivariate analyses for OS.
3.6 Survival analysis of SCC12w and NSE6wThe 1- and 3-year PFS rates in the SCC12w < 2.25 ng/mL group were 92.2% (95% CI:0.878-0.968) and 74.5% (95% CI:0.582-0.954), respectively, while the OS rates were 99.5% (95% CI:0.978-1.000) and 84.4% (95% CI:0.751-0.948). In contrast, the SCC12w ≥ 2.25 ng/mL group exhibited significantly lower 1- and 3-year PFS rates of 62.0% (95% CI:0.482-0.796) and 30.2% (95% CI:0.136-0.670), with corresponding OS rates of 97.6% (95% CI:0.931-1.000) and 60.6% (95% CI:0.444-0.828). Similarly, in the NSE6w < 13.54 ng/mL group, the 1- and 3-year PFS rates were 84.0% (95% CI:0.774-0.912) and 75.1% (95% CI:0.643-0.876), and the OS rates were 99.3% (95% CI:0.978-1.000) and 78.4% (95% CI:0.678-0.892). However, the NSE6w ≥ 13.54 ng/mL group showed 1- and 3-year PFS rates of 88.3% (95% CI:0.809-0.964) and 58.0%(95% CI:0.382-0.880), and OS rates of 98.6%(95% CI:0.959-1.000) and 80.4%(95% CI:0.764-0.943). These findings indicate that patients with SCC12w ≥ 2.25 ng/mL and NSE6w ≥ 13.54 ng/mL experienced significantly shorter PFS and OS (Figure 2).
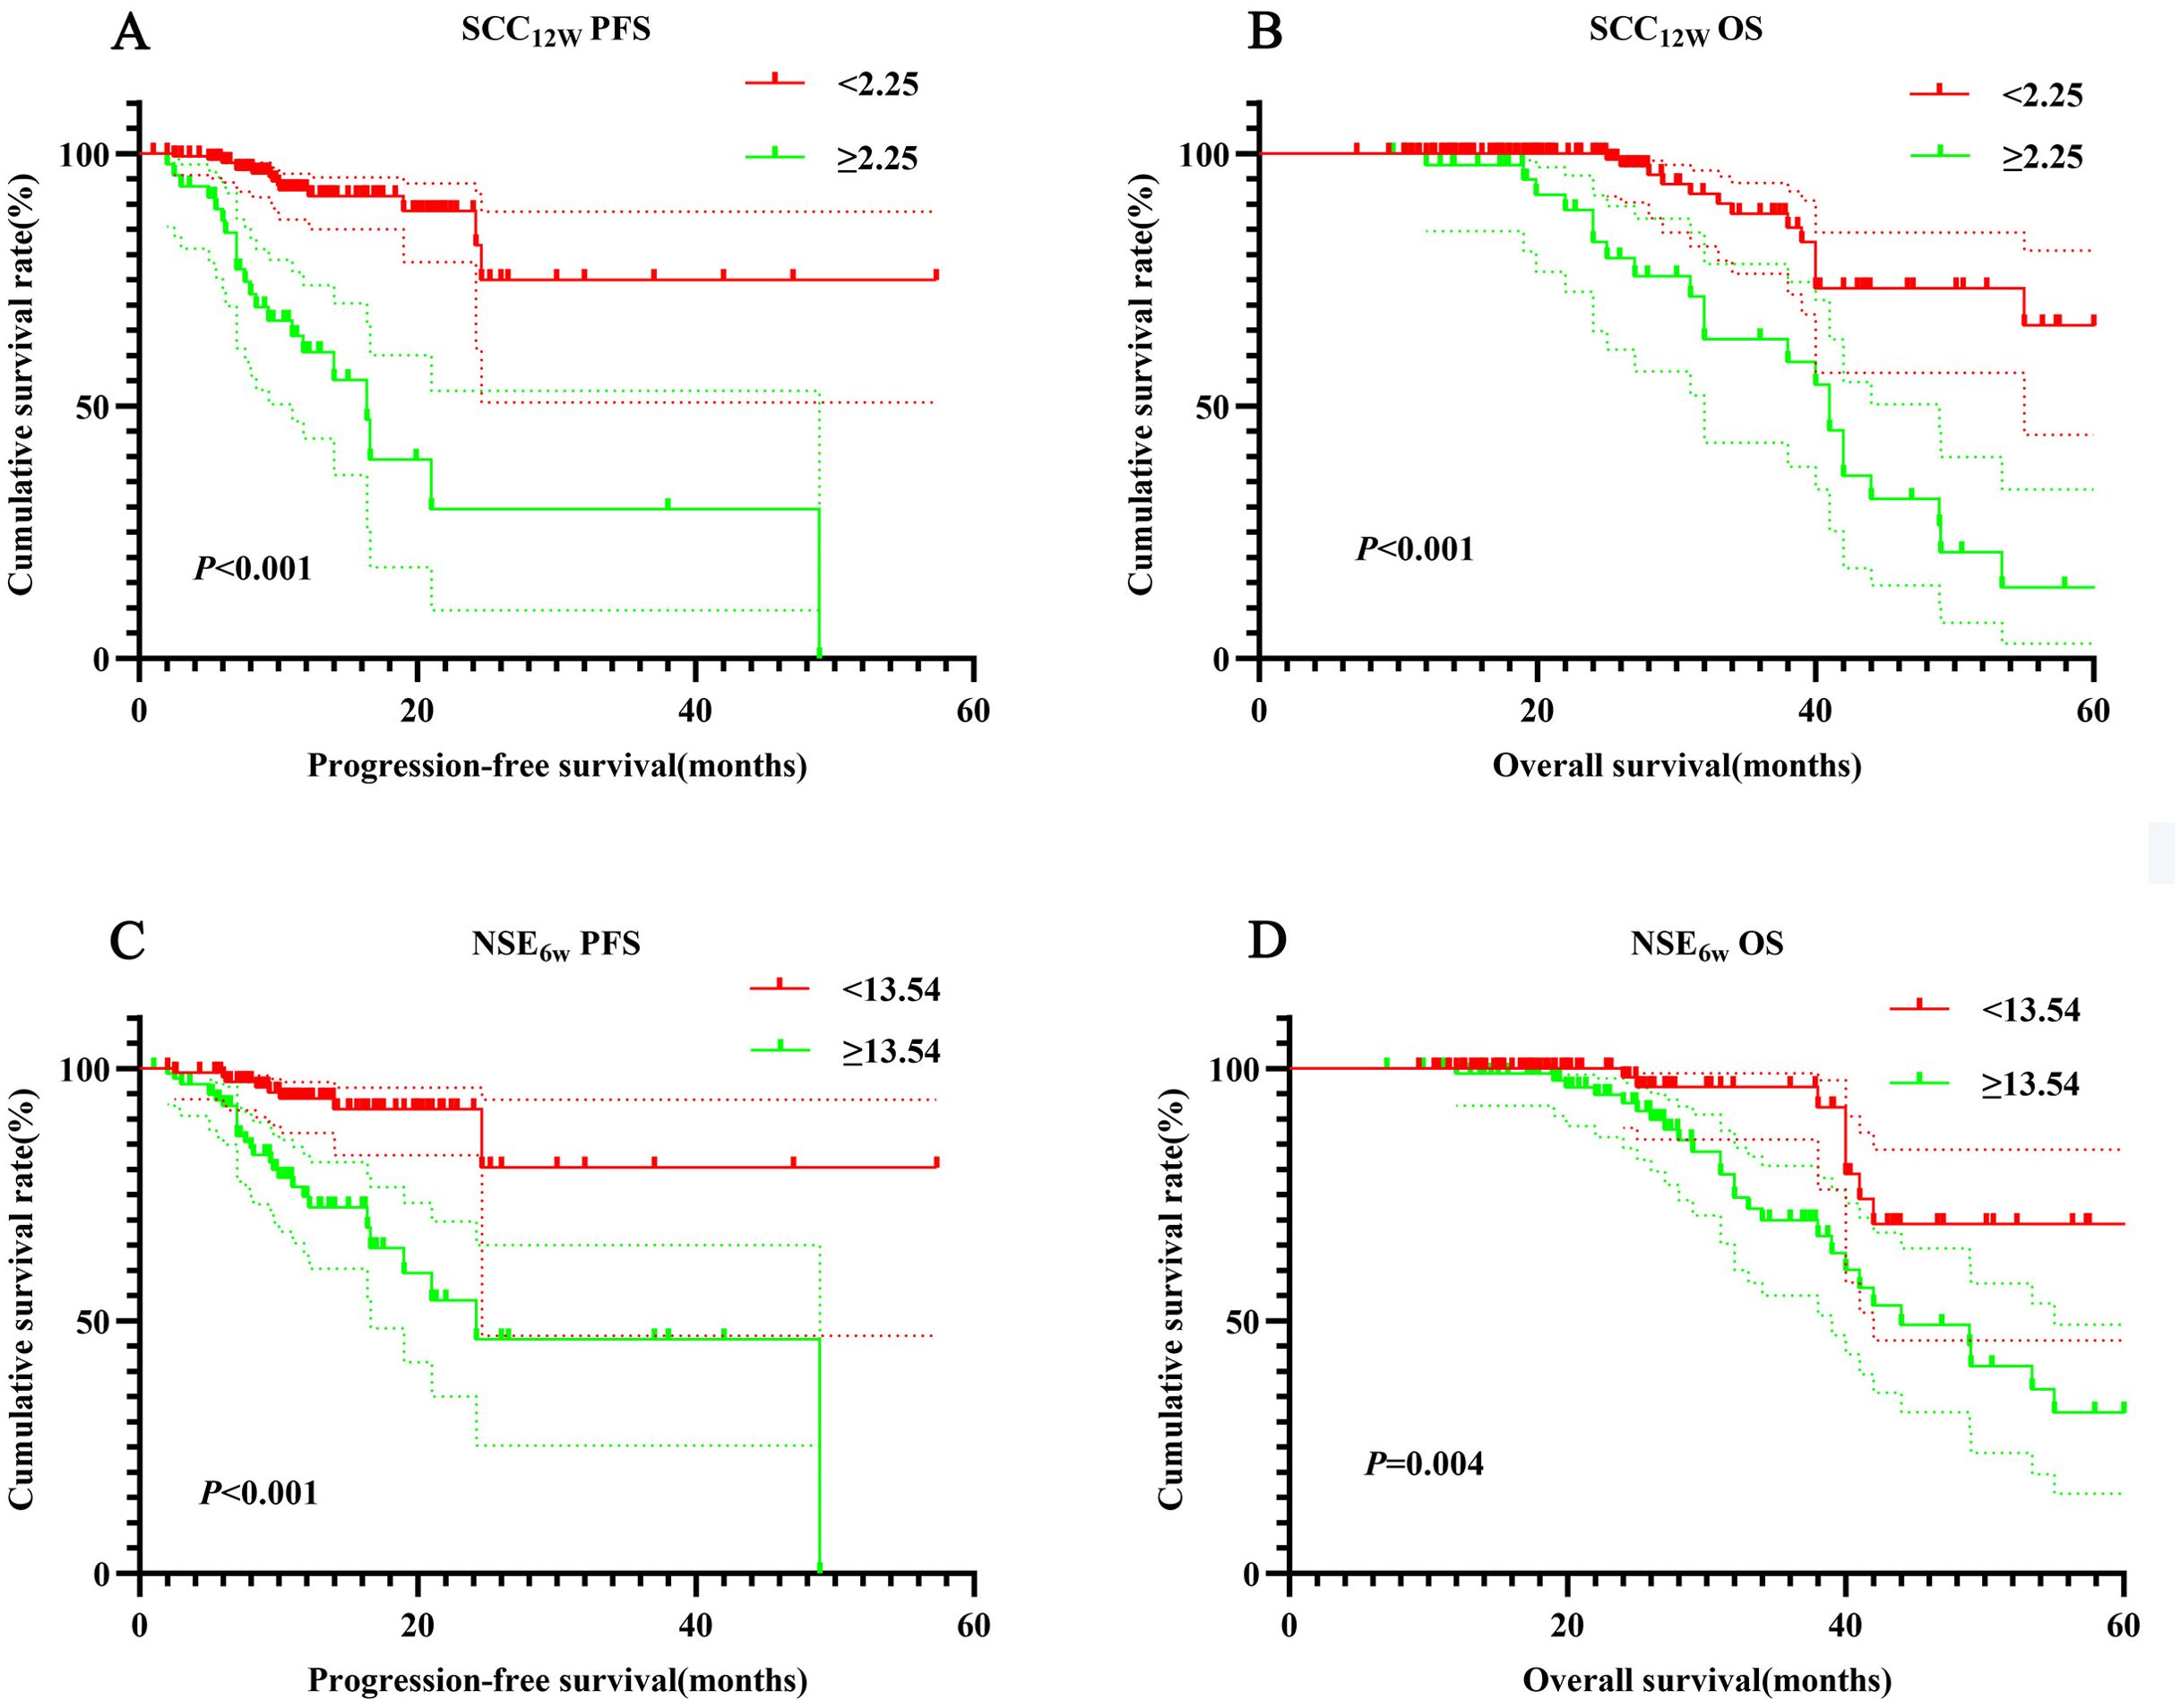
Figure 2. Survival curve for SCC12w and NSE6w. SCC12w-ralated survival curve for (A) PFS and (B) OS; NSE6w-ralated survival curve for (C) PFS and (D) OS.
3.7 TreatmentIn this study, 38 patients received PD-1 inhibitors alone (ICIs group), while 174 patients underwent chemotherapy combined with immunotherapy (ICIs+Chemo group). Baseline demographics and disease characteristics are summarized in Table 3. Significant differences were observed between the two groups regarding the number of treatment lines (p = 0.023), Hb0w (p = 0.002), and WBC12w (p = 0.047).
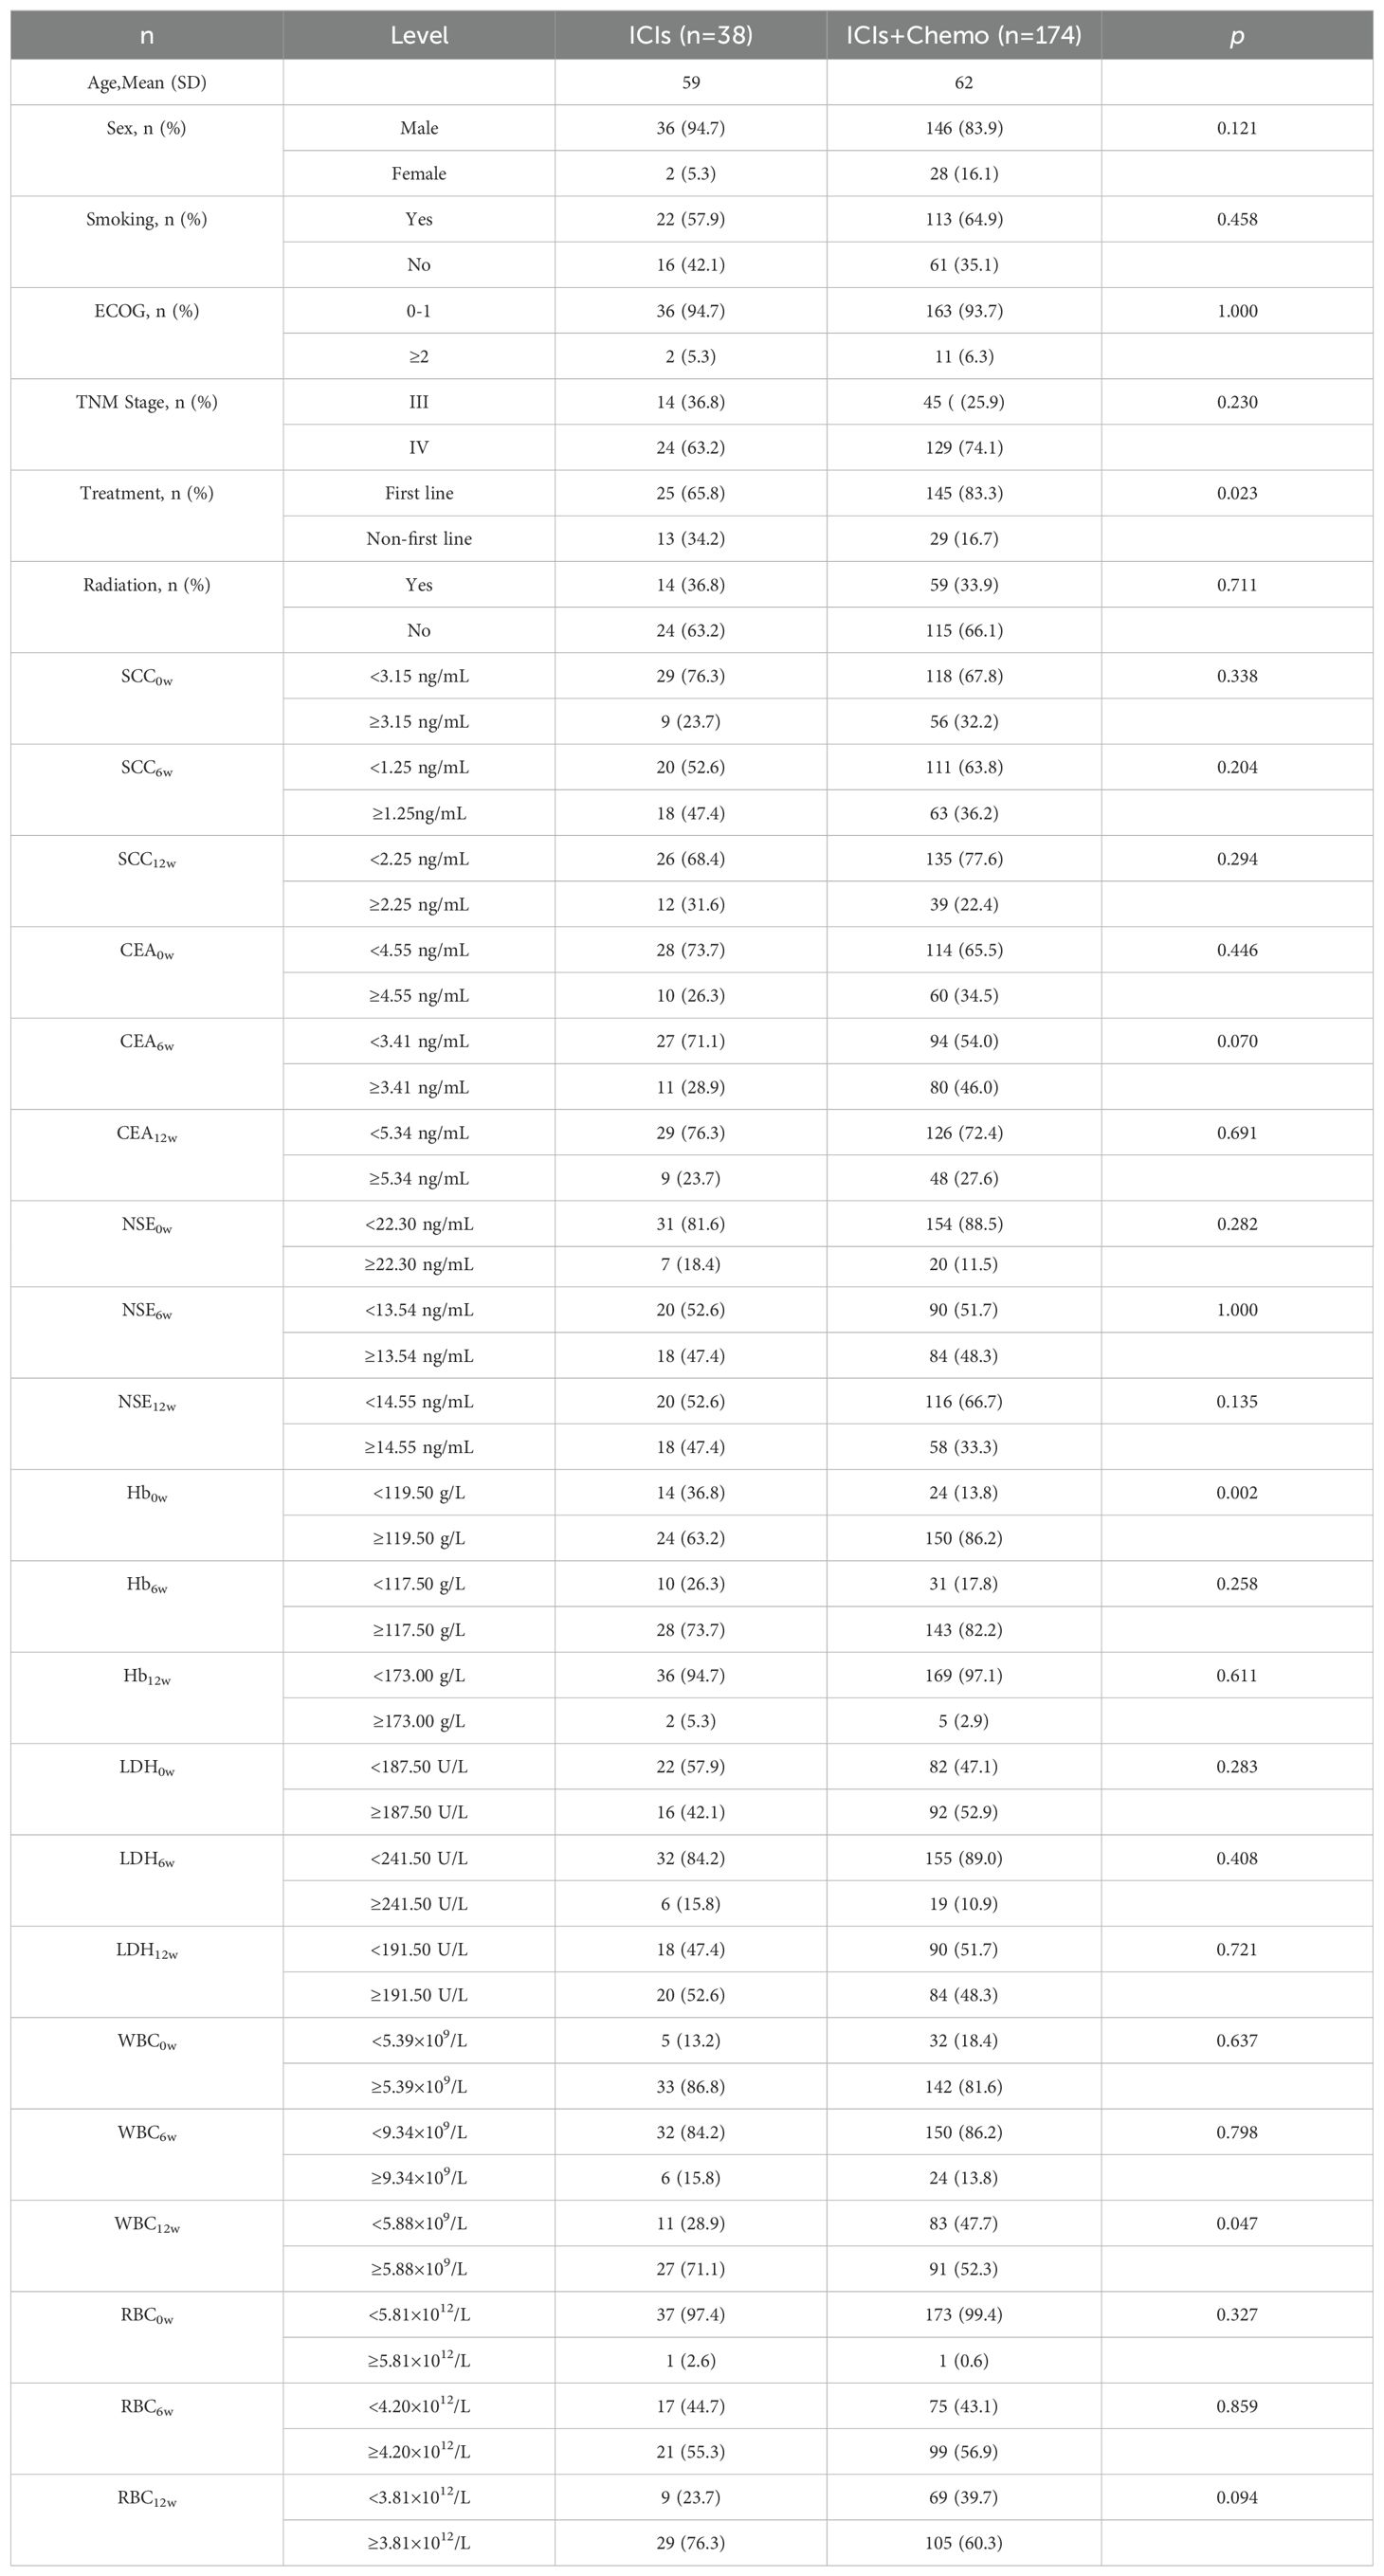
Table 3. The clinical characteristics for treatment (ICIs and ICIs+Chemo).
Patients in the ICIs group had significantly shorter PFS and OS compared to those in the ICIs+Chemo group (p < 0.001 vs. p = 0.002, Figures 3A, B). In the ICIs group, patients with SCC12w < 2.25 ng/mL had a median PFS of 13.1 months and OS of 26 months, compared to 11.8 months and 19.9 months, respectively, in patients with SCC12w ≥ 2.25 ng/mL (p = 0.025 vs. p = 0.004, Figures 3C, D). The 1- and 3-year PFS rates for patients with SCC12w < 2.25 ng/mL were 86.8%(95% CI:0.836-0.912) and 68.9%(95% CI:0.809-0.921), respectively, while their OS rates were 83.7%(95% CI:0.633-0.901) and 68.6%(95% CI:0.403-0.857). In contrast, patients with SCC12w ≥ 2.25 ng/mL had 1- and 3-year PFS rates of 82.8% (95% CI:0.801-0.890) and 62.8% (95% CI:0.420-0.937), and OS rates of 77.5% and 58.3%, respectively.
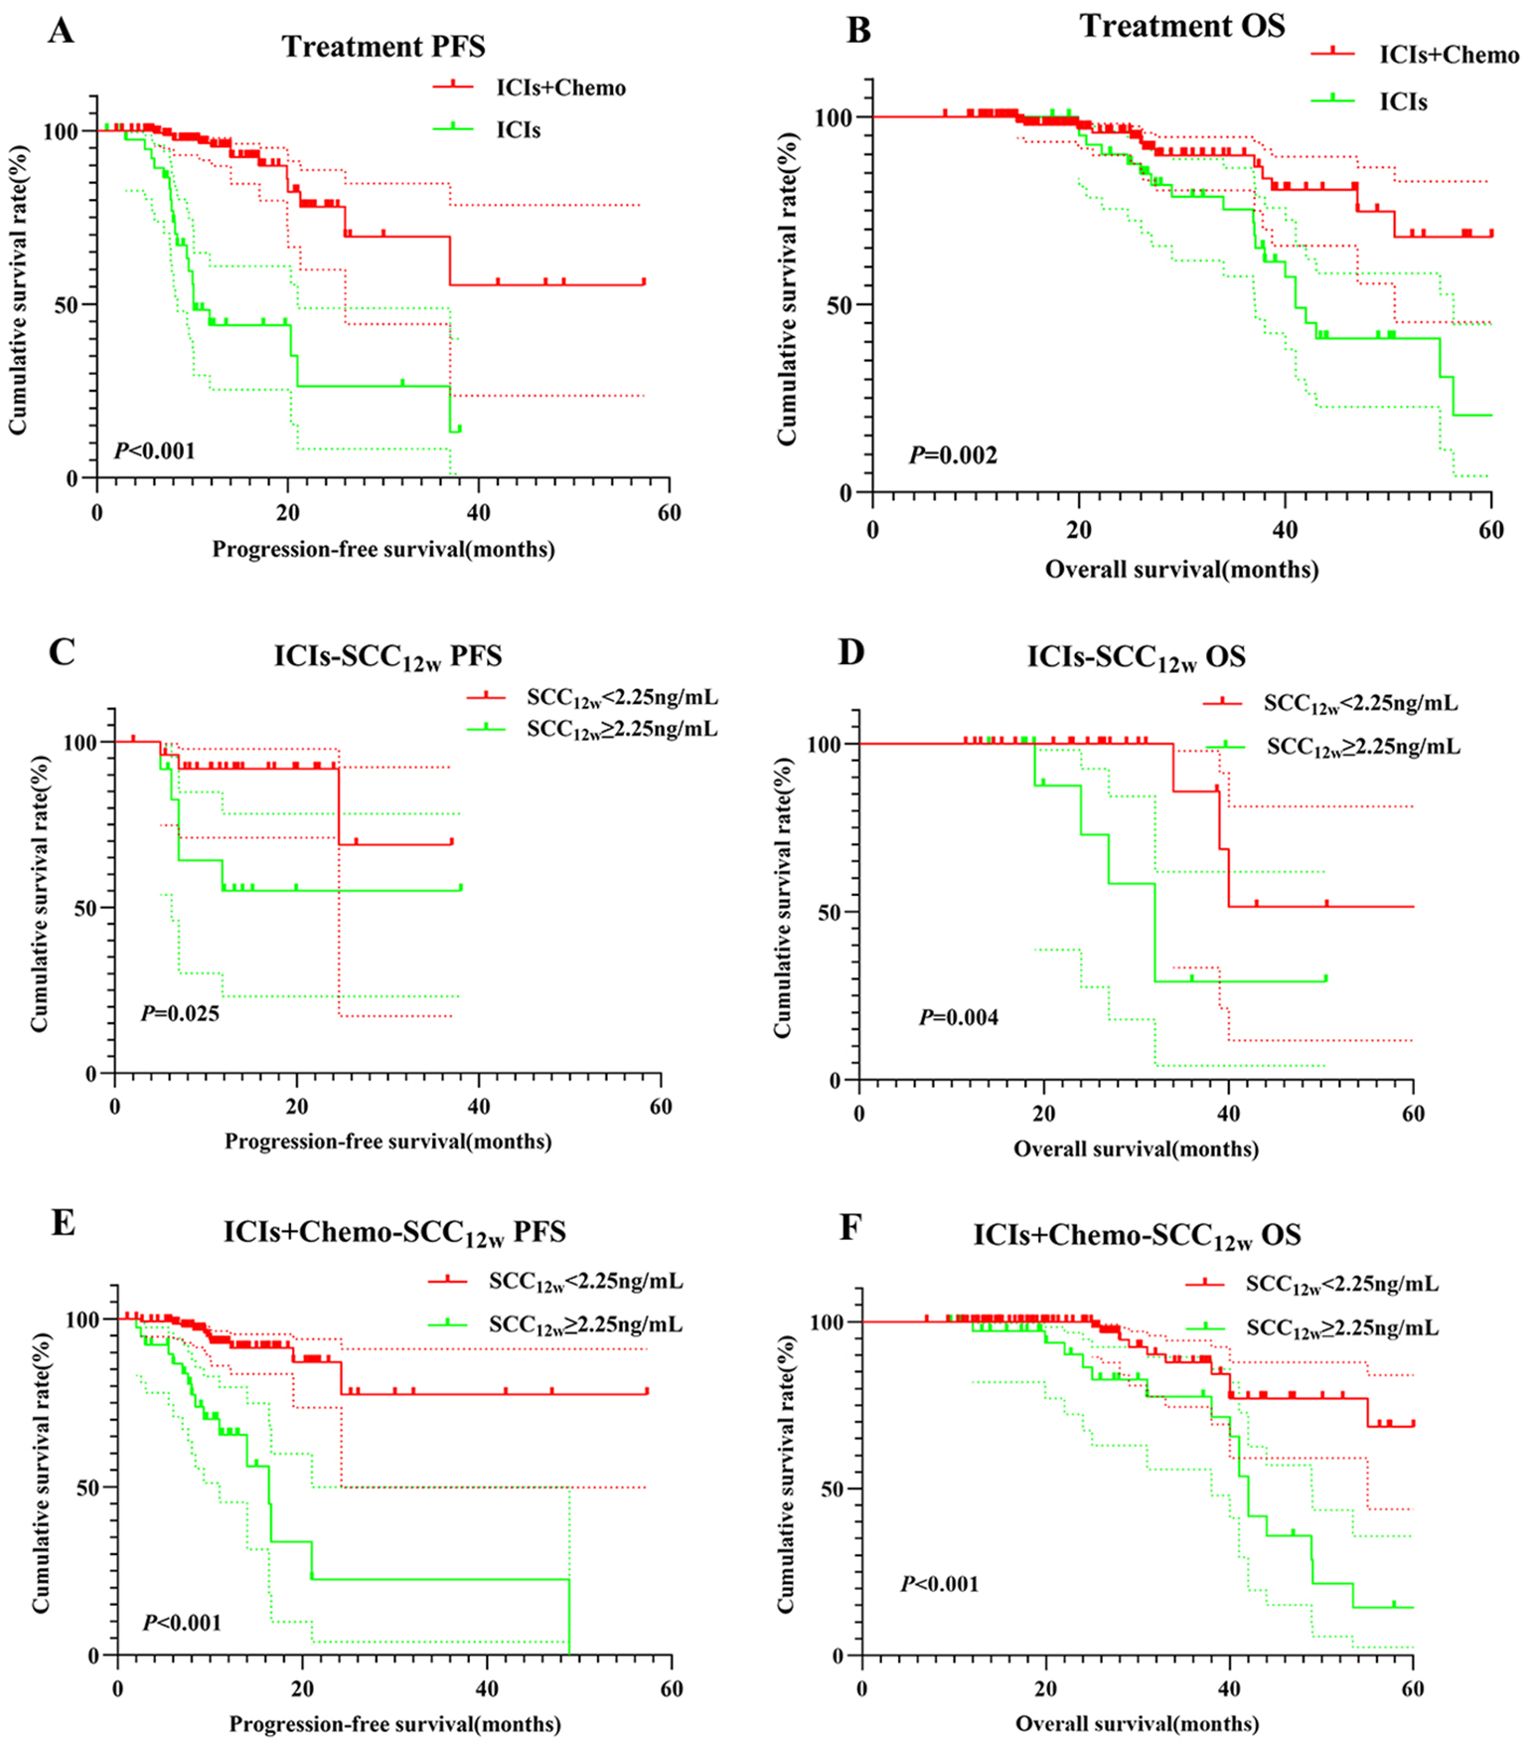
Figure 3. Survival curve for treatment and SCC12w.Treatment-related survival curve for (A) PFS and (B) OS; ICIs SCC12w-related survival curve for (C) PFS and (D) OS; ICIs+Chemo SCC12w-related survival curve for (E) PFS and (F) OS.
In the ICIs+Chemo group, patients with SCC12w < 2.25 ng/mL had a median PFS of 12.4 months and OS of 26 months, whereas those with SCC12w ≥ 2.25 ng/mL experienced significantly shorter PFS and OS (p < 0.001 vs. p < 0.001, Figures 3E, F). The 1- and 3-year PFS rates for patients with SCC12w < 2.25 ng/mL were 86.8%(95% CI:0.836-0.912) and 68.9%(95% CI:0.809-0.921), while OS rates were 83.7%(95% CI:0.633-0.901) and 68.6%(0.403-0.857), respectively. By comparison, patients with SCC12w ≥ 2.25 ng/mL had 1- and 3-year PFS rates of 82.1% (95% CI:0.5037-0.852) and 65.5% (95% CI:0.3714-0.706), and OS rates of 73.5% (95% CI:0.920-0.998) and 57.5%(95%CI:0.627-0.957), respectively.
3.8 Positive expression of programmed death ligand 1According to NCCN guidelines, assessing PD-L1 expression levels is recommended for patients receiving PD-1 inhibitors. PD-1/PD-L1 expression on tumor cells is analyzed using immunohistochemistry (IHC), with positivity defined as expression levels of ≥1%. In this retrospective study, PD-L1 expression was positive in 72 cases (33.9%), negative in 9 cases (4.2%), and unknown in 131 cases (61.8%). Among PD-L1-positive patients, those in the SCC12w < 2.25 ng/mL group demonstrated significantly longer PFS and OS compared to the SCC12w ≥ 2.25 ng/mL group (p < 0.001). The 1- and 3-year PFS and OS rates in the SCC12w < 2.25 ng/mL group were 90.9% (95% CI:0.828-0.999)、60.6% (95% CI:0.342-1.000)、99.5%(95% CI:0.638-1.000) and 71.2%(95% CI:0.843-0.998), respectively, whereas these rates were markedly lower in the SCC12w ≥ 2.25 ng/mL group at 58.7%(95% CI:0.392-0.878)、23.3%(95% CI:0.675-0.963)、94.1%(95% CI:0.836-1.000) and 29.1%(95% CI:0.097-0.873), respectively (Figures 4A, B).
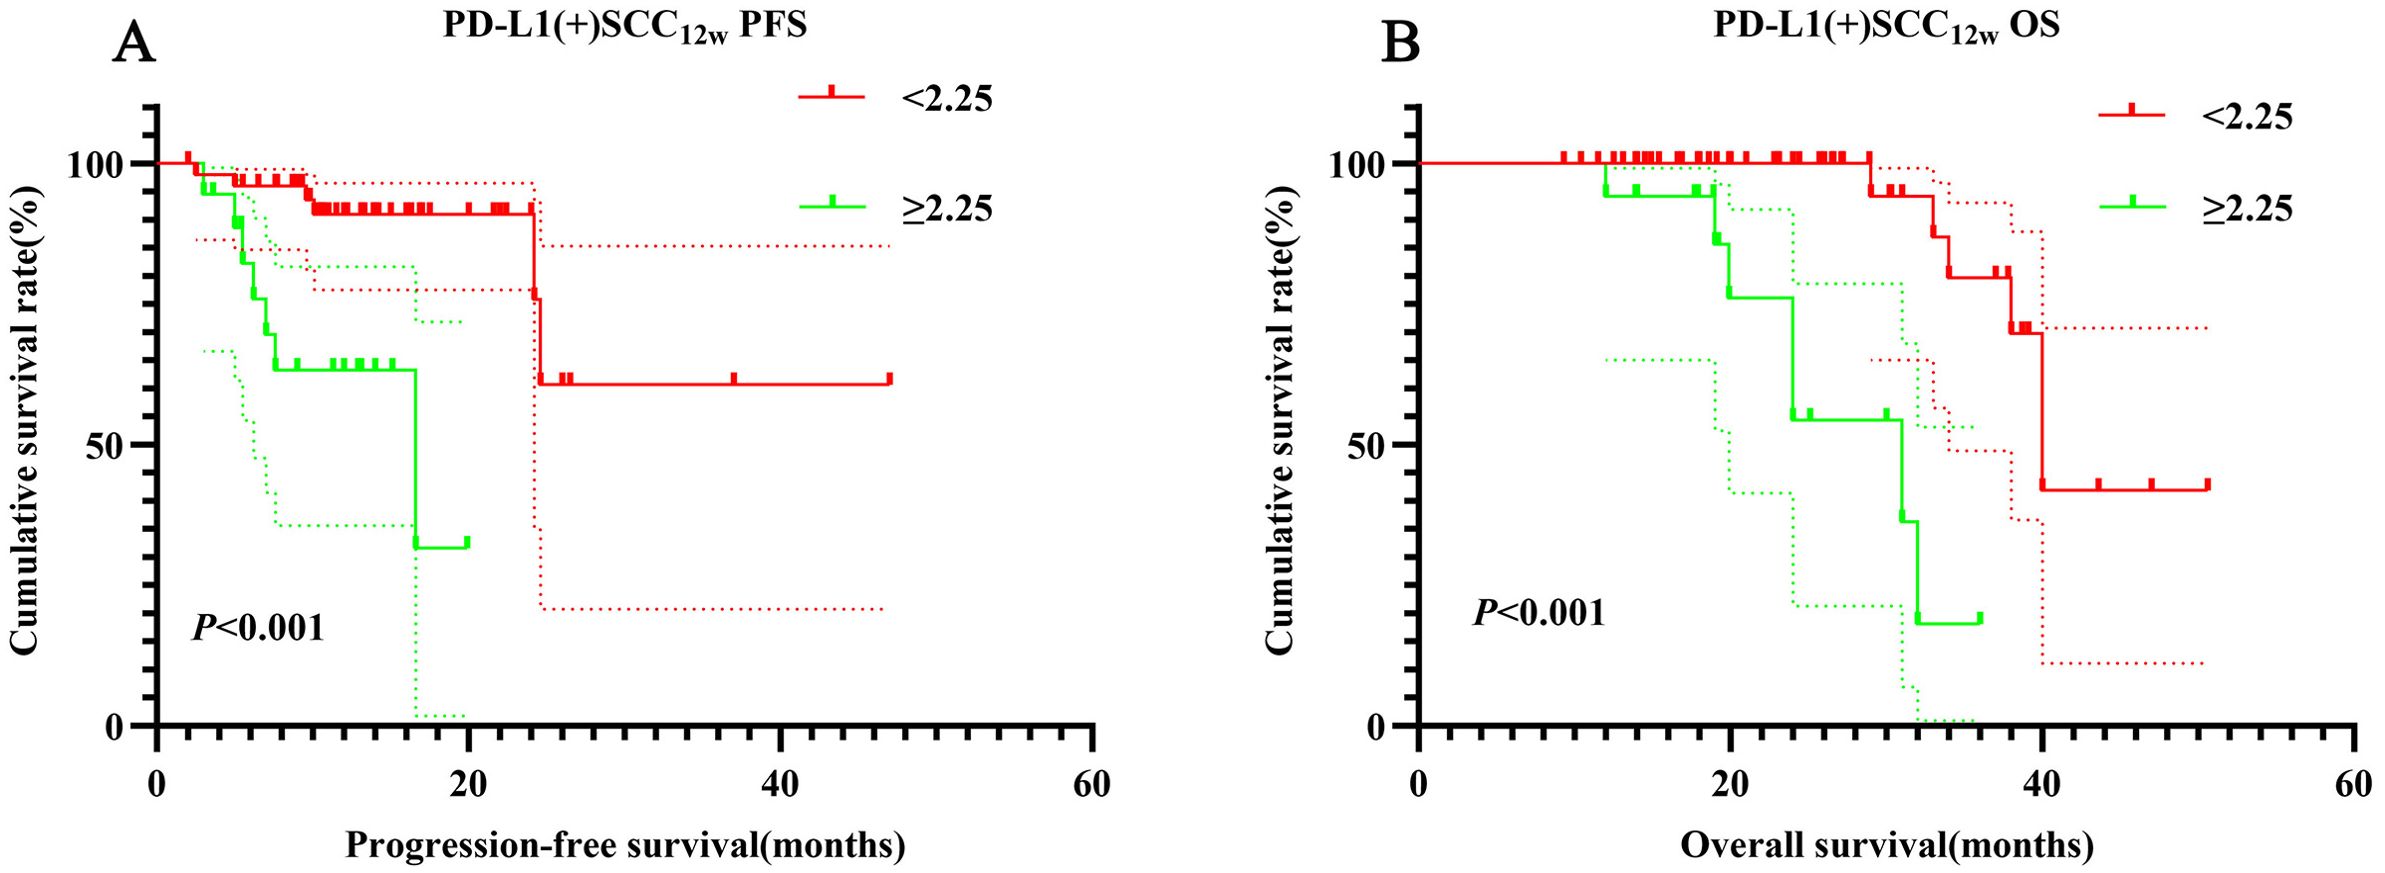
Figure 4. Survival curve for PD-L1(+) SCC12w. PD-L1(+) SCC12w-related survival curve for (A) PFS and (B) OS.
3.9 Evaluation of the construction of column-line diagramsMultivariate Cox regression analysis identified SCC12w, NSE6w, and RBC0w as independent prognostic factors influencing the outcomes of ICIs. The Schenfeld residual test confirmed that these variables satisfied the proportional risk assumption for both PFS and OS analyses (p > 0.05, Supplementary Figure 2). To further evaluate their predictive accuracy, nomograms were developed to estimate the probability of PFS and OS at 1, 3, and 5 years (Figures 5A, B). The C-index values for the nomograms were 0.725 (95% CI: 0.478-0.928) and 0.755(95% CI: 0.642-0.868) for OS, indicating robust predictive performance. Additionally, Bootstrap correction demonstrated excellent consistency and calibration of the nomograms (Figures 6A, B).
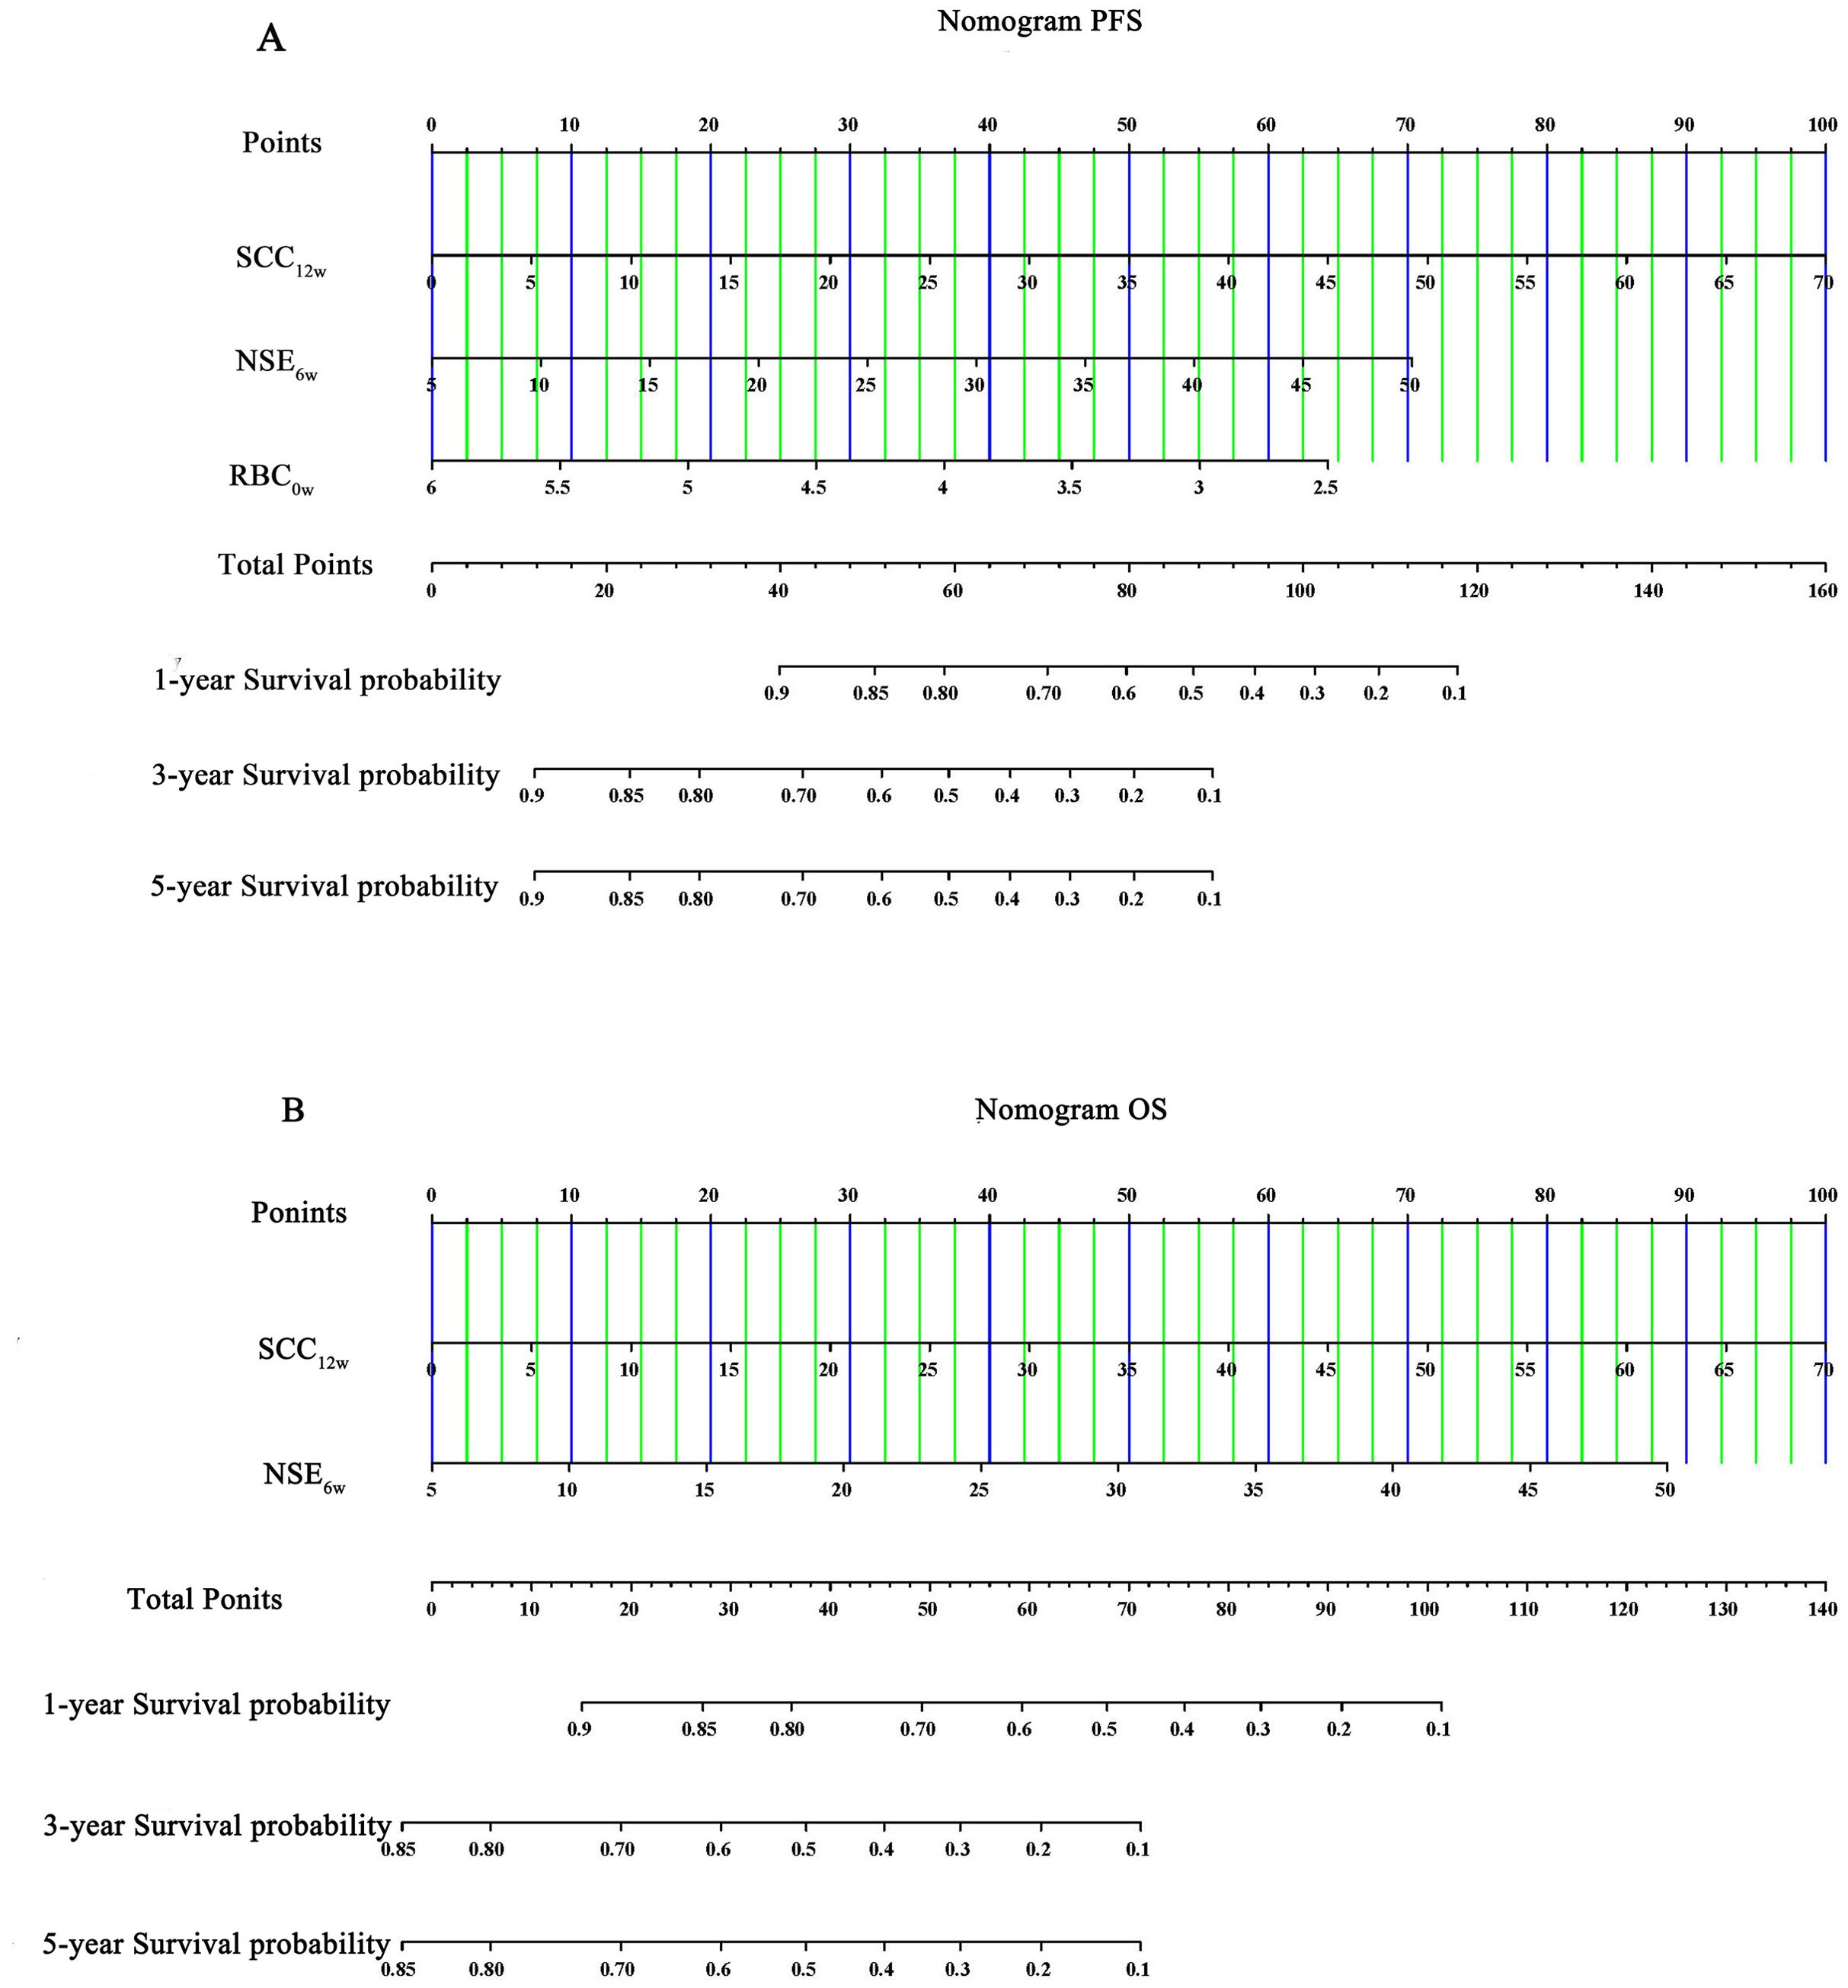
Figure 5. Nomogram of (A) PFS and (B) OS.
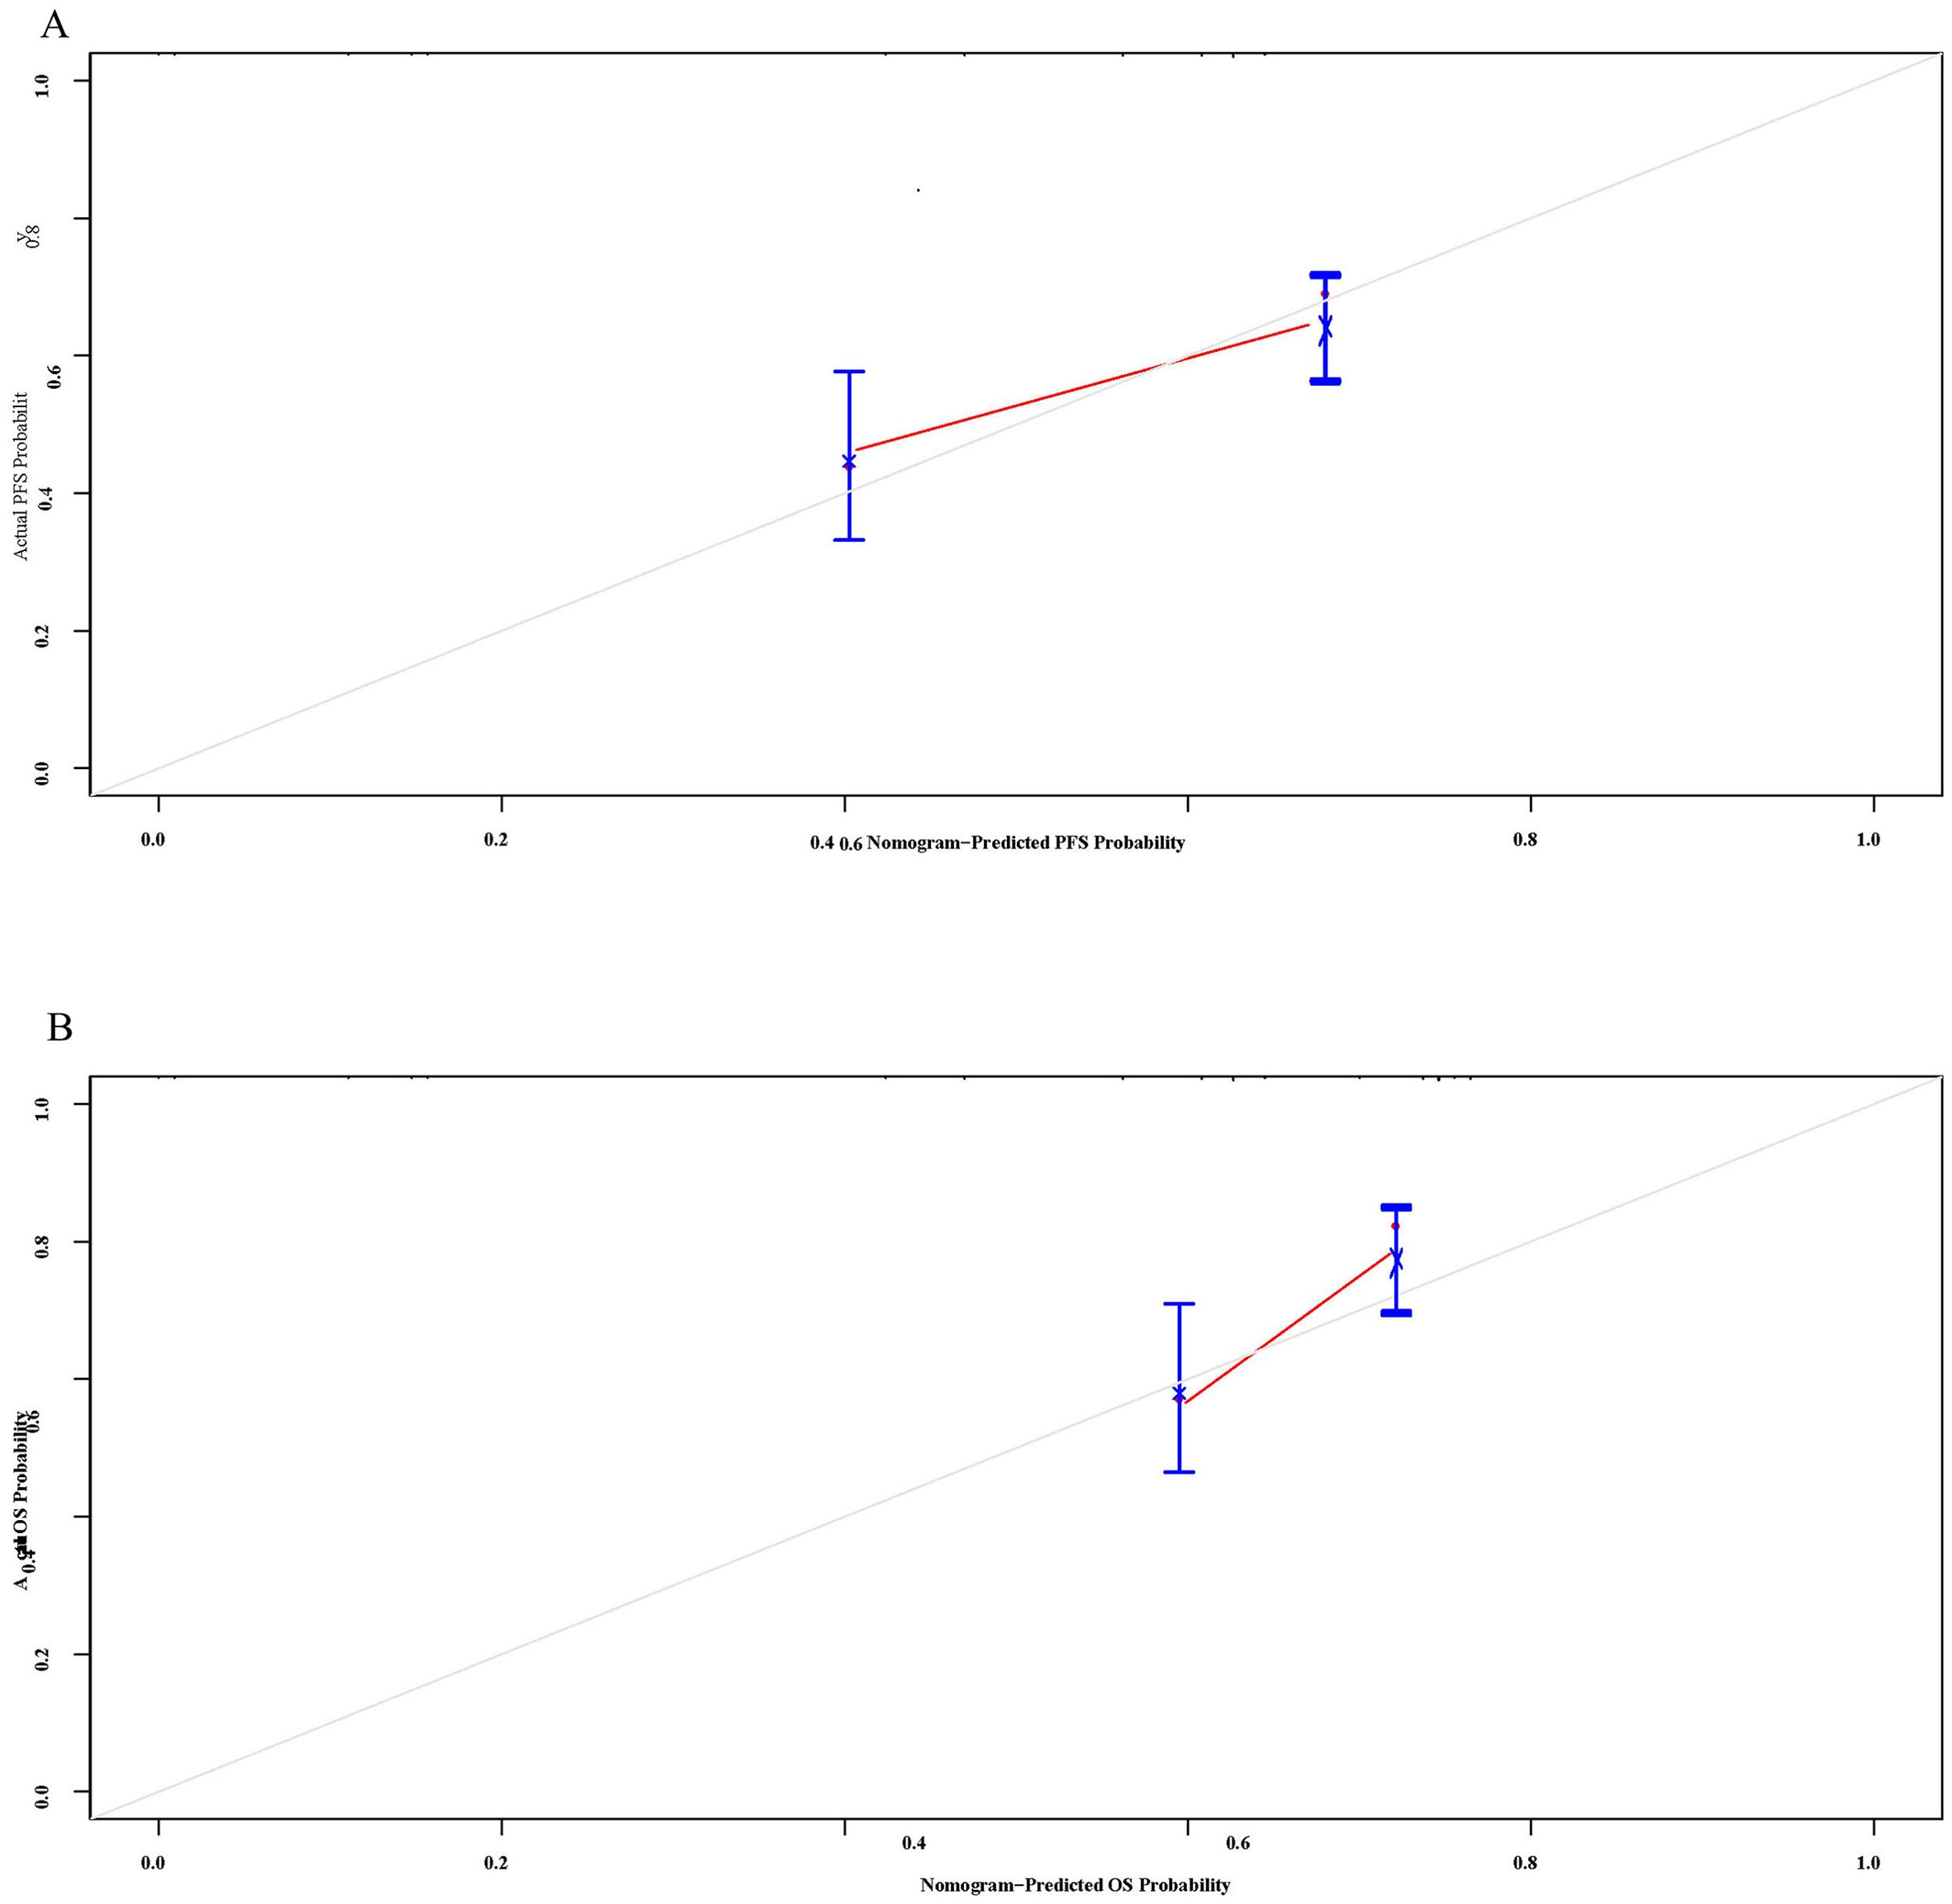
Figure 6. The calibration curves of the nomograms for (A) PFS and (B) OS.
4 DiscussionChemotherapy, radiotherapy and targeted therapy have achieved some success in the treatment of lung cancer, but the efficacy is still unsatisfactory. In recent years, with the emergence of immunotherapy represented by immune checkpoint inhibitors has brought new hope to lung cancer patients (12). Anti-PD-1-based immunotherapy plays an important role in patients with advanced squamous lung cancer. Compared with conventional chemotherapy, PD-1 inhibitors have high efficacy in patients with advanced non-small cell lung cancer (12). PD-1 inhibitors alleviate the inhibitory effect of tumor cells on immune cells by blocking the binding of PD-L1 to PD-1, thus restoring the tumor-killing effect of the immune system (13). Although immunotherapy has revolutionized cancer treatment, less than 30% of patients benefit from ICIs (14). There is a lack of methods that can accurately predict the prognosis and predictors of immunotherapy. Identifying simple and affordable tools to predict the efficacy of immunotherapy in advanced cancer is one of the clinical needs that are currently being highly prioritized and researched.
Peripheral blood bioindicators are rapidly emerging in the field of immuno-oncology. They not only reflect tumor biology, but also provide evolving host immune responses to tumors. Han et al. found that TCR diversity of peripheral blood PD-1CD8+ T cells could be used as a non-invasive predictor of response to ICIs and survival outcomes in NSCLC patients (15). Increased PD-1CD8+ TCR clonality 4-6 weeks after ICIs treatment was associated with higher DCR, longer PFS and OS (15). In addition, peripheral blood inflammatory markers, such as NLR and LDH (16), can predict the prognosis of immunotherapy in patients with advanced NSCLC (17). Higher-than-normal levels of C-reactive protein have been associated with poorer PFS and OS in patients with PD-1 inhibitor-treated cancers (18). In a retrospective study of 1714 cases of 16 different cancer types treated with ICIs, the combination of low NLR/high TMB group was found to provide significant benefit from ICIs therapy (19). Dynamic changes in peripheral blood inflammatory biomarkers also reflect treatment response and prognosis in NSCLC patients receiving neoadjuvant immunotherapy (20). Not only that, tumor markers such as α-fetoprotein (21) and CEA (22) are helpful in clinical assessment of PD-1 inhibitor efficacy and predictive modeling. In a multicenter retrospective analysis, CRP and alpha-fetoprotein were found to score immunotherapy in patients with hepatocellular carcinoma treated with atezolizumab in combination with bevacizumab, and patients with AFP ≥ 100 ng/mL and CRP ≥1 mg/dL were found to have a poorer prognosis (21). In several retrospective analyses, it was found that a reduction in CEA or CYFRA21-1 levels may be a reliable biologic predictor of the efficacy of immunotherapy in patients with NSCLC (22).
Because of the close relationship between tumor markers and squamous cell carcinoma of the lung, we first linked several common tumor markers to the prognosis of immunotherapy for squamous cell carcinoma of the lung. We found that RBC and WBC were predictive of immunotherapy response, with RBC below 3.81 × 10¹²/L at week 12 associated with lower ORR; WBC below 9.34 × 10⁹/L at week 6 post-treatment was associated with higher DCR. In an extensive analysis of the prognostic value of various parameters, we found that SCC12w had the highest AUC among the blood markers. Not only that, SCC12w was also an independent predictor of survival prognosis in advanced squamous lung carcinoma treated with PD-1 inhibitors. In addition, the analysis of the survival outcome showed that SCC12w higher than 2.25 ng/mL was associated with a poorer prognosis, which was in line with Zhang et al. concluded that lower combined levels of SCC-Ag, CEA, CA125, and CYFRA21-1 were consistent with the result that immunotherapy for advanced squamous lung cancer had better survival outcomes (9). In our analysis, NSE was also an independent predictor of prognostic indicators for advanced squamous lung cancer treated with PD-1 inhibitors. Huang et al. found that serum CEA, NSE and CYFRA21-1 can predict PFS and OS in patients with advanced LUAD and LUSC. The higher the serum levels of NSE, CYFRA21-1 and CA125, the worse the PFS and OS in patients with LUAD and LUSC (23). According to NCCN guidelines, patients with positive PD-L1 expression usually show a better prognosis in terms of immunotherapy. However, in this study, there were only 9 patients with negative PD-L1 expression, which is a small sample size. Preliminary analysis showed possible bias error. Therefore, we excluded patients with PD-L1-negative expression and included only patients with PD-L1-positive expression for prognostic analysis. We evaluated the predictive value of hematological indices in patients with positive PD-L1 expression for the prognosis of survival after treatment. The results showed that SCC12w above 2.25 ng/mL and NSE6w below 13.54 ng/mL had a poor prognosis among patients with positive PD-1 expression after treatment.
Our study still has limitations. First, this study was a retrospective analysis with a small sample size, and more lung cancer patients treated with ICIs and multicenter prospective cohort studies should be recruited. Second, the lack of effective information on PD-L1 in patients, our findings may differ from the real world may. In fact, PD-L1 showed some predictive effects in non-small cell lung cancer treated with ICIs. Third, there were different time points of patients’ treatment with ICIs, and there was heterogeneity in this study as only 0, 6, and 12 weeks of treatment were included.
5 ConclusionIn conclusion, our findings indicate that post-treatment SCC and NSE reduction serves as an independent prognostic factor for PD-1 inhibitor therapy in patients with advanced squamous lung cancer. Furthermore, our results demonstrate a significant association between SCC and NSE reduction and improved prognosis in patients treated with PD-1 inhibitors.
Data availability statementThe raw data supporting the conclusions of this article will be made available by the authors, without undue reservation.
Ethics statementThe studies involving humans were approved by Harbin Medical University Cancer Hospital (Ethical approval number:KY-2022-25). The studies were conducted in accordance with the local legislation and institutional requirements. Written informed consent for participation was not required from the participants or the participants’ legal guardians/next of kin in accordance with the national legislation and institutional requirements.
Author contributionsYX: Writing – original draft, Formal analysis, Investigation. HS: Writing – original draft, Formal analysis, Methodology. LS: Writing – original draft, Data curation. XM: Writing – original draft, Validation. QS: Writing – original draft, Validation. FL: Writing – review & editing, Funding acquisition.
FundingThe author(s) declare financial support was received for the research, authorship, and/or publication of this article. the Haiyan Foundation of Harbin Medical University Cancer Hospital (grant number: JJDZ2022-05), the Beijing Health Alliance Charitable Foundation (grant number: KM227020), the National Cancer Centre Climbing Foundation (grant number: NCC201908B11), the Beijing Science and Technology Innovation Medical Development Foundation (grant number: 81270113), and the Beijing Medical and Health Foundation (grant number: YWJKJJHKYJJ-TB23008).
Conflict of interestThe authors declare that the research was conducted in the absence of any commercial or financial relationships that could be construed as a potential conflict of interest.
Publisher’s noteAll claims expressed in this article are solely those of the authors and do not necessarily represent those of their affiliated organizations, or those of the publisher, the editors and the reviewers. Any product that may be evaluated in this article, or claim that may be made by its manufacturer, is not guaranteed or endorsed by the publisher.
Supplementary materialThe Supplementary Material for this article can be found online at: https://www.frontiersin.org/articles/10.3389/fonc.2024.1454709/full#supplementary-material
References2. Zhang J, Pan Y, Shi Q, Zhang G, Jiang L, Dong X, et al. Paclitaxel liposome for injection (Lipusu) plus cisplatin versus gemcitabine plus cisplatin in the first-line treatment of locally advanced or metastatic lung squamous cell carcinoma: A multicenter, randomized, open-label, parallel controlled clinical study. Cancer Commun (Lond). (2022) 42:3–16. doi: 10.1002/cac2.12225
PubMed Abstract | Crossref Full Text | Google Scholar
3. Zhang S, Bai X, Shan F. The progress and confusion of anti-PD1/PD-L1 immunotherapy for patients with advanced non-small cell lung cancer. Int Immunopharmacol. (2020) 80:106247. doi: 10.1016/j.intimp.2020.106247
PubMed Abstract | Crossref Full Text | Google Scholar
4. Yoshida H, Nomizo T, Ozasa H, Tsuji T, Funazo T, Yasuda Y, et al. PD-L1 polymorphisms predict survival outcomes in advanced non-small-cell lung cancer patients treated with PD-1 blockade. Eur J Cancer. (2021) 144:317–25. doi: 10.1016/j.ejca.2020.11.035
PubMed Abstract | Crossref Full Text | Google Scholar
5. Tian Y, Xu J, Chu Q, Duan J, Zhang J, Bai H, et al. A novel tumor mutational burden estimation model as a predictive and prognostic biomarker in NSCLC patients. BMC Med. (2020) 18:232. doi: 10.1186/s12916-020-01694-8
PubMed Abstract | Crossref Full Text | Google Scholar
6. Putzu C, Cortinovis DL, Colonese F, Canova S, Carru C, Zinellu A, et al. Blood cell count indexes as predictors of outcomes in advanced non-small-cell lung cancer patients treated with Nivolumab. Cancer Immunol Immunother. (2018) 67:1349–53. doi: 10.1007/s00262-018-2182-4
PubMed Abstract | Crossref Full Text | Google Scholar
7. Ksienski D, Wai ES, Alex D, Croteau NS, Freeman AT, Chan A, et al. Prognostic significance of the neutrophil-to-lymphocyte ratio and platelet-to-lymphocyte ratio for advanced non-small cell lung cancer patients with high PD-L1 tumor expression receiving pembrolizumab. Transl Lung Cancer Res. (2021) 10:355–67. doi: 10.21037/tlcr-20-541
PubMed Abstract | Crossref Full Text | Google Scholar
8. Ohashi K, Nishito Y, Fukuda H, Sadahiro R, Yoshida Y, Watanabe SI, et al. Neutrophil-to-lymphocyte ratio is a prognostic factor reflecting immune condition of tumor microenvironment in squamous cell lung cancer. Sci Rep. (2024) 14:429. doi: 10.1038/s41598-023-50378-9
PubMed Abstract | Crossref Full Text | Google Scholar
9. Zhang Z, Yuan F, Chen R, Li Y, Ma J, Yan X, et al. Dynamics of serum tumor markers can serve as a prognostic biomarker for Chinese advanced non-small cell lung cancer patients treated with immune checkpoint inhibitors. Front Immunol. (2020) 11:1173. doi: 10.3389/fimmu.2020.01173
PubMed Abstract | Crossref Full Text | Google Scholar
10. Yang Y, Jiang X, Liu Y, Huang H, Xiong Y, Xiao H, et al. Elevated tumor markers for monitoring tumor response to immunotherapy. EClinicalMedicine. (2022) 46:101381. doi: 10.1016/j.eclinm.2022.101381
PubMed Abstract | Crossref Full Text | Google Scholar
11. Chen Y, Wen S, Xia J, Du X, Wu Y, Pan B, et al. Association of dynamic changes in peripheral blood indexes with response to PD-1 inhibitor-based combination therapy and survival among patients with advanced non-small cell lung cancer. Front Immunol. (2021) 12:672271. doi: 10.3389/fimmu.2021.672271
PubMed Abstract | Crossref Full Text | Google Scholar
13. Chow A, Perica K, Klebanoff CA, Wolchok JD. Clinical implications of T cell exhaustion for cancer immunotherapy. Nat Rev Clin Oncol. (2022) 19:775–90. doi: 10.1038/s41571-022-00689-z
PubMed Abstract | Crossref Full Text | Google Scholar
14. Qin S, Ren Z, Meng Z, Chen Z, Chai X, Xiong J, et al. Camrelizumab in patients with previously treated advanced hepatocellular carcinoma: a multicentre, open-label, parallel-group, randomised, phase 2 trial. Lancet Oncol. (2020) 21:571–80. doi: 10.1016/S1470-2045(20)30011-5
PubMed Abstract | Crossref Full Text | Google Scholar
15. Han J, Duan J, Bai H, Wang Y, Wan R, Wang X, et al. TCR repertoire diversity of peripheral PD-1(+)CD8(+) T cells predicts clinical outcomes after immunotherapy in patients with non-small cell lung cancer. Cancer Immunol Res. (2020) 8:146–54. doi: 10.1158/2326-6066.CIR-19-0398
PubMed Abstract | Crossref Full Text | Google Scholar
16. Tjokrowidjaja A, Lord SJ, John T, Lewis CR, Kok PS, Marschner IC, et al. Pre- and on-treatment lactate dehydrogenase as a prognostic and predictive biomarker in advanced non-small cell lung cancer. Cancer. (2022) 128:1574–83. doi: 10.1002/cncr.v128.8
PubMed Abstract | Crossref Full Text | Google Scholar
17. Peng L, Wang Y, Liu F, Qiu X, Zhang X, Fang C, et al. Peripheral blood markers predictive of outcome and immune-related adverse events in advanced non-small cell lung cancer treated with PD-1 inhibitors. Cancer Immunol Immunother. (2020) 69:1813–22. doi: 10.1007/s00262-020-02585-w
PubMed Abstract | Crossref Full Text | Google Scholar
18. Iivanainen S, Ahvonen J, Knuuttila A, Tiainen S, Koivunen JP. Elevated CRP levels indicate poor progression-free and overall survival on cancer patients treated with PD-1 inhibitors. ESMO Open. (2019) 4:e000531. doi: 10.1136/esmoopen-2019-000531
PubMed Abstract | Crossref Full Text | Google Scholar
19. Valero C, Lee M, Hoen D, Weiss K, Kelly DW, Adusumilli PS, et al. Pretreatment neutrophil-to-lymphocyte ratio and mutational burden as biomarkers of tumor response to immune checkpoint inhibitors. Nat Commun. (2021) 12:729. doi: 10.1038/s41467-021-20935-9
PubMed Abstract | Crossref Full Text | Google Scholar
20. Huai Q, Luo C, Song P, Bie F, Bai G, Li Y, et al. Peripheral blood inflammatory biomarkers dynamics reflect treatment response and predict prognosis in non-small cell lung cancer patients with neoadjuvant immunotherapy. Cancer Sci. (2023) 114:4484–98. doi: 10.1111/cas.v114.12
PubMed Abstract | Crossref Full Text | Google Scholar
21. Hatanaka T, Kakizaki S, Hiraoka A, Tada T, Hirooka M, Kariyama K, et al. Prognostic impact of C-reactive protein and alpha-fetoprotein in immunotherapy score in hepatocellular carcinoma patients treated with atezolizumab plus bevacizumab: a multicenter retrospective study. Hepatol Int. (2022) 16:1150–60. doi: 10.1007/s12072-022-10358-z
PubMed Abstract | Crossref Full Text | Google Scholar
22. Dal Bello MG, Filiberti RA, Alama A, Orengo AM, Mussap M, Coco S, et al. The role of CEA, CYFRA21-1 and NSE in monitoring tumor response to Nivolumab in advanced non-small cell lung cancer (NSCLC) patients. J Transl Med. (2019) 17:74. doi: 10.1186/s12967-019-1828-0
PubMed Abstract | Crossref Full Text | Google Scholar
23. Huang J, Xiao Y, Zhou Y, Deng H, Yuan Z, Dong L, et al. Baseline serum tumor markers predict the survival of patients with advanced non-small cell lung cancer receiving first-line immunotherapy: a multicenter retrospective study. BMC Cancer. (2023) 23:812. doi: 10.1186/s12885-023-11312-4
留言 (0)