Sinonasal illnesses, characterized by headaches and nasal symptoms, benefit from early detection and intervention.[1] Anatomical variations can obstruct airflow and contribute to recurrent sinusitis.[2] These variations may arise from genetic and environmental factors, and utilizing normative sizes aids in effective treatment planning.[3] Notably, variations such as agger nasi cells and concha bullosa (CB) complicate functional endoscopic sinus surgery (ESS),[4,5] highlighting the need for clear communication between radiologists and otorhinolaryngologists to mitigate surgical risks.[1]
While conventional radiography primarily serves as a screening tool, computed tomography (CT) scans provide critical anatomical insights that are essential for surgical planning, especially with advancements in multidetector CT.[3] CT imaging enhances visibility of variations such as Haller cells and CB, surpassing magnetic resonance imaging in detecting mucosal inflammation and fine bone structures.[6] Morphological changes evident on CT may predispose individuals to sinus-related diseases by narrowing ostio-meatal channels, thus obstructing mucus clearance and airflow.[7-9] Identifying these anatomical variations is crucial for surgical safety; common abnormalities include nasal septum deviation and CB.[10] A deviated septum can displace the middle turbinate, obstructing drainage and potentially causing issues on the contralateral side.[11] CB, an air-filled enlargement of the middle turbinate, is optimally detected by CT, revealing compression of the uncinate process and narrowing of the ethmoidal infundibulum, which can lead to maxillary sinus disease.[1]
The severity of rhinosinusitis is often linked to anatomical variations such as CB and a deviated septum.[10,12-14] A deviated septum frequently narrows the middle meatus, blocking drainage from the maxillary and frontal sinuses.[12] This restriction can hinder airflow, reduce oxygen pressure, and promote microbial growth, with changes in paranasal volume being associated with chronic sinusitis.[15,16] Furthermore, a deviated septum alters nasal aerodynamics, decreasing airflow on the convex side.[17] For assessing maxillary sinus capacity, 3D CT reconstruction is the most effective method for estimating volume.[18-20]
Studies outside India have compared maxillary sinus volume to age or the contralateral normal sinus in chronic rhinosinusitis (CRS) patients.[19,21] Some suggest a slight reduction in sinus capacity, while others find no significant correlation with size. Few studies have explored the link between sinus volume and anatomical variations, leading to controversial findings.[19,20,22,23] This study investigates sinonasal variations and estimates maxillary sinus volume using 3D CT, addressing gaps in research on the Indian population and the relationship between structural abnormalities and CRS.
MATERIAL AND METHODSThe study was conducted at Teerthanker Mahaveer Medical College and Research Center in Moradabad, within the Department of Radiodiagnosis, over a duration of 1.5 years. A case–control design was employed, recruiting 103 cases and 50 controls from the patient pool. Necessary approvals were obtained from the College Research Committee and the Institutional Ethical Committee to ensure compliance with ethical standards and research guidelines. During recruitment, potential participants were briefed on the study’s objectives and procedures, and written informed consent was secured from all eligible individuals or their guardians.
Based on outcomes from a similar volumetric study of the maxillary sinus,[18] the sample size was calculated using the formula n = ([Zα/2 × S.D]/E)2, where Zα/2 was the standard normal variable (1.96 for a 95% confidence interval), Standard deviation (S.D) of outcome variable was 52, and E (Allowable error) was the allowable error of 10%. This calculation yielded a required sample size of 103 cases, with an additional 50 controls. Due to recruitment constraints during the 1.5-year study period, matching the number of controls to cases was not feasible. Nevertheless, the number of controls was deemed statistically adequate based on expert consultation and the methodology applied.
The study population included patients with symptoms suggestive of chronic sinonasal illness for the case group, while controls were patients referred for CT head scans without sinonasal symptoms. Exclusion criteria included previous sinonasal surgery, sinonasal malignancy, craniofacial trauma, and unwillingness to provide informed consent, ensuring the homogeneity and relevance of the study population.
Data collection techniques and tools Technique of examinationThe study utilized a 128-slice scanner (Ingenuity CT, Philips Healthcare, Best, The Netherlands) with patients positioned supine. A scanogram was obtained, and the imaging range extended from the highest level of the frontal sinuses to the base of the maxilla, covering an anteroposterior span from the posterior sphenoid bone to the anterior outer border of the frontal bone. Scan parameters included 120 kVp, 200 mAs, a slice thickness of 1 mm, a pitch of 0.391, and a reconstruction increment of 0.5 mm overlap. Following these configurations, CT scans of the paranasal sinuses (PNS) were performed. Advanced image reconstruction techniques were used to improve diagnostic quality, employing tools such as multiplanar reformation and volume calculation algorithms to analyze the images comprehensively.
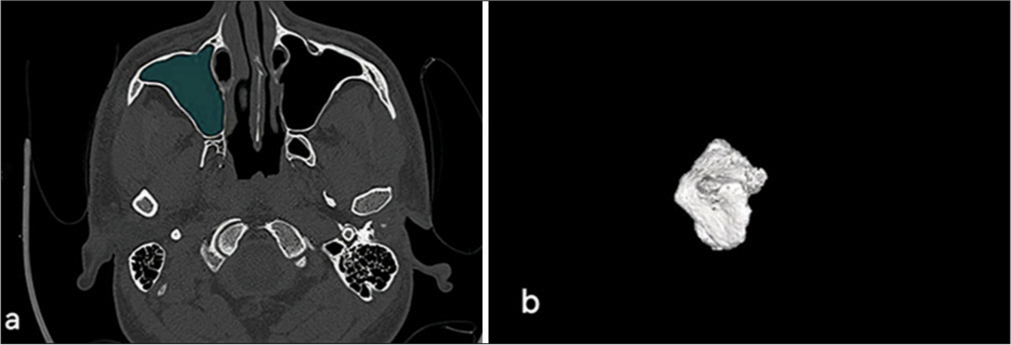
Volume calculationCT scan images from the full section series were utilized to estimate maxillary sinus volumes using Philips IntelliSpace 3D segmentation software [Figure 1a and b]. This software facilitated the creation of realistic images, provided a comprehensive anatomical understanding, and enabled precise volume calculations for each sinus.
Export to PPT
Image interpretationImages were evaluated using both bone and soft-tissue algorithms to identify various anatomical deviations, including deviated nasal septum (DNS), agger nasi cells, CB, Onodi cells, Haller cells, accessory maxillary ostia, and paradoxical middle turbinate, as well as pneumatized crista galli (wishbone). Careful examination was conducted in axial, coronal, and sagittal views to characterize these common sinonasal anatomical variants and assess mucosal thickening and opacification in the maxillary sinuses as potential indicators of sinus pathology.
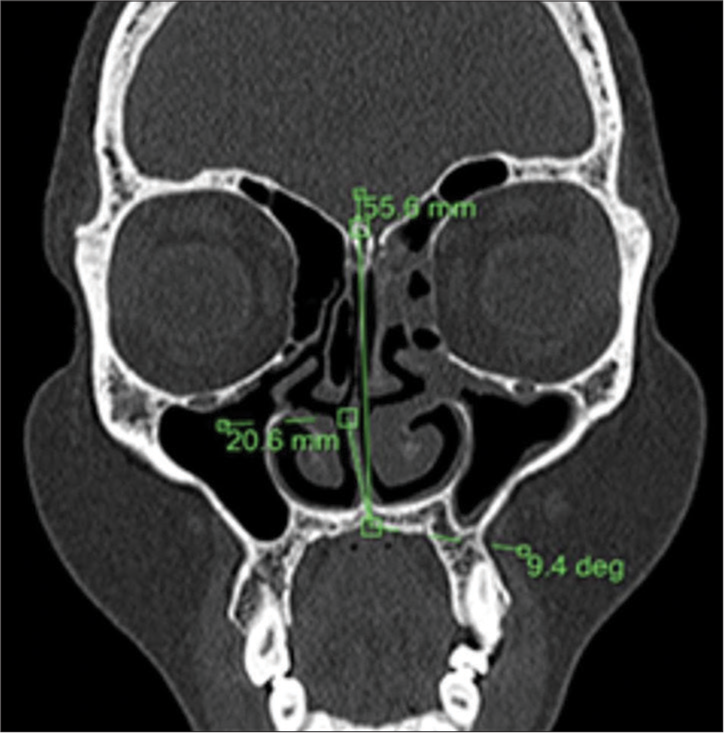
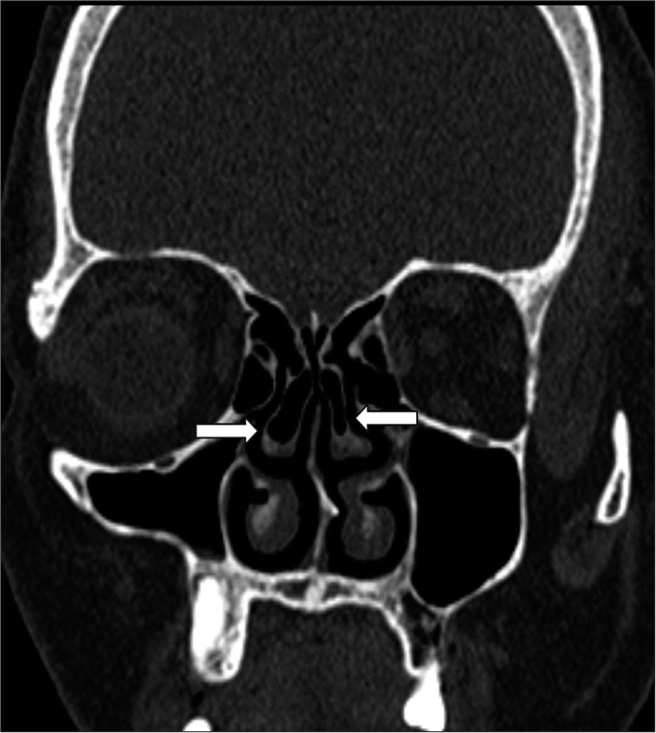
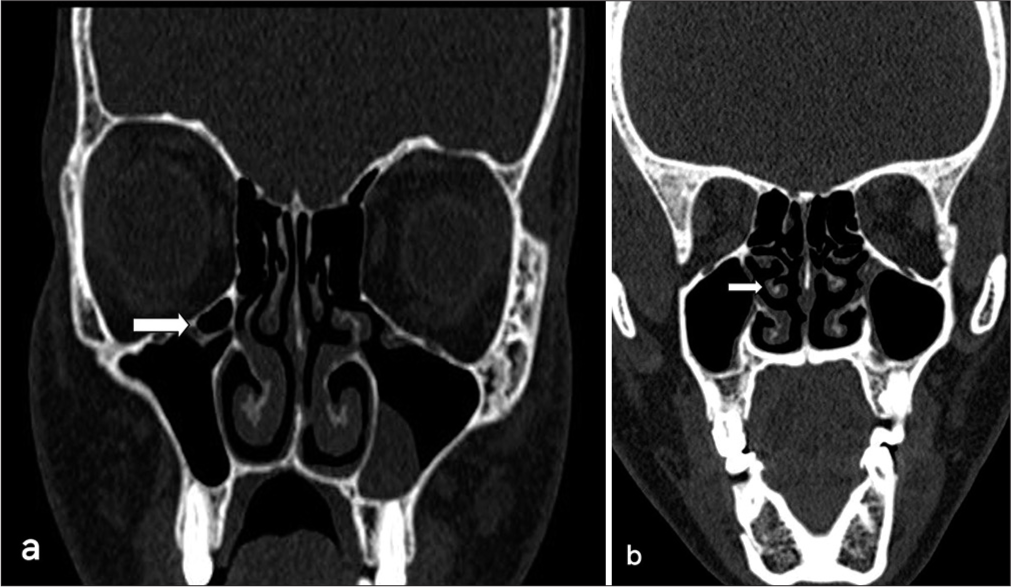
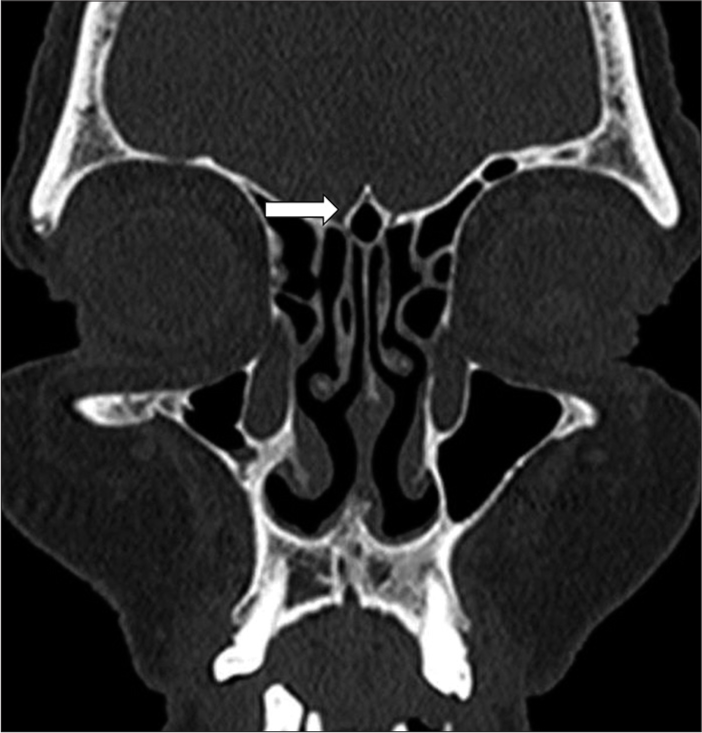
Nasal septal deviation, observed on coronal CT scans, was quantified by measuring the angle formed between a line from the crista galli to the anterior nasal spine and a tangent to the most prominent point of the septal curvature [Figure 2]. This deviation was classified as mild (5°–10°), moderate (10°–15°), and severe (>15°).[24] A concha was identified by the presence of pneumatization in the middle turbinate and was categorized as unilateral or bilateral [Figure 3].[15] Onodi cells were air cells located posterior to the sphenoid sinus, extending superolaterally, while agger nasi cells were air cells located beneath the frontal sinus and anterior to the ethmoid sinus, often positioned inferomedial to the lacrimal bone.[25] Haller cells were defined as cells that grew into the bony orbital floor, forming the roof of the maxillary sinus [Figure 4a].[9] The paradoxical middle turbinate featured a convexity facing laterally [Figure 4b], and the pneumatized crista galli (wishbone) expanded from the adjacent frontal sinus [Figure 5].
Export to PPT
Export to PPT
Export to PPT
Export to PPT
Data collection and analysis were conducted by residents (A.T., S.J., A.P.) under the supervision of faculty members (A.M., S.C.), with a CT technician assisting in volumetric analysis using specialized software to ensure accuracy.
Statistical analysisData were analyzed using Microsoft Excel (Microsoft Corporation, NY, USA) and version 25.0 of the Statistical Program for the Social Sciences (SPSS). To ensure robust analysis, patients were profiled based on various demographic and etiological factors. For quantitative variables, normality was assessed, with parametric data analyzed using Student’s t-test to compare means between groups, presented as mean ± standard deviation. For non-parametric data, the Wilcoxon– Mann–Whitney U-Test was utilized to compare independent samples. Qualitative variables were analyzed using the Chi-square test or Fisher’s exact test, with results expressed as percentages. Box-and-whisker plots were employed to visualize data distribution and identify potential outliers. Receiver operating characteristic curves were generated to determine the optimal cutoff point for nasal septal deviation as a diagnostic criterion for CRS, with sensitivity, specificity, and diagnostic accuracy assessed from these curves. The significance level was set at P < 0.05 for all tests.
RESULTSOut of 103 patients referred for CT scans of the PNSs and 50 controls without evidence of inflammatory sinus disease, data were collected, tabulated, and analyzed using SPSS version 25.0.
The age distribution of cases and controls indicates that the majority of both groups were young adults under 40 years, with cases ranging from 6 to 83 years and controls from 5 to 67 years. The mean age was 30.86 ± 15.36 years for controls and 30.55 ± 16.35 years for cases. Gender distribution revealed that among the 103 cases, 57 were male and 46 were female, resulting in a male-to-female ratio of 1.23:1, while females constituted 60% of the controls.
Symptomatology analysis showed that headache was the most commonly reported symptom (86%), followed closely by nasal discharge (84%), with facial pain reported in only 20.4% of cases.
Maxillary sinusitis was present in all cases, while frontal sinusitis was noted in 24.3%, ethmoid sinusitis in 14.6%, and sphenoid sinusitis in 2.9%, with some patients exhibiting them concurrently [Table 1].
Table 1: Distribution of sinuses involvement among cases.
Site of disease Number of cases Percentage Maxillary Sinus 103 100 Frontal Sinus 25 24.3 Ethmoid Sinus 15 14.6 Sphenoid Sinus 3 2.9Anatomical variations were prevalent, with DNS observed in 71% of cases compared to 62% of controls. Notably, agger nasi cells were present in 51.5% of cases but only in 8% of controls [Table 2].
Table 2: Prevalence of sinonasal anatomical variants in cases and controls.
Variation Cases (%) Controls (%) Deviated nasal septum 71.0 62.0 Agger nasi cells 51.5 8.0 Concha bullosa 31.1 14.0 Onodi cells 10.7 0.0 Haller cells 4.8 0.0 Accessory maxillary ostia 4.8 0.0 Pneumatized crista galli (Wishbone) 2.9 0.0 Paradoxical middle turbinate 1.9 0.0Types of DNS varied, with the left-sided deviation being slightly more common among cases. Severity analysis indicated that most cases had a severe degree of nasal septal deviation (35%), whereas controls predominantly had mild deviations. The degree of nasal septum deviation was significantly higher in cases (10.84°) than in controls (5.55°), with P < 0.001 [Table 3]. The optimal cutoff value for the DNS angle predicting maxillary sinusitis was 12.7°, demonstrating a sensitivity of 53% and specificity of 94%, yielding an Area Under the Receiver Operating Characteristic of 0.713 [Figure 6].
Table 3: Mean nasal septum deviation (degrees) in cases and controls.
Measurement Cases Controls Wilcoxon-Mann-Whitney U-test Mean (SD) 10.84 (7.87) 5.55 (5.02) 3674.500 Median (IQR) 12.9 (0–17.9) 6.6 (0–9) P–value <0.001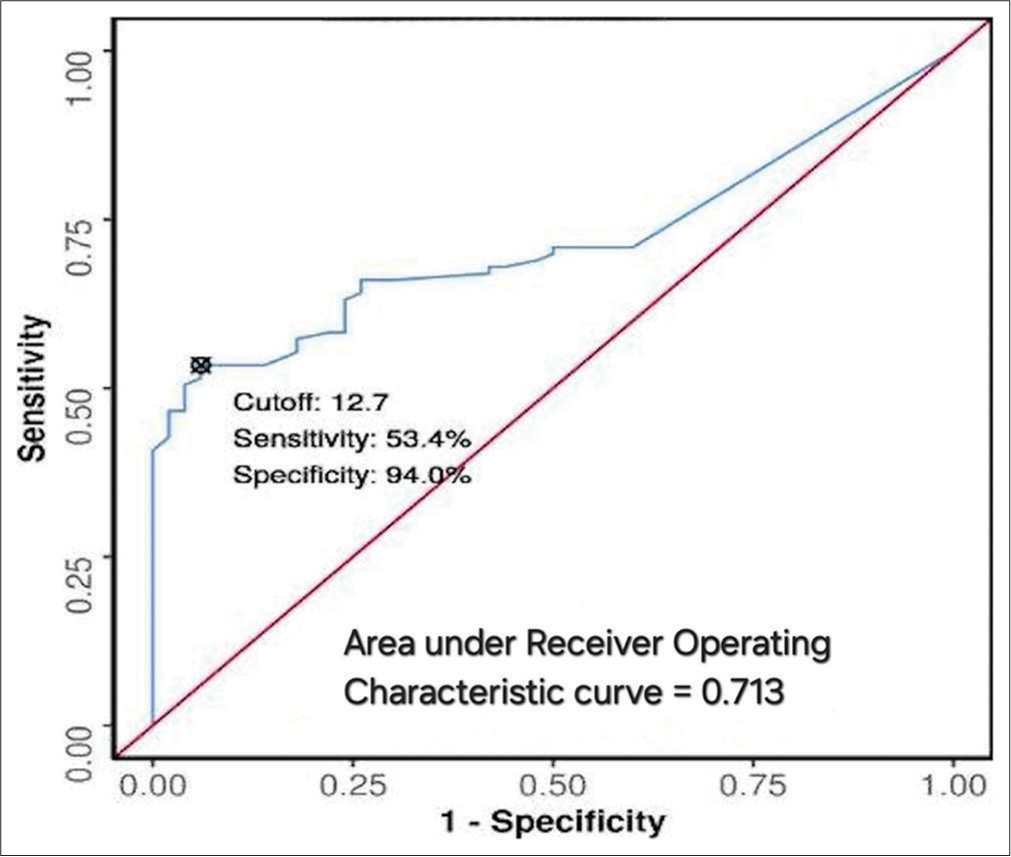
Export to PPT
Agger nasi cells were bilaterally present in 47.6% of cases but were mostly absent or unilateral in controls. CB was significantly more prevalent in cases (31.1%) compared to controls (14%) (P < 0.05). A significant correlation was observed between the presence of CB and contralateral DNS (P = 0.02).
The distribution of Onodi cells showed no significant difference between cases and controls (P = 0.162). In the cases, bilateral and right-sided Onodi cells were more frequently observed, while the left-sided occurrences were less common. In addition, no Onodi cells were identified in the control group.
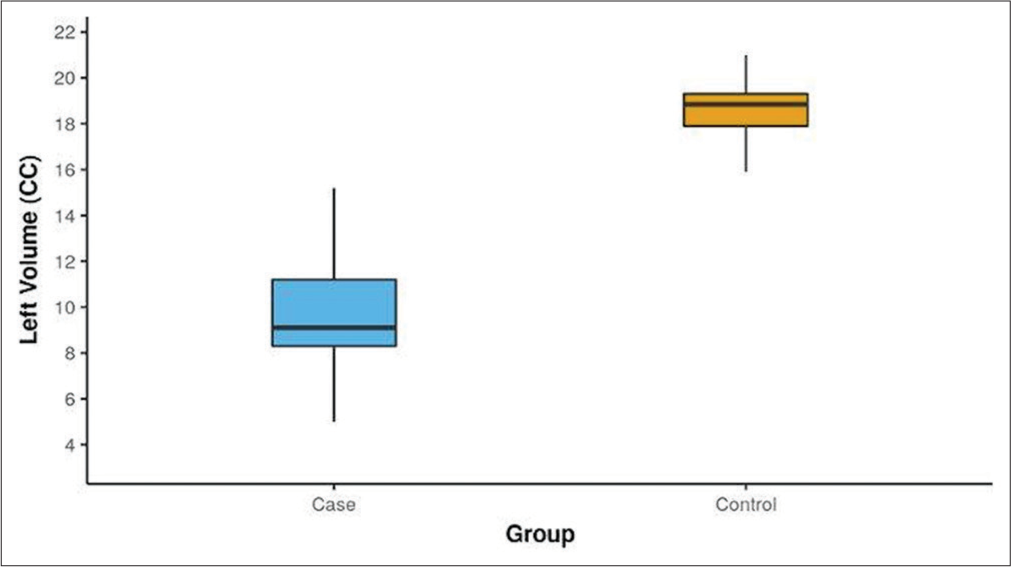
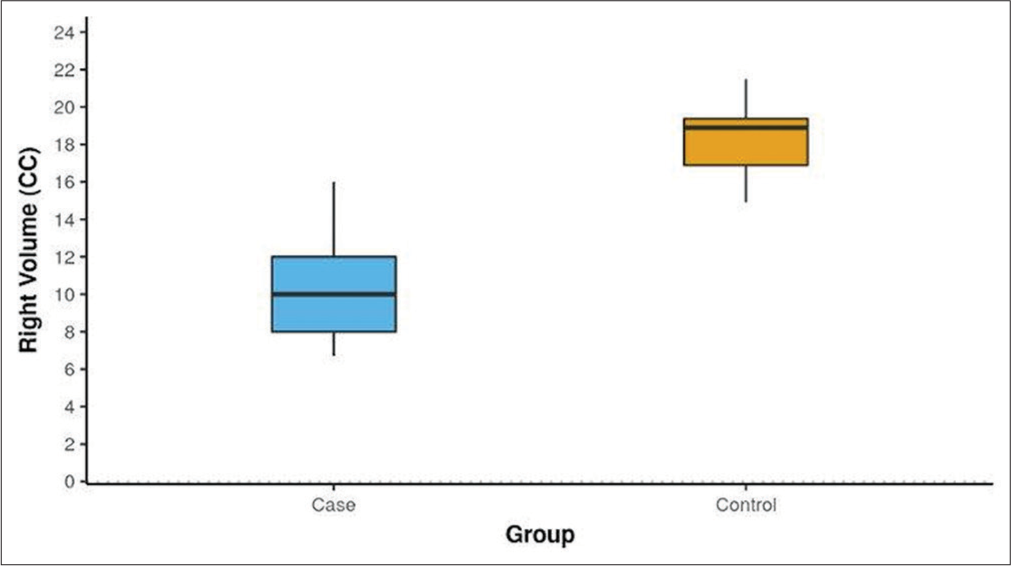
The volumetric analysis indicated that the mean maxillary sinus volumes were significantly lower in cases compared to controls. The left-sided volumes averaged 9.69 cc in cases versus 18.57 cc in controls (P < 0.001) [Figure 7]. A similar volume difference was observed on the right side, where cases averaged 10.23 cc compared to 18.46 cc in controls (P < 0.001) [Figure 8]. In addition, male cases had a higher mean maxillary sinus volume than female cases, with a statistically significant difference noted on the left side. Overall, various anatomical variants, such as the presence of agger nasi cells and CB, were significantly more common in cases compared to controls, highlighting their potential role in the etiology of sinusitis.
Export to PPT
Export to PPT
DISCUSSIONPNSs play a crucial role in reducing skull weight, humidifying air, and enhancing vocal resonance as nasal cavities expand, reshaping surrounding bones.[26] Given their complex anatomy and variability, understanding sinus architecture is vital for medical professionals, particularly in functional ESS.[27] This study demonstrates significant associations between various anatomical variants and maxillary sinusitis, notably the prevalence of DNS and reduced maxillary sinus volume. While conventional radiography offers limited insights, CT imaging provides detailed views, making it the preferred modality for assessing the PNSs. The integration of endoscopy and CT imaging has become the standard for evaluating PNSs, surpassing X-ray imaging.[28,29]
In CRS, reduced maxillary sinus volume indicates potential underlying pathophysiological changes exacerbated by chronic inflammation, impacting surrounding bone structure and worsening disease severity. This hypo-pneumatization complicates otolaryngology and dental surgeries, requiring precise preoperative planning to optimize outcomes. Evaluating maxillary sinus volume through 3D CT scans provides critical information for surgical decision-making, aiding in managing developmental abnormalities and ensuring effective treatment strategies tailored to individual patient needs.
Age and sex distributionYoung individuals under 40 years comprised the majority of both cases and controls in this study. Controls ranged in age from 5 to 67 years, with a mean age of 30.86 ± 15.36 years, while cases ranged from 6 to 83 years, with a mean age of 30.55 ± 16.35 years. There was a slight male predominance among cases, consistent with earlier studies by Suresh et al., Emirzeoglu et al., and Thimmappa et al.[21,30,31] However, some investigations reported a modest female predominance, similar to the distribution among controls in this study. The male-to-female ratio among cases was 1.23:1, which aligns with previous findings.
Anatomical variationsSurgical treatment for sinonasal disorders has advanced significantly in recent decades. Traditional external procedures and prolonged hospital stays have been supplanted by minimally invasive techniques like ESS. ESS involves opening or enlarging obstructed sinus openings to restore normal airflow while preserving adjacent healthy mucosa and removing diseased tissue. The literature consistently reports favorable outcomes with ESS.[32,33] However, if surgical issues arise, they can pose significant risks and potential damage to nearby structures, such as the orbit and skull base, due to their close proximity.
In our analysis, the most prevalent anatomical variant in both cases and controls was DNS, consistent with earlier studies by Biswas et al.,[9] Pradeep et al.,[34] and Turna et al.[35] Agger nasi cells were the second most common, found in 51.5% of cases and 8.0% of controls, aligning with prior literature by Thimmappa et al.,[31] Lingaiah et al.,[27] and Pradeep et al.[34] CB was present in 31.1% of cases and 14.0% of controls, corroborating studies by Thimmappa et al. and Kucybała et al.[28,31]
In our study, the prevalence of Onodi cells in cases was found to be 10.7%, with none observed in the control group. This finding aligns with the previously reported prevalence range of 8-14%.[8,35] Left-sided Onodi cells were less common, while right-sided and bilateral occurrences were observed equally in cases. No significant difference was noted between cases and controls regarding the presence of Onodi cells, suggesting their limited clinical relevance in the development of chronic rhinosinusitis. However, our results contrasted with those of Ahanthem et al., who reported a higher prevalence of Onodi cells, attributing this discrepancy to their smaller sample size. [36]
Haller cells were found in 4.9% of cases, but none in controls, reflecting earlier studies by Gupta et al.,[37] Lingaiah et al.,[27] and Biswas et al.[9] Accessory maxillary ostia were present in 4.9% of cases, lower than findings by Serindere et al.[6] The paradoxical middle turbinate, which exacerbates middle meatus constriction, was found in 1.9% of cases, consistent with Dakshina et al.[38] Pneumatized crista galli was present in 2.9% of cases, aligning with Turna et al.[35]
DNS and conchaAny deviation or change in the nasal septum’s contour observed on coronal CT scans was labeled as DNS, categorized into mild (5°–10°), moderate (10°–15°), and severe (>15°).[24] Our research indicates a correlation between DNS and CB on the opposite side, consistent with findings by Kucybała et al.,[28] though Anazy[15] found no such link. The association between CB and DNS remains unclear, with theories suggesting a constant nasal air channel between the nasal septum and concha, causing the septum to deflect away from the concha due to factors beyond pressure.[8] Our findings suggest that the septum separates from the concha after its initial development, allowing the concha to enlarge to fill the expanded air channel.
Concha and inflammatory PNS diseaseConflicting data exist regarding the significance of concha in the development of sinusitis. While some authors argue that concha is not involved in sinusitis,[1,3,15] our investigation indicates a direct connection between concha presence and inflammatory sinus illness (P < 0.05), validating findings by Lakshmi et al.[39] This link may result from concha-induced compression on the uncinate process, leading to infundibular and middle meatal blockage or constriction.
DNS and inflammatory PNS diseaseVincent and Gendeh.[1] found that mild-to-moderate DNS alone does not predispose a person to inflammatory sinus illness. However, Javadrashid et al.[12] demonstrated that severe DNS is a significant risk factor for sinusitis. Our study also revealed a significant association (P < 0.05) between DNS and sinusitis, with higher degrees of DNS correlating with maxillary sinusitis. Severe maxillary sinusitis is linked to larger nasal septum deviations due to mechanical obstruction, impaired ciliary activity, and defective mucociliary transport, contributing to sinusitis pathophysiology.[40] In addition, a hypothesis suggests that craniofacial morphology in DNS patients might differ from those without variation, potentially representing a new risk factor for sinusitis.[41]
Cutoff point of DNS angleThe study calculated a threshold value for nasal septal deviation angle to distinguish between cases and controls without maxillary inflammatory sinus disease, determining 12.7° as the optimal DNS angle cutoff value, with a sensitivity of 53% and specificity of 94% for maxillary sinusitis onset. Javadrashid et al.[12] established a lower cutoff value of 3.5° for discriminating inflammatory sinus disease presence, possibly due to ethnic differences and smaller sample size. Nonetheless, our findings align with Orlandi meta-analysis,[42] recommending a septal deviation angle of 10° to distinguish between positive and negative sinusitis cases.
Volumetric analysisThe PNS, being the largest cavity in the human skull, highlights the significance of its airspace. Thus, cavity volume remains the primary criterion for evaluating PNS anomalies, aiding in the objective definition of hypoplasia or sinus atelectasis. Various techniques have been employed to obtain volumetric data on the PNSs, such as quantifying volume using three-dimensional measurements or employing a square grid test procedure with different point densities.[21,43] While the previous studies utilized simple formulae for volume estimation, current research suggests a more meticulous approach, manually dividing each maxillary sinus slice-by-slice and reconstructing a 3D model to calculate bilateral volumes, as adopted in this study.[18,20] Although time-consuming, this method consistently yields accurate results, enhancing diagnostic precision.
Reports indicate that the maxillary sinus has the highest capacity, ranging from 8.6 to 24.9 cc.[44,45] In our study, the average maxillary sinus volume in cases closely resembled that found by Omer et al., possibly due to similar age ranges of participants.[20] However, compared to our controls, the mean volume of the maxillary sinus in healthy patients was lower in studies by Emirzeoglu et al. and Sahlstrand-Johnson et al., which may be attributed to racial features and the precision of volume assessment in our investigation.[30,46]
Gender differences in PNS diameters have been noted, with males typically having larger sinuses than females.[45,47] While some studies found no significant gender differences, others reported larger sinuses in males, consistent with our finding of larger maxillary sinus volumes in men, especially on the left side.[21,44] Recent research comparing volumes of diseased PNSs with unaffected controls yielded inconclusive results, but studies on CRS patients indicated smaller sinuses compared to the normal population, consistent with our findings of smaller maxillary sinus volumes in CRS patients.[16,20,44]
Limitations of this research include the modest sample size and single-center design, which may reduce the statistical significance of our findings. In addition, the homogeneous Northern Indian patient population limits the generalizability of our results to other ethnic groups. The complexity of calculating maxillary sinus volume using 3D CT techniques in high-volume settings presents challenges; radiologists require significant practice to achieve accuracy, potentially delaying clinical integration. However, once mastered, these techniques hold the promise of improving patient outcomes and effectively guiding clinical decisions.
While our study focused on anatomical variations and their association with CRS, it did not directly examine environmental factors such as dust, air pollution, and seasonal variations, which can affect the prevalence and severity of sinonasal diseases. Future studies should include these factors for a more comprehensive understanding of sinonasal health in the context of CRS.
CONCLUSIONOur study employed a precise method to calculate maxillary sinus volume, revealing reductions associated with CRS and highlighting gender disparities. The prevalence of a DNS was noted, with greater deviation angles correlating with inflammatory maxillary sinus conditions. Notably, a deviation angle exceeding 12.7° served as a predictive marker for disease onset. In addition, the presence of CB and agger nasi cells significantly influenced disease development. These findings underscore the critical importance of thorough anatomical evaluation in clinical practice, particularly in understanding and managing CRS and its associated anatomical variations.
留言 (0)