Leprosy reactions are acute inflammatory episodes that occur during infection with Mycobacterium leprae.1 These reactions pose a high risk to the infected individuals, resulting in physical deformity followed by nerve damage. Leprosy reactions are classified into two types: Type-I or reversal reactions and Type-II or commonly presenting as erythema nodosum leprosum (ENL).2 Both types of reactions may occur in leprosy patients before and during treatment, but may also occur after the treatment is completed.3 Type-I reactions occur due to an increase in cell-mediated immunity which results in nerve inflammation at the point of mycobacterial infection. The skin lesions become tender and nerve involvement produces pain, abnormal sensation and functional impairment.4 Prompt intervention is required to prevent permanent nerve impairment since the expected rate of recovery for nerve function is 60–70%.5 Type-II reactions occur in multibacillary patients and are immune complex mediated. Patients with Type-II reactions develop tender, erythematous nodules on the face, trunk or legs.6 The treatment regimen for ENL is quite long and delayed treatment is an important cause of neuropathy and consequent disability.7 Thus, timely management of leprosy reactions is a big challenge and there is a need to understand the underlying complex immunological processes and gene expression.
Transcriptome profiling can be viewed as a vital approach in disseminating valuable information related to gene expression and associated host response to infection, assessing disease severity and discovering novel gene candidates for diagnosis and prognosis. Due to differences in experimental design and multiple hypotheses in individual studies, these differentially expressed genes (DEGs) should be interpreted accordingly.8 However, their combined analysis can unravel some common pathological mechanisms. In this study, the meta-analysis of individual datasets paved the way to integrate gene sets from multiple individual studies and work out a common list of DEGs for further biological investigation.9 In this study, leprosy reaction–specific datasets were analysed and integrated using meta-analysis to identify DEGs that could be considered as candidate biomarkers in leprosy pathogenesis. Further, the list of DEGs was subject to pathway analysis revealing vital processes and their likely association.
Type-I or reversal reaction represents an elevation in cellular immune response which progresses towards the tuberculoid pole of the disease. This type of reaction is common in borderline forms of leprosy and does not occur in the polar forms. The clinical expression of Type-I or reversal reaction includes an increase in the levels of activated lymphocytes which causes the existing skin lesions to become erythematous and oedematous. If it is very severe, then ulceration may occur at times. Peripheral nerves become enlarged and tender due to acute neuritis. It results in rapid loss of sensory and motor functions. The duration of the reversal reaction is often several weeks, but it may extend for many months.
Type-II reaction can be chronic and may occur in half of the patients with lepromatous or borderline lepromatous type of leprosy during the disease. The entire immunology of ENL is not yet completely understood but the condition is aggravated by immune complexes formed with Mycobacterium leprae antigens. The clinical expression includes neuritis, iridocyclitis, and painful skin lesions which are erythematous papules and nodules. Chronic ENL is associated with amyloidosis and glomerulonephritis and may cause mortality from renal insufficiency.
MethodsIn the present study, we selected four high throughput sequencing and microarray datasets from a whole blood sample and skin biopsy of patients with adverse leprosy reactions from the GEO (Gene Expression Omnibus) database10 and investigated clinical biomarker candidates for early diagnosis and prognosis of immune reactions of leprosy based on functional and molecular pathway analyses of DEGs. We selected four datasets of whole blood samples from leprosy patients with immune reactions, GSE16844, GSE125943, GSE129033, and GSE74481, using the following keywords: ‘reversal reaction’, ‘leprosy’, ‘Homo sapiens,’ and ‘erythema nodosum leprosum’. These datasets were downloaded from the GEO database. The search results were examined and datasets were excluded if they consisted of (i) only the pathogen gene expression, (ii) only a single sample that does not allow comparison, (iii) treatment by any compound, and (iv) studies targeting only non-coding RNAs. Raw data were preferentially downloaded for the selected studies wherever possible; otherwise, the gene expression matrix was used. The datasets were included when (i) they consist of only host gene expression, (ii) they contain samples from either whole blood or skin biopsy and (iii) they target the mRNA. No studies were discarded due to differences in the sequencing platform, publication or experiment date, or unavailability of raw data as it would have further lowered the number of datasets available. A summary of the individual datasets is shown in Table 1. The workflow of the analysis is depicted in Figure 1.
Table 1: Description of datasets included in this study.
GEO Accession (Ref) Organisms Sample type Sample group (n) Platform Comparison Design of experiment/Key objective GSE1684413 Homo sapiens Skin biopsy LL (7), ENL (6) Affymetrix Human Genome U133 Plus 2.0 Array LL vs ENL Mechanism of neutrophil recruitment in skin lesions of leprosy is investigated GSE12594314 Host- Homo sapiens, Pathogen-Mycobacterium leprae Skin biopsy LL (9), TT (6), RR (9) Illumina HiSeq 2000 LL vs RR Dual RNA- sequencing was performed on the total RNA from 24 leprosy skin biopsy specimens GSE12903315 Homo sapiens PBMC ENL (4), RR (5), HC (3) Illumina HiSeq 2500 HC vs ENL; HC vs RR RNA sequencing of PBMC enriched for myeloid derived suppressor cells from leprosy patients and HCs GSE7448116 Homo sapiens Skin biopsy TT (10), BT (10), BB (10), BL (10), LL (4), RR (14), ENL (9), HC (9) Agilent SurePrint Human GE 8x60K Microarray HC vs ENL; HC vs RR; LL vs RR; LL vs ENL Samples from 67 leprosy patients and nine HC individuals were compared for differentially expressed genes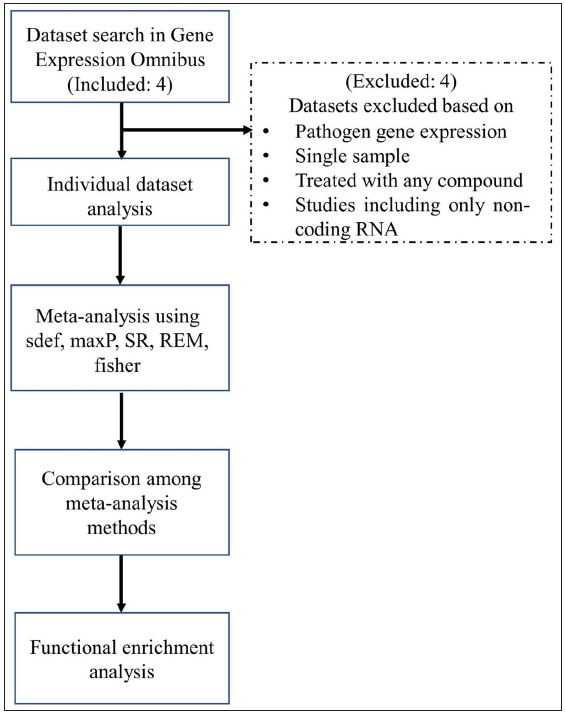
Export to PPT
Export to PPT
Identification of upregulated/downregulated differentially expressed genes from individual datasetsUpregulated or downregulated DEGs in the selected datasets were identified using the DESeq2 package11 in RStudio (Version 1.4.1106). Common up- or downregulated DEGs in the datasets were extracted. The cut-off criteria were set as – P-value < 0.05 and standardised |log2FC| > 1. Duplicate genes (mapped by Entrezid) were filtered based on the smallest mean expression across all samples in different studies. The resulting P-values were adjusted according to Benjamini and Hochberg’s (BH) method.12 Finally, all the ribosomal protein-coding genes were excluded from the expression matrix of genes.
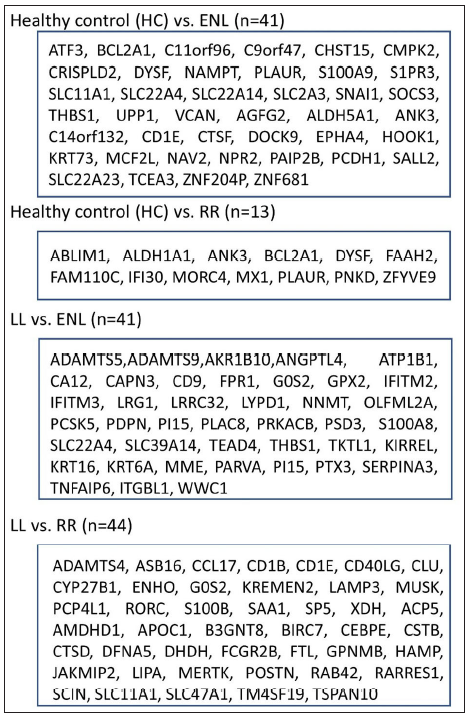
Common differentially expressed genes from independent studies by ratio association methodTo find common DEGs among datasets for related comparisons, a frequentist and Bayesian association ratio analysis was performed. The association of genes with similar comparisons is tested by a ratio measuring the relative increase of genes in common among different studies concerning the number of genes expected by chance, i.e., independence. The statistical significance of this ratio is assessed by Monte Carlo permutation which is a model devised in the Bayesian framework. Four categories were created including different studies with similar comparisons based on clinical features to find common DEGs. The following comparisons were created: (i) Healthy control (HC) vs ENL, (ii) HC vs Reversal reaction (RR), (iii) Lepromatous (LL) vs ENL, and (iv) LL vs RR. For each of these comparisons, the ratio of observed versus expected probability of occurrence of genes across different studies was computed based on frequentist and Bayesian methods as proposed in the sdef R package.17 We have selected HC vs ENL and HC vs RR comparisons to reveal any genes that have been expressed in HCs but may show downregulation in their expression during leprosy progression and further show deviated expression during adverse reactions. Hence, the basal level of expression can be determined.
Meta-analysisAs proposed by the developers of the sdef R package, it aims for fewer false positives when compared to other methods. Thus, a comparative approach was incorporated to compare genes with other standard meta-analysis methods with those obtained from the sdef method. MetaDE R package18 was used for differential gene expression. MetaDE package incorporates major meta-analysis methods such as Fisher, maximum P-value (maxP), the sum of ranks (SR), rth ordered P-value (roP), and random effects model (REM) which is based on effect sizes and are tested on the datasets used in this study. MetaDE also provides options for gene matching across studies and gene filtering before meta-analysis. In this study, P-value-based methods such as maxP, SR, and roP were used. Combining P-values from different studies has two major advantages: (i) simplicity and extensibility to different outcome variables and (ii) when the outcome variable is not binary then effect size may not be computed; however, P-value association among studies can still be calculated. In REM, the estimated effect size in each study is assumed to come from an underlying true effect size which also includes measurement errors like experimental or sampling error. Further, the studies also contain a random effect that can incorporate unknown cross-study heterogeneities in the model.19
Functional enrichment analysis of differentially expressed genesFunctional analysis of DEGs was carried out using the Gene Ontology (GO) database.20 GO and Kyoto Encyclopedia of Genes and Genomes (KEGG) analyses were performed using the Database for Annotation Visualisation and Integrated Discovery (DAVID).21 The cut-off criteria were set as – adjusted P-value < 0.1 and false discovery rate (FDR) < 0.001. Genes common from each comparison category were tested for enriched function from org.Hs.eg.db v 3.12.0 R package. To further explore the GO of selected genes, R package cluster profiler22 was used to explore the functions among genes of interest with a threshold value of adjusted P-value < 0.1. GO annotation contains three subcategories – biological process (BP), cellular component (CC), and molecular function (MF) – which identify the biological properties of all gene sets for all organisms.
Assessment of gene listsThe standardised log2FC, adjusted P-value and False Discovery Rate (FDR) is a vital set of metrics for genes expressed in studies. Thus, the genes found common from similar comparison categories from different studies were tabulated with their median log2FC (from sdef), adjusted P-value FDR, and tau2. The DEGs tabulated for HC vs ENL and LL vs ENL are shown in the main text [Tables 2 and 3] while for HC vs RR and LL vs RR are shown in Supplementary materials [Supplementary Table 1 & Supplementary Table 2].
Table 2: Genes considered as significant by all meta-analysis methods in HC vs ENL comparison. Cut-off: |log2FC| > 3 and FDR < 0.001.
Entrez Id Gene symbol Log2FC Adjusted P-value FDR Tau2 Description 3268 AGFG2 -3.03034 2.4E-05 0.0001 0.00 ArfGAP with FG repeats 2 7915 ALDH5A1 -3.97772 4.42E-07 0.0001 0.00 aldehyde dehydrogenase 5 family member A1 288 ANK3 -4.50756 8.6E-05 0.0001 0.00 ankyrin 3 467 ATF3 3.40186 4.83E-05 0.0001 0.00 activating transcription factor 3 597 BCL2A1 3.837651 5.83E-05 0.0001 0.00 BCL2-related protein A1 387763 C11orf96 6.544236 0.001494 0.0001 0.01 chromosome 11 open reading frame 96 256967 C14orf132 -4.95844 0.000537 0.0001 0.01 chromosome 14 open reading frame 132 286223 C9orf47 8.481028 0.000145 0.0001 0.01 chromosome 9 open reading frame 47 913 CD1E -5.39326 0.000294 0.0001 0.01 CD1e molecule 51363 CHST15 3.29828 9.93E-05 0.0001 0.01 carbohydrate sulphotransferase 15 129607 CMPK2 3.400084 0.000283 0.0001 0.00 cytidine/uridine monophosphate kinase 2 83716 CRISPLD2 3.035294 8.34E-05 0.0006 0.01 cysteine-rich secretory protein LCCL domain containing 2 8722 CTSF -3.70033 0.000742 0.0001 0.01 cathepsin F 23348 DOCK9 -3.03102 0.001262 0.0001 0.00 dedicator of cytokinesis 9 8291 DYSF 3.740919 0.000209 0.0001 0.00 dysferlin 2043 EPHA4 -3.16614 0.000821 0.0001 0.01 EPH receptor A4 51361 HOOK1 -3.75889 0.000183 0.0001 0.01 hook microtubule tethering protein 1 319101 KRT73 -3.8575 0.001392 0.0001 0.00 keratin 73 23263 MCF2L -4.78318 0.000257 0.0001 0.01 MCF2 cell line–derived transforming sequence like 10135 NAMPT 3.840097 5.96E-06 0.0001 0.01 nicotinamide phosphoribosyltransferase 89797 NAV2 -3.16788 0.000127 0.0001 0.00 neuron navigator 2 4882 NPR2 -3.46004 0.000107 0.0001 0.01 natriuretic peptide receptor 2 400961 PAIP2B -3.19456 6.82E-05 0.0001 0.01 poly(A) binding protein interacting protein 2B 5097 PCDH1 -5.97344 7.63E-05 0.0001 0.01 protocadherin 1 5329 PLAUR 4.384652 8.6E-06 0.0001 0.00 plasminogen activator, urokinase receptor 6280 S100A9 3.605774 1.36E-05 0.0001 0.00 S100 calcium-binding protein A9 1903 S1PR3 5.83001 8.21E-05 0.0005 0.00 sphingosine-1-phosphate receptor 3 6297 SALL2 -4.16351 0.000644 0.0001 0.00 Spalt-like transcription factor 2 6556 SLC11A1 4.620372 2.81E-06 0.0001 0.01 solute carrier family 11 member 1 63027 SLC22A23 -3.83493 4.11E-05 0.0006 0.01 solute carrier family 22 member 23 6583 SLC22A4 3.768588 4.36E-06 0.0006 0.01 solute carrier family 22 member 4 144195 SLC2A14 5.311251 0.000118 0.0006 0.01 solute carrier family 2 member 14 6515 SLC2A3 4.481587 6.05E-06 0.0006 0.01 solute carrier family 2 member 3 6615 SNAI1 5.011986 0.001273 0.0001 0.00 snail family transcriptional repressor 1 9021 SOCS3 4.515784 3.13E-05 0.0001 0.00 suppressor of cytokine signalling 3 6920 TCEA3 -3.70372 4.15E-05 0.0001 0.00 transcription elongation factor A3 7057 THBS1 3.819743 5.45E-07 0.0001 0.01 thrombospondin 1 7378 UPP1 3.253603 0.000253 0.0001 0.01 uridine phosphorylase 1 1462 VCAN 3.450314 0.000364 0.0001 0.01 versican 7754 ZNF204P -4.23346 0.000134 0.0001 0.01 zinc finger protein 204, pseudogene 148213 ZNF681 -3.52729 0.000121 0.0001 0.01 zinc finger protein 681Table 3: Genes found to be common between two studies included in the meta-analysis of genes expressed between LL vs ENL comparison. Cut-off: |log2FC| > 2 and FDR < 0.001.
Entrez ID Gene Symbol Log2FC Adjusted P-value FDR Tau2 Description 11096 ADAMTS5 −2.49503 0.000030995 0.0001 0.00 ADAM metallopeptidase with thrombospondin type 1 motif 5 56999 ADAMTS9 −3.25833 0.000185 0.0001 0.00 ADAM metallopeptidase with thrombospondin type 1 motif 9 57016 AKR1B10 −4.27945 0.000005835 0.0001 0.00 Aldo-keto reductase family 1-member B10 51129 ANGPTL4 −2.11036 1.9375E-06 0.0001 0.01 Angiopoietin-like 4 481 ATP1B1 2.249928 0.00020495 0.0001 0.01 ATPase Na+/K+ transporting subunit beta 1 771 CA12 −2.25835 0.000131 0.0001 0.00 carbonic anhydrase 12 825 CAPN3 2.138636 0.000489175 0.0001 0.00 calpain 3 928 CD9 2.105496 0.00034002 0.0001 0.00 CD9 molecule 2357 FPR1 −3.68784 0.0009527 0.0001 0.00 formyl peptide receptor 1 50486 G0S2 −2.10941 0.000212861 0.0001 0.19 G0/G1 switch 2 2877 GPX2 −2.65114 0.0010581 0.0001 0.18 glutathione peroxidase 2 10581 IFITM2 −2.35419 0.000326705 0.0006 0.00 interferon–induced transmembrane protein 2 10410 IFITM3 −2.49395 0.00370598 0.0006 0.00 Interferon-induced transmembrane protein 3 9358 ITGBL1 3.842573 0.00110255 0.0001 0.00 integrin subunit beta like 1 55243 KIRREL −4.18249 0.0000497 0.0001 0.00 kin of IRRE like 3868 KRT16 −3.65565 9.10005E-06 0.0002 0.00 keratin 16 3853 KRT6A −4.8273 1.59427E-06 0.0003 0.00 keratin 6A 116844 LRG1 −2.48456 0.00018025 0.0001 0.00 Leucine-rich alpha-2-glycoprotein 1 2615 LRRC32 −2.50847 0.0004025 0.0001 0.00 leucine-rich repeat containing 32 116372 LYPD1 −2.25438 0.00031155 0.0001 0.00 LY6/PLAUR domain containing 1 4311 MME −3.22151 0.000918 0.0001 0.00 membrane metalloendopeptidase 4837 NNMT −2.81435 0.000094125 0.0001 0.00 nicotinamide N-methyltransferase 169611 OLFML2A 2.29638 0.00023675 0.0001 0.00 Olfactomedin-like 2A 55742 PARVA −3.0682 0.00020055 0.0001 0.00 parvin alpha 5125 PCSK5 −2.64075 0.00007895 0.0001 0.00 proprotein convertase subtilisin/kexin type 5 10630 PDPN −2.79629 1.47685E-05 0.0001 0.00 podoplanin 51050 PI15 −3.29239 0.00003225 0.0001 0.00 peptidase inhibitor 15 51316 PLAC8 −2.53294 0.0003115 0.0001 0.00 placenta specific 8 5567 PRKACB 2.030238 0.0025442 0.0001 0.00 protein kinase cAMP–activated catalytic subunit beta 23362 PSD3 2.194707 0.000054475 0.0001 0.00 pleckstrin and Sec7 domain containing protein 3 5806 PTX3 −3.69717 0.000009125 0.0001 0.00 pentraxin 3 7837 PXDN −2.80582 2.14699E-05 0.0001 0.00 peroxidasin 6279 S100A8 −2.91759 5.90029E-06 0.0001 0.00 S100 calcium-binding protein A8 12 SERPINA3 −3.8388 0.0001885 0.0001 0.00 serpin family A member 3 6583 SLC22A4 −2.0933 0.00009863 0.0008 0.00 solute carrier family 22 member 4 23516 SLC39A14 −2.49318 0.000368546 0.0008 0.00 solute carrier family 39 member 14 7004 TEAD4 −2.86874 0.0002165 0.0001 0.09 TEA domain transcription factor 4 7057 THBS1 −2.07077 0.00327135 0.0001 0.09 thrombospondin 1 8277 TKTL1 −2.14863 0.00009865 0.0001 0.00 transketolase like 1 7130 TNFAIP6 −3.38789 0.000175003 0.0001 0.00 TNF alpha–induced protein 6 23286 WWC1 −4.25724 0.00044245 0.0001 0.00 WW and C2 domain containing protein 1 Results Dataset SearchA systematic search was conducted in GEO using specific keywords to identify leprosy reaction–related datasets. A total of eight datasets were found, of which only four were considered for individual analysis. Datasets with similar comparisons based on clinical features were grouped for analysis.
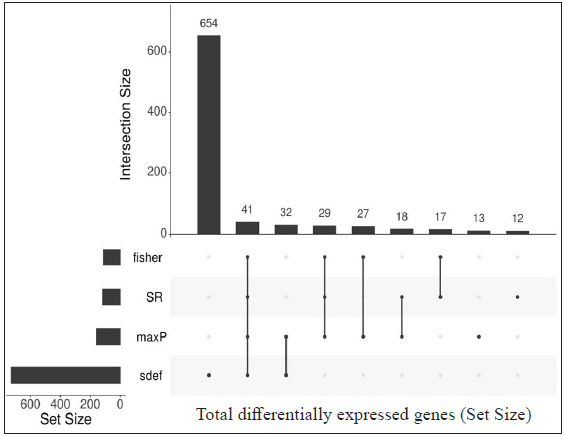
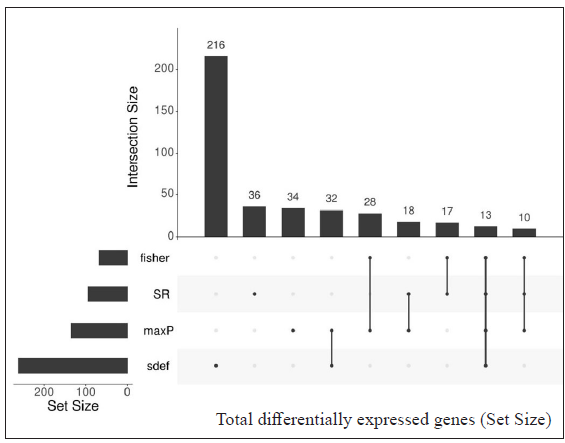
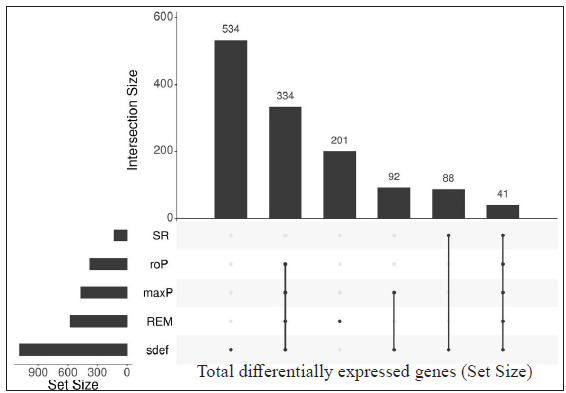
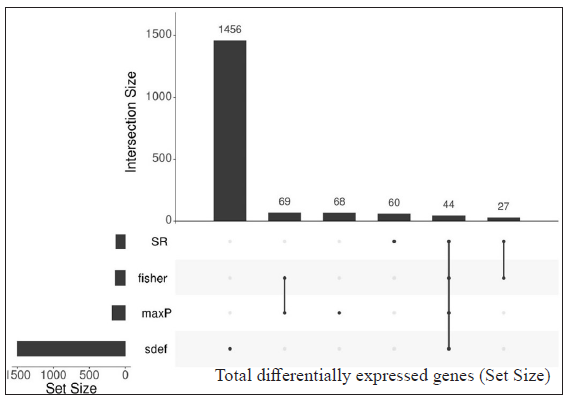
Identification of common differentially expressed genes using sdef and meta-analysis methodsIndividual datasets were processed to identify all the expressed genes. Then, similar comparisons from different datasets were considered to identify DEGs. Four similar comparisons from datasets were considered for ratio association analysis, namely, HC vs ENL, HC vs RR, LL vs ENL, and LL vs RR. Genes common to each study within the specific comparison were used in the ratio association test (sdef). Additional gene expression meta-analysis tools were used as described in the MetaDE R package, such as- rth ordered P-value (roP), sum of ranks (SR), and maximum P-value (maxP), among others. Figure 2 shows the upset plots representing the number of genes selected by each method along with their intersection with a false discovery rate (FDR) < 0.01. maxP and Fisher seems to be a more generous method in the selection of DEGs across comparisons. sdef analysis showed a significant association between the expressed genes in the datasets within each comparison category. Overall, the sdef method seems to be moderate in selection of genes. Other meta-analysis methods are quite conservative as they select fewer genes than the ratio association method. Table 2 represents the list of genes selected with |log2FC| > 3 and FDR < 0.001 in the HC vs ENL comparison. A total of 41 genes were selected by all four meta-analyses methods. maxP, fisher, and SR methods selected 29 genes. Top DEGs which are upregulated in HC individuals are ATF3, BCL2A1, C11orf96, C9orf47, CHST15, PLAUR and S100A9 while those more expressed in ENL are – AGFG2, ANK3, CD1E, CTSF, DOCK9, KRT73, NAV2, PCDH1, among others.
Export to PPT
Export to PPT
Export to PPT
Export to PPT
Table 3 represents the DEGs selected. A cut-off of |log2FC| > 2 and FDR < 0.001 in LL vs ENL is considered. A total of 334 genes were selected by the random effects model (REM) method excluding SR; however, 41 genes were found to be significant by all four methods along with REM. Genes that showed more expression in LL are ATP1B1, CD9, ITGBL1, PRKACB and PSD3 while genes more expressed in ENL are ADAMTS5, ADAMTS9, IFITM2, IFITM3, KIRREL, KRT16, KRT6A, PTX3, SERPINA3, SLC22A4, among others.
DEGs selected by all four methods (Fisher, SR, maxP, and sdef) in HC vs RR and LL vs RR comparison groups are shown in Supplementary Table 1 and Supplementary Table 2, respectively.
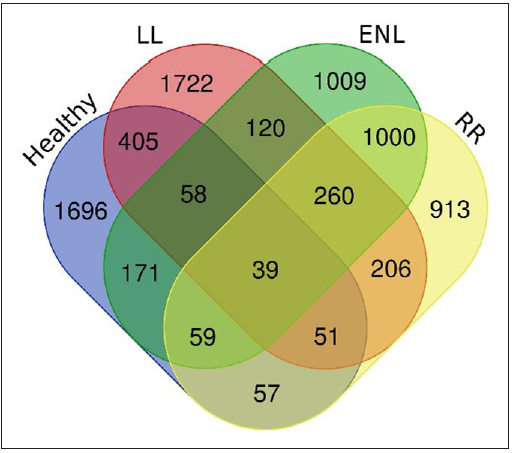
Comparison among groups considered in this studyThe number of DEGs from the comparison groups such as HC vs ENL, HC vs RR, LL vs ENL, and LL vs RR were then further compared to reveal genes specific to an individual group such as healthy, LL, ENL, and RR. The DEGs that belong to HC, LL, ENL, and RR were found to be 2536, 2861, 2716 and 2585, respectively. The Venn diagram depicting the genes specific to individual groups and common to different groups is shown in Figure 3.
Export to PPT
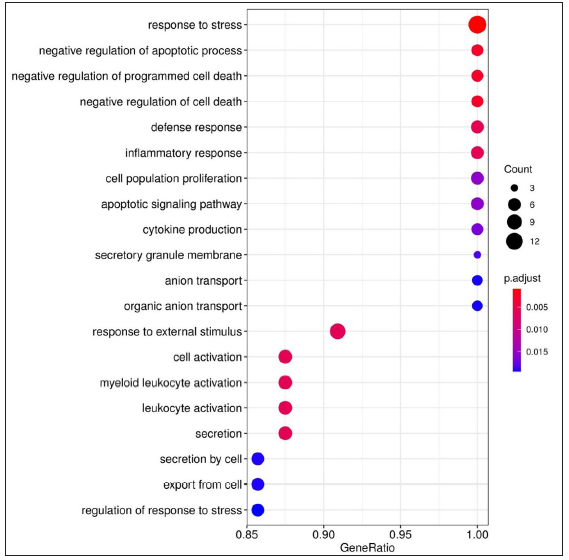
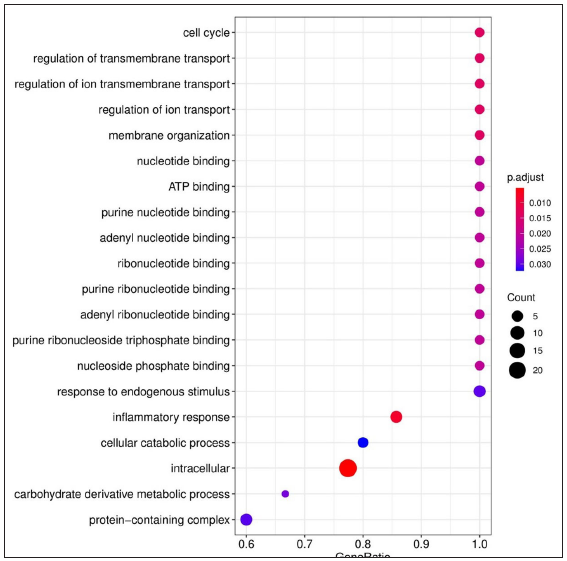
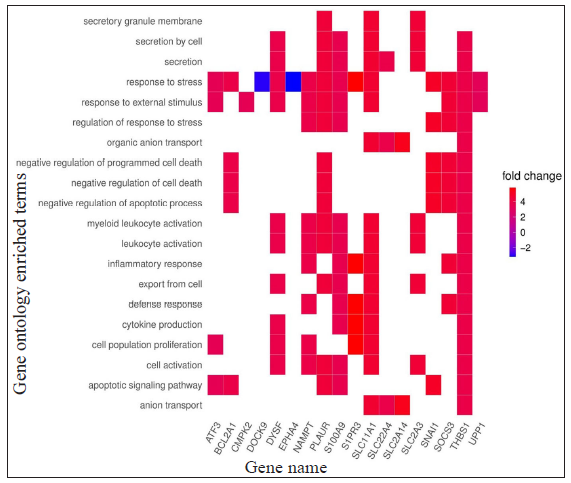
Gene ontology and functional enrichment analysisThe list of DEGs from different studies across multiple comparisons is used to understand the biological role of these genes. In the HC vs ENL comparison, 41 genes were selected by all four methods with an FDR < 0.01, and standardised |log2FC| > 3 was used in the analysis. The top 20 GO-enriched BPs are shown in Figure 4 [Supplementary Table 3]. The expressed genes correspond to processes like ‘response to stress’, ‘negative regulation of apoptotic process’, ‘cytokine production’, ‘defense response,’ and ‘myeloid leukocyte activation’. However, analysis of genes more expressed in HC than ENL showed GO enriched terms such as – ‘cellular metabolic process’, ‘ion binding’, ‘membrane-bound organelle, and ‘intracellular’. Similarly, the ontologies enriched for genes more expressed in ENL than HC are the’cellular macromolecule metabolic process’, ‘protein metabolic process,’ and ‘heterocyclic compound binding’. The other enriched terms for genes in HC vs ENL comparison are shown in Supplementary Table 3.
Export to PPT
Export to PPT
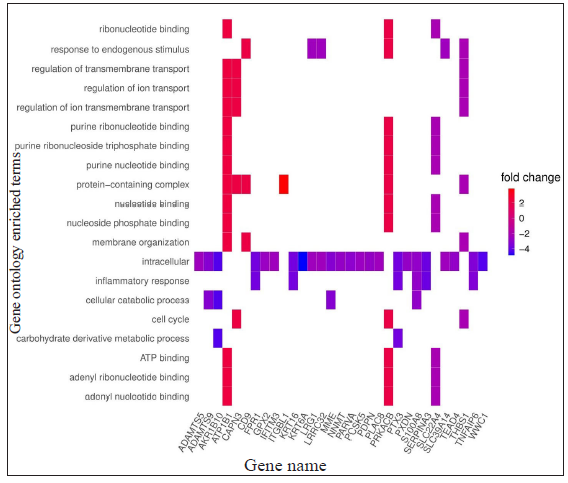
For LL vs ENL comparison, overall 334 genes were expressed at a cut-off of standardised |log2FC| > 2 and FDR < 0.001. However, only 41 genes were found to be significant by all meta-analysis methods. Therefore, these 41 genes were used to understand their BPs. Functional enrichment analysis reveals the GO enriched BPs such as ‘cell cycle’, ‘regulation of ion transport’, ‘inflammatory response,’ and ‘response to endogenous stimulus’ which are indicative of host response against a pathogen. The top 20 enriched ontologies for genes differentially expressed in LL vs ENL are shown in Figure 4 [Supplementary Table 4]. Genes specific to a particular GO enriched term for HC vs ENL and LL vs ENL comparison sets are shown in Figure 4. Heat plots showing the enriched terms for identified genes based on standardised log2FC for comparison HC vs ENL and LL vs ENL are shown in Figure 5. Figure 6 represents an overview of the meta-analysis of the datasets representing the two types of leprosy reactions: Type-I (Reversal Reactions) and Type-II (Erythema Nodosum Leprosum).
Export to PPT
Export to PPT
留言 (0)