
記住我

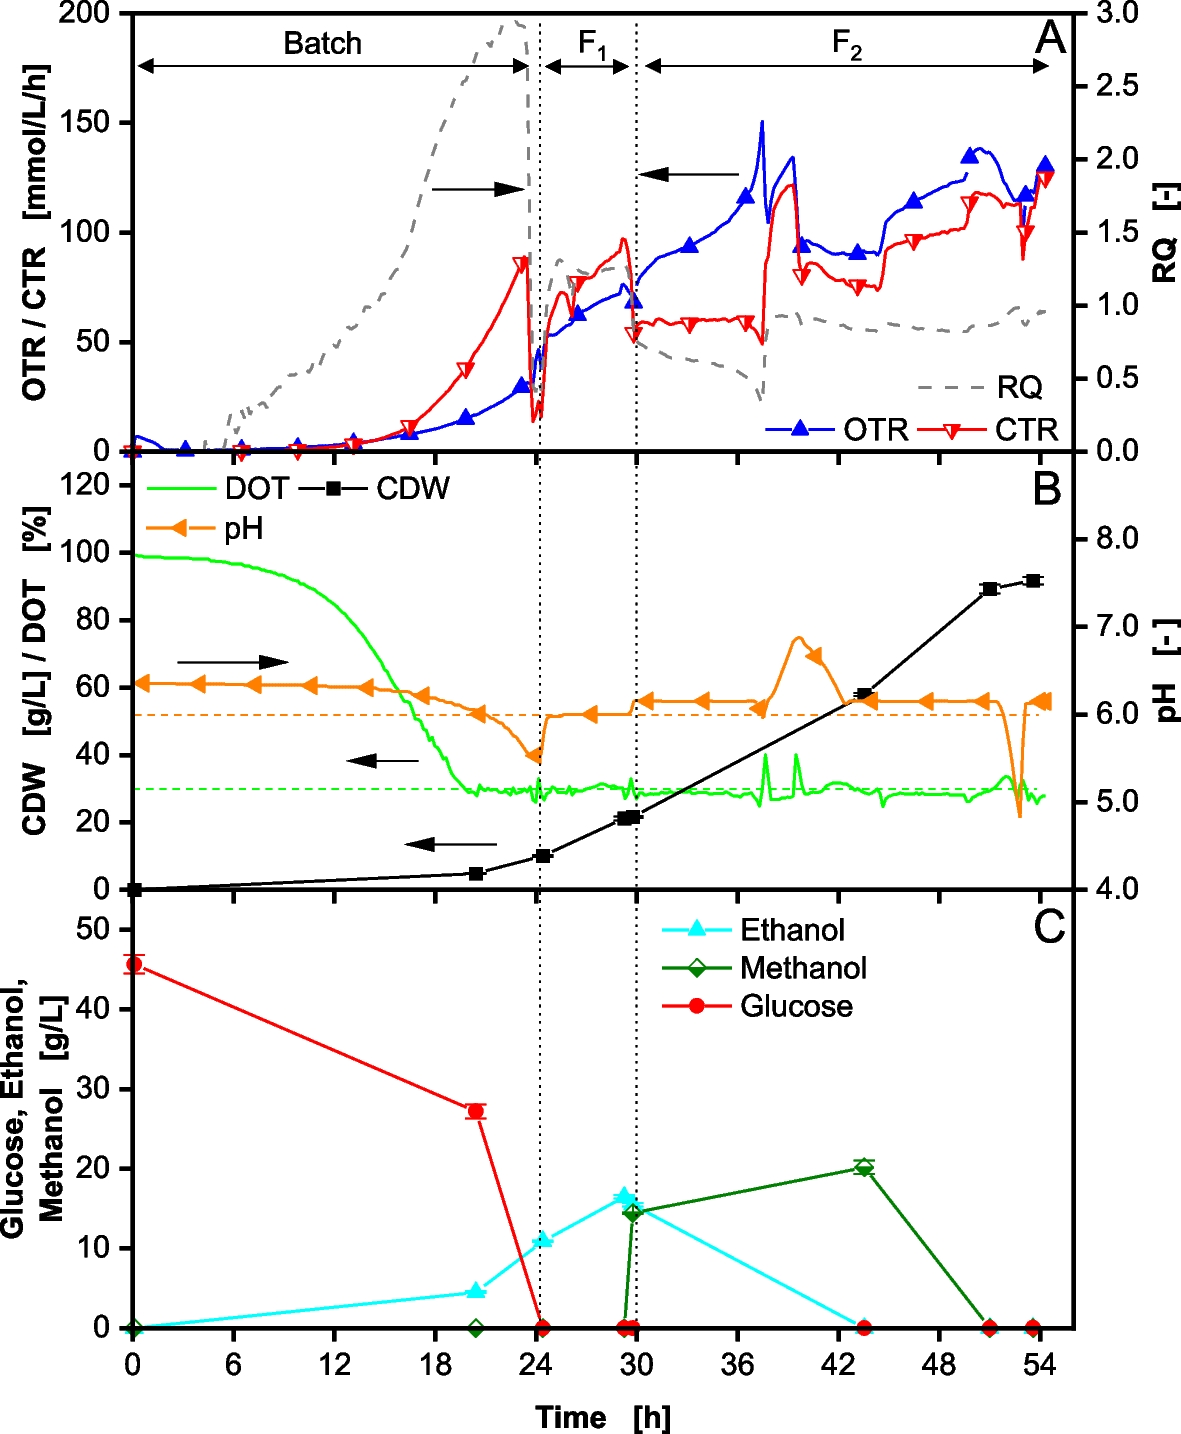


A reference fed-batch fermentation with 40 g/L glucose (46 g/L measured) at the start of the fermentation was conducted. The results are shown in Fig. 1.
Fig. 1
Fed-Batch fermentation of Komagataella phaffii BG11 strain with 40 g/L glucose in initial batch phase and DOT controlled > 30% performed in a 2 L stirred tank reactor. After 30 h (second vertical dotted line) induction is performed by methanol addition. In (A) the oxygen transfer rate (OTR), carbon dioxide transfer rate (CTR) and respiratory quotient (RQ) are depicted over time. In (B) the dissolved oxygen tension (DOT), cell dry weight (CDW) and pH are depicted over time. In (C) the glucose, ethanol and methanol concentrations are depicted over time. Cultivation was performed with 40 g/L initial glucose concentration. The start of feeding is marked by the first vertical dotted line. The feeding solution consisted of 640 g/L glucose. Induction by adding 1 vol% MeOH. 7 vol% MeOH was added to the feeding solution F2 after induction. Feeding rate F1 = 11 mL/h *exp(0.2 h−1 * t) from 25–30 h. Feeding rate F2 = 7 mL/h *exp(0.05 h−1 * t) from 30–54 h. The pH was controlled at 6
During the initial batch phase, the oxygen transfer rate (OTR) and carbon dioxide transfer rate (CTR) increase exponentially as glucose is consumed (Fig. 1A). The dissolved oxygen tension (DOT) decreases and is controlled at 30% by a cascade control with the stirring speed and aeration rate (Fig. 1B). In this phase, a respiratory quotient (RQ) well above the calculated RQ of 1.09 (Eq. 10), is observed (Fig. 1A), indicating a strong overflow metabolite formation. A high concentration of ethanol could be measured (Fig. 1C). Other studies have shown the production of further metabolites from the respiro-fermentative pathway including pyruvate, acetaldehyde, acetate, and arabitol [11, 16, 21]. In the batch phase, the cell dry weight (CDW) reaches 10 g/L (Fig. 1B). A total of 11 g/L ethanol accumulates in the supernatant (Fig. 1C), leading to a biomass yield (YX/S) of only 0.22 g/g. This yield is lower than usual for K. phaffii processes, using glucose as a carbon source [33,34,35]. However, when applying high glucose concentrations in batch mode, similar results are reported due to overflow metabolite formation [4, 15]. After the initial batch phase, the first exponential feed F1 is started, to further increase biomass concentration prior to induction and derepress the PAOX1 promoter [37]. An exponential growth rate of 0.2 1/h, close to the maximal growth rate for K. phaffii [31], is set through a preprogrammed feed (Eq. 2). During this phase, the OTR and CTR continue to rise. The RQ drops to 1.3, still indicating some overflow metabolite formation (RQ > 1.09 from Eq. 10). This is confirmed by the rise in ethanol concentration to 16.5 g/L (Fig. 1C). A CDW of 22 g/L is achieved before feed F2 is initiated. This CDW is lower than anticipated, likely due to the elevated ethanol concentration. This hypothesis is supported by the observed growth rate µ of 0.17 1/h (Supplementary Figure S4A, Additional File 1), which is lower than the set growth rate of 0.2 1/h by the feed. Consequently, a portion of the glucose is diverted from biomass production to the formation of overflow metabolite. Although the applied BG11 host strain does not express a recombinant protein, methanol induction was performed through a methanol pulse of 1 vol% (14 g/L measured) after 30 h. To compensate for methanol consumption and evaporation and to keep the methanol concentration in the reactor constant, the feed was also complemented with 7 vol% methanol. The feed rate was reduced and followed the second pre-programmed exponential feed F2 with a growth rate of 0.05 1/h (Eq. 3). At the start of the induction phase, the CTR drops significantly, due to the reduced glucose availability. However, the OTR continues to rise, leading to an RQ drop from 0.7 to 0.3 from 30 h until 37.5 h. This suggests the metabolization of the previously formed overflow metabolites. At 37.5 h, the RQ increases to ~ 1.0 and the pH rises to 6.9 (Fig. 1B), indicating the metabolization of an acidic overflow metabolite, possibly acetate, as it matches the measured RQ (refer to supplement material for theoretical RQ calculation, Additional File 1). Acetate was already determined as an overflow metabolite for K. phaffii [38, 39]. Additionally, ethanol was not detectable after 43.5 h. Similar patterns of ethanol production and re-assimilation have been reported in previous studies [21, 22, 40,41,42,43]. Vanz et al. [44] as well as Karaoğlan et al. [14] could also identify the occurrence of two alcohol dehydrogenases, that are both responsible for the production and consumption of ethanol and may have additional functions that are not yet fully understood [14, 44]. The results reemphasize that overflow metabolites accumulate during the batch and high-growth fed-batch phases when glucose is provided as the carbon source. High uptake rates lead to a redirected flux towards the fermentative pathway to avoid NADH accumulation when the respiration system becomes saturated, as assumed for the methylotrophic yeast Hansenula polymorpha [45].
After 39.5 h, the pH starts to drop again and continues to be regulated at pH 6 by ammonia addition. The RQ drops to 0.8–0.9, indicating the simultaneous consumption of glucose and methanol (refer to supplement material for theoretical RQ calculation, Additional File 1). To this point, likely no methanol is consumed, as can be seen by the accumulation of the methanol additionally introduced via the feed. Ethanol has been shown to inhibit methanol consumption [21]. Further, the methanol concentration decreases only after ethanol is consumed, reaching the detection limit after 51 h. At this time, the RQ rises to ~ 1, reaffirming the methanol metabolization [46]. Therefore, the fed methanol was not sufficient to keep a constant concentration of 1 vol% in the reactor. On-line methanol control strategies could be applied to prevent this issue [47, 48]. The fermentation is stopped after 54 h, reaching a total CDW of 92 g/L from a cumulated glucose concentration of 165 g/L. This results in a total biomass yield relative to glucose of 0.56 g/g, comparable with previous results [33,34,35].
Thermodynamically, it is not reasonable to allow for overflow metabolite formation and consumption, as exergy is being lost in the process. Therefore, the formation of up to 16 g/L ethanol should be avoided. Furthermore, while the introduction of the first feeding phase reduces promoter repression by glucose prior to induction, the accumulation of overflow metabolites, such as ethanol, strongly represses product formation [21]. In the shown reference fermentation, ethanol is present in the first 9.5 h of the production phase, likely leading to a potential productivity loss, since energy is redirected from product formation.
Increase of dissolved oxygen setpointTo address ethanol formation, oxygen availability was investigated. Although hypoxia has been reported beneficial for the expression of foreign genes in K. phaffii [47], especially for Mut+ phenotypes, it is associated with increased overflow metabolism [49, 50]. Conversely, excess oxygen has also been shown to promote the formation of specific proteins in K. phaffii MutS phenotypes [51, 52]. To assess the influence on overflow metabolite formation, the DOT setpoint was increased from 30% to 60% during a fermentation. The initial glucose concentration was kept at 40 g/L (41 g/L measured). The results are shown in Fig. 2.
Fig. 2
Fed-Batch fermentation of Komagataella phaffii BG11 strain with 40 g/L glucose in initial batch phase and DOT controlled > 60% performed in a 2 L stirred tank reactor. After 27 h (second vertical dotted line) induction is performed by methanol addition. In (A) the oxygen transfer rate (OTR), carbon dioxide transfer rate (CTR) and respiratory quotient (RQ) are depicted over time. In (B) the dissolved oxygen tension (DOT), cell dry weight (CDW) and pH are depicted over time. In (C) the glucose and ethanol concentrations are depicted over time. Methanol concentration is given as theoretical values (background shadow). Cultivation was performed with 40 g/L initial glucose concentration. The start of feeding is marked by the first vertical dotted line. The feeding solution consisted of 640 g/L glucose. Induction by adding 1 vol% MeOH. 7 vol% MeOH was added to the feeding solution F2 after induction. Feeding rate F1 = 11 mL/h *exp(0.2 h−1 * t) from 19–24 h. Feeding rate F2 = 7 mL/h *exp(0.05 h−1 * t) from 27–54 h. The pH was controlled at 6
The increase in oxygen availability did not significantly reduce ethanol formation in the batch phase. The slightly lower glucose concentration of 41 g/L in the batch (compared to 46 g/L in Fig. 1) led to a CDW of 9 g/L (Fig. 2B) and an ethanol concentration of 10 g/L after glucose consumption at 19 h (Fig. 2C). The biomass yield YX/S of 0.22 g/g is similar to the reference. During the first feed phase, the RQ is lower than for the reference fermentation (Fig. 2A), indicating fewer overflow metabolites being produced. Although ethanol formation is comparable, reaching a concentration of 15 g/L at 24 h (Fig. 2B), the formation of acidic overflow metabolites is reduced. The pH peak corresponding to the consumption of these acids (Fig. 2B) only reaches a pH of 6.2 (instead of 6.9 in Fig. 1B), suggesting that higher oxygen availability shifts by-product formation from oxidized metabolites like acids to more reduced metabolites like ethanol and arabitol. Moreover, the observed growth rate during the growth phase does not reach the growth rate set by the feed of 0.2 1/h (Supplementary Figure S4B, Additional File 1), indicating that a portion of the fed glucose is diverted away from biomass formation. As per the reference, the cells were induced by a methanol pulse and supplementation of F2 with methanol. Similar ethanol consumption patterns can be observed to those in the reference cultivation (Fig. 2C). Due to malfunction of the HPLC, no precise quantification of methanol could be performed. However, the RQ value during the induction phase remains at ~ 0.8, indicating the continuous consumption of methanol until the end of the fermentation, suggesting a non-limiting methanol concentration during the induction phase. After 43 h, the maximal oxygen mass transfer coefficient (kLa) of the reactor is reached resulting in a subsequent DOT decrease. The fermentation was stopped when the DOT reached 15%.
In summary, the increase of the DOT setpoint to 60% did not result in a significant reduction in ethanol formation. Therefore, ethanol formation in K. phaffii is not linked to limiting oxygen availability, but probably to surplus glucose uptake, interpreted as a consequence of the crabtree effect similar to S. cerevisiae and E. coli [53,54,55].
Decrease of glucose batch concentrationTo test the hypothesis that overflow metabolite formation is linked to glucose surplus and determine the maximal glucose concentration tolerable to prevent ethanol formation, a batch cultivation varying the initial glucose concentration was performed in shake flasks. The initial glucose concentration was varied from 5 g/L to 30 g/L. The cultivation was monitored using the in-house developed RAMOS device [56, 57], commercially available as Transfer rate Online Measurement (TOM) device (Adolf Kühner AG, Birsfelden, Switzerland). Both systems monitor the OTR online during the cultivation. The results can be seen in Fig. 3.
Fig. 3
Variation of initial glucose concentration of batch cultivations of Komagataella phaffii BG11 strain in shake flasks. Cultivation was performed in a temperature-controlled shaker at 30 °C, shaken at 350 rpm with a shaking diameter d0 of 50 mm. OTR was monitored with an in-house build RAMOS device every 20 min (flush phase 15 min, measuring phase 5 min). Only every 20th data point is shown as a symbol for simplicity. The lines are drawn through all measured data points. An OTRmax of 66 mmol/L/h was calculated with the correlation by Meier et al. (2016) and is shown as a dashed line
All cultures grow exponentially until glucose is depleted, marked by the drop after the first OTR peak [56]. For 10 g/L, 20 g/L and 30 g/L glucose, further peaks in the OTR can be seen, indicating the successive consumption of different overflow metabolites, produced during previous glucose uptake. Since ethanol, acetate and arabitol were probably produced in the previous stirred bioreactor cultivations (Figs. 1 and 2), it is most likely that these metabolites were formed here too. Ethanol may be associated with the second OTR peak, consistent with previous studies, demonstrating ethanol consumption prior to acetate in K. phaffii [21]. Furthermore, the OTR integral of the glucose peak is not proportional to the amount of glucose employed and does not match the calculated stoichiometry (refer to Supplementary Figure S3, Additional File 1), reaffirming the overflow metabolite formation during glucose consumption. To exclude the impact of oxygen availability on the overflow metabolite formation, the maximum oxygen transfer capacity OTRmax of the shake flask system was calculated with the correlation by Meier et al. [58] and is shown in Fig. 3 as a dashed line. None of the cultures reach the calculated OTRmax of 66 mmol/L/h. The absence of an OTR plateau further supports the conclusion that an oxygen limitation is not occurring [56]. In other words, all cultures have sufficient oxygen supply, confirming the results of Fig. 2, that increased oxygen availability does not lead to the elimination of overflow metabolite formation. For 10 g/L glucose in the batch, overflow metabolite formation is strongly reduced. Only a small overflow peak can be seen at 18 h. Lowered glucose concentrations result in lower glucose uptake rates, which are known to strongly influence the crabtree effect and its underlying mechanisms [19, 54]. Reducing the glucose concentration to 5 g/L completely eliminates overflow metabolite formation as indicated by missing additional OTR peaks. Additionally, the total oxygen consumption, calculated from the OTR integral (Eq. 8), of 50 mmol/L fits the theoretical stoichiometric prediction derived from Eq. 10 (refer to Supplementary Figure S3, Additional File 1), further confirming the results. A similar observation was made by Weis et al. [20] and Wollborn et al. [26]. The increase in glucose concentration from 2 g/L to 30 g/L did not lead to the expected stoichiometric increase in biomass.
To reduce overflow metabolite formation in the stirred tank fermentation, the process is adapted by reducing the initial glucose concentration in the batch phase to 5 g/L, as deduced from Fig. 3. Furthermore, the first feed phase was modified to F1+ (Eq. 4) and prolonged to reach a comparable total glucose amount provided (74 g compared to 68 g in Fig. 1) and accumulated biomass before induction as in the reference process. The results can be seen in Fig. 4.
Fig. 4
Fed-Batch fermentation of Komagataella phaffii BG11 strain with 5 g/L glucose in initial batch phase and DOT controlled > 30% performed in a 2 L stirred tank reactor. After 28 h (second vertical dotted line) induction is performed by methanol addition. In (A) the oxygen transfer rate (OTR), carbon dioxide transfer rate (CTR) and respiratory quotient (RQ) are depicted over time. In (B) the dissolved oxygen tension (DOT), cell dry weight (CDW) and pH are depicted over time. In (C) the glucose, ethanol and methanol concentrations are depicted over time. Cultivation was performed with 5 g/L initial glucose concentration. The start of feeding is marked by the first vertical dotted line. The feeding solution consisted of 640 g/L glucose. Induction by adding 1 vol% MeOH. 7 vol% MeOH was added to the feeding solution F2 after induction. Feeding rate F1 = 1.2 mL/h *exp(0.2 h−1 * t) from 13–28 h. Feeding rate F2 = 7 mL/h *exp(0.05 h−1 * t) from 27–50 h. The pH was controlled at 6
During the first 13 h, the initial glucose is consumed in batch mode and 0.45 g/L ethanol is formed (Fig. 4C). The RQ reaches a value of 1.8 (Fig. 4A), matching the formation of ethanol. Contrary to the shake flask experiment, some ethanol is still formed in the batch with 5 g/L glucose. This could be explained by the elevated osmolarity of the high cell density medium used for the stirred tank fermentations. Higher osmotic pressure was shown to lead to overflow metabolite formation [59, 60]. After glucose consumption and the start of the first feed F1+, the RQ drops below 1 (Fig. 4A), suggesting metabolization of the previously formed ethanol. After 2 h from the start of F1+ (29 h total process time), the RQ increases to 1.1 indicating growth on glucose (Eq. 10) and the complete consumption of ethanol [45]. Offline samples taken after 22 h confirm the absence of overflow metabolites in the supernatant (Fig. 4C). At 28 h, the cells are induced by spiking 1 vol% methanol (8.8 g/L measured) into the fermenter. Furthermore, the feed is reduced to F2, equivalent to Figs. 1 and 2. At this point, the RQ drops significantly to 0.8 (Fig. 4A), indicating the immediate start of methanol metabolization [46]. A spike in OTR and CTR can also be seen. Due to the absence of ethanol or other overflow metabolites in the hours before induction, the PAOX1 promoter is derepressed [37] and methanol consumption is not inhibited, as opposed to what is shown in Fig. 1. Further, no spike in the pH is seen as in Figs. 1 and 2. Therefore, after 34 h, when the RQ rises to 0.96, methanol is most likely fully consumed and becomes limiting (shown in Fig. 4C with a dashed line). Interestingly, during the last hours of the fermentation, small amounts of ethanol accumulated in the reactor, reaching a concentration of 0.7 g/L. This could be a consequence of the high cell density of 125 g/L achieved at the end of the fermentation, leading to oxygen inhomogeneities in the reactor due to mass transfer limitations [15, 61]. Nonetheless, by reducing the glucose concentration in the initial batch phase to 5 g/L, ethanol formation was significantly reduced and the biomass yield relative to glucose YX/S could be improved by 9.3% to 0.61 g/g (significant difference with p < 0.01). The results are consistent with previous findings by Hang et al. [19]. They also reported that lower glucose concentrations were beneficial for K. phaffii, as less ethanol was formed, while simultaneously increasing productivity.
Application in a recombinant protein production processOverflow metabolite formation can lead to productivity losses during recombinant protein production. On one side, exergy is lost during the formation and reassimilation of the metabolites. On the other side, overflow metabolites such as ethanol are known to repress methanol-induced promoters such as the PAOX1 promoter [21]. Therefore, two fermentations with a recombinant protein-producing strain were performed to quantify productivity losses due to overflow metabolite formation. The results are shown in Fig. 5.
Fig. 5
留言 (0)