
記住我


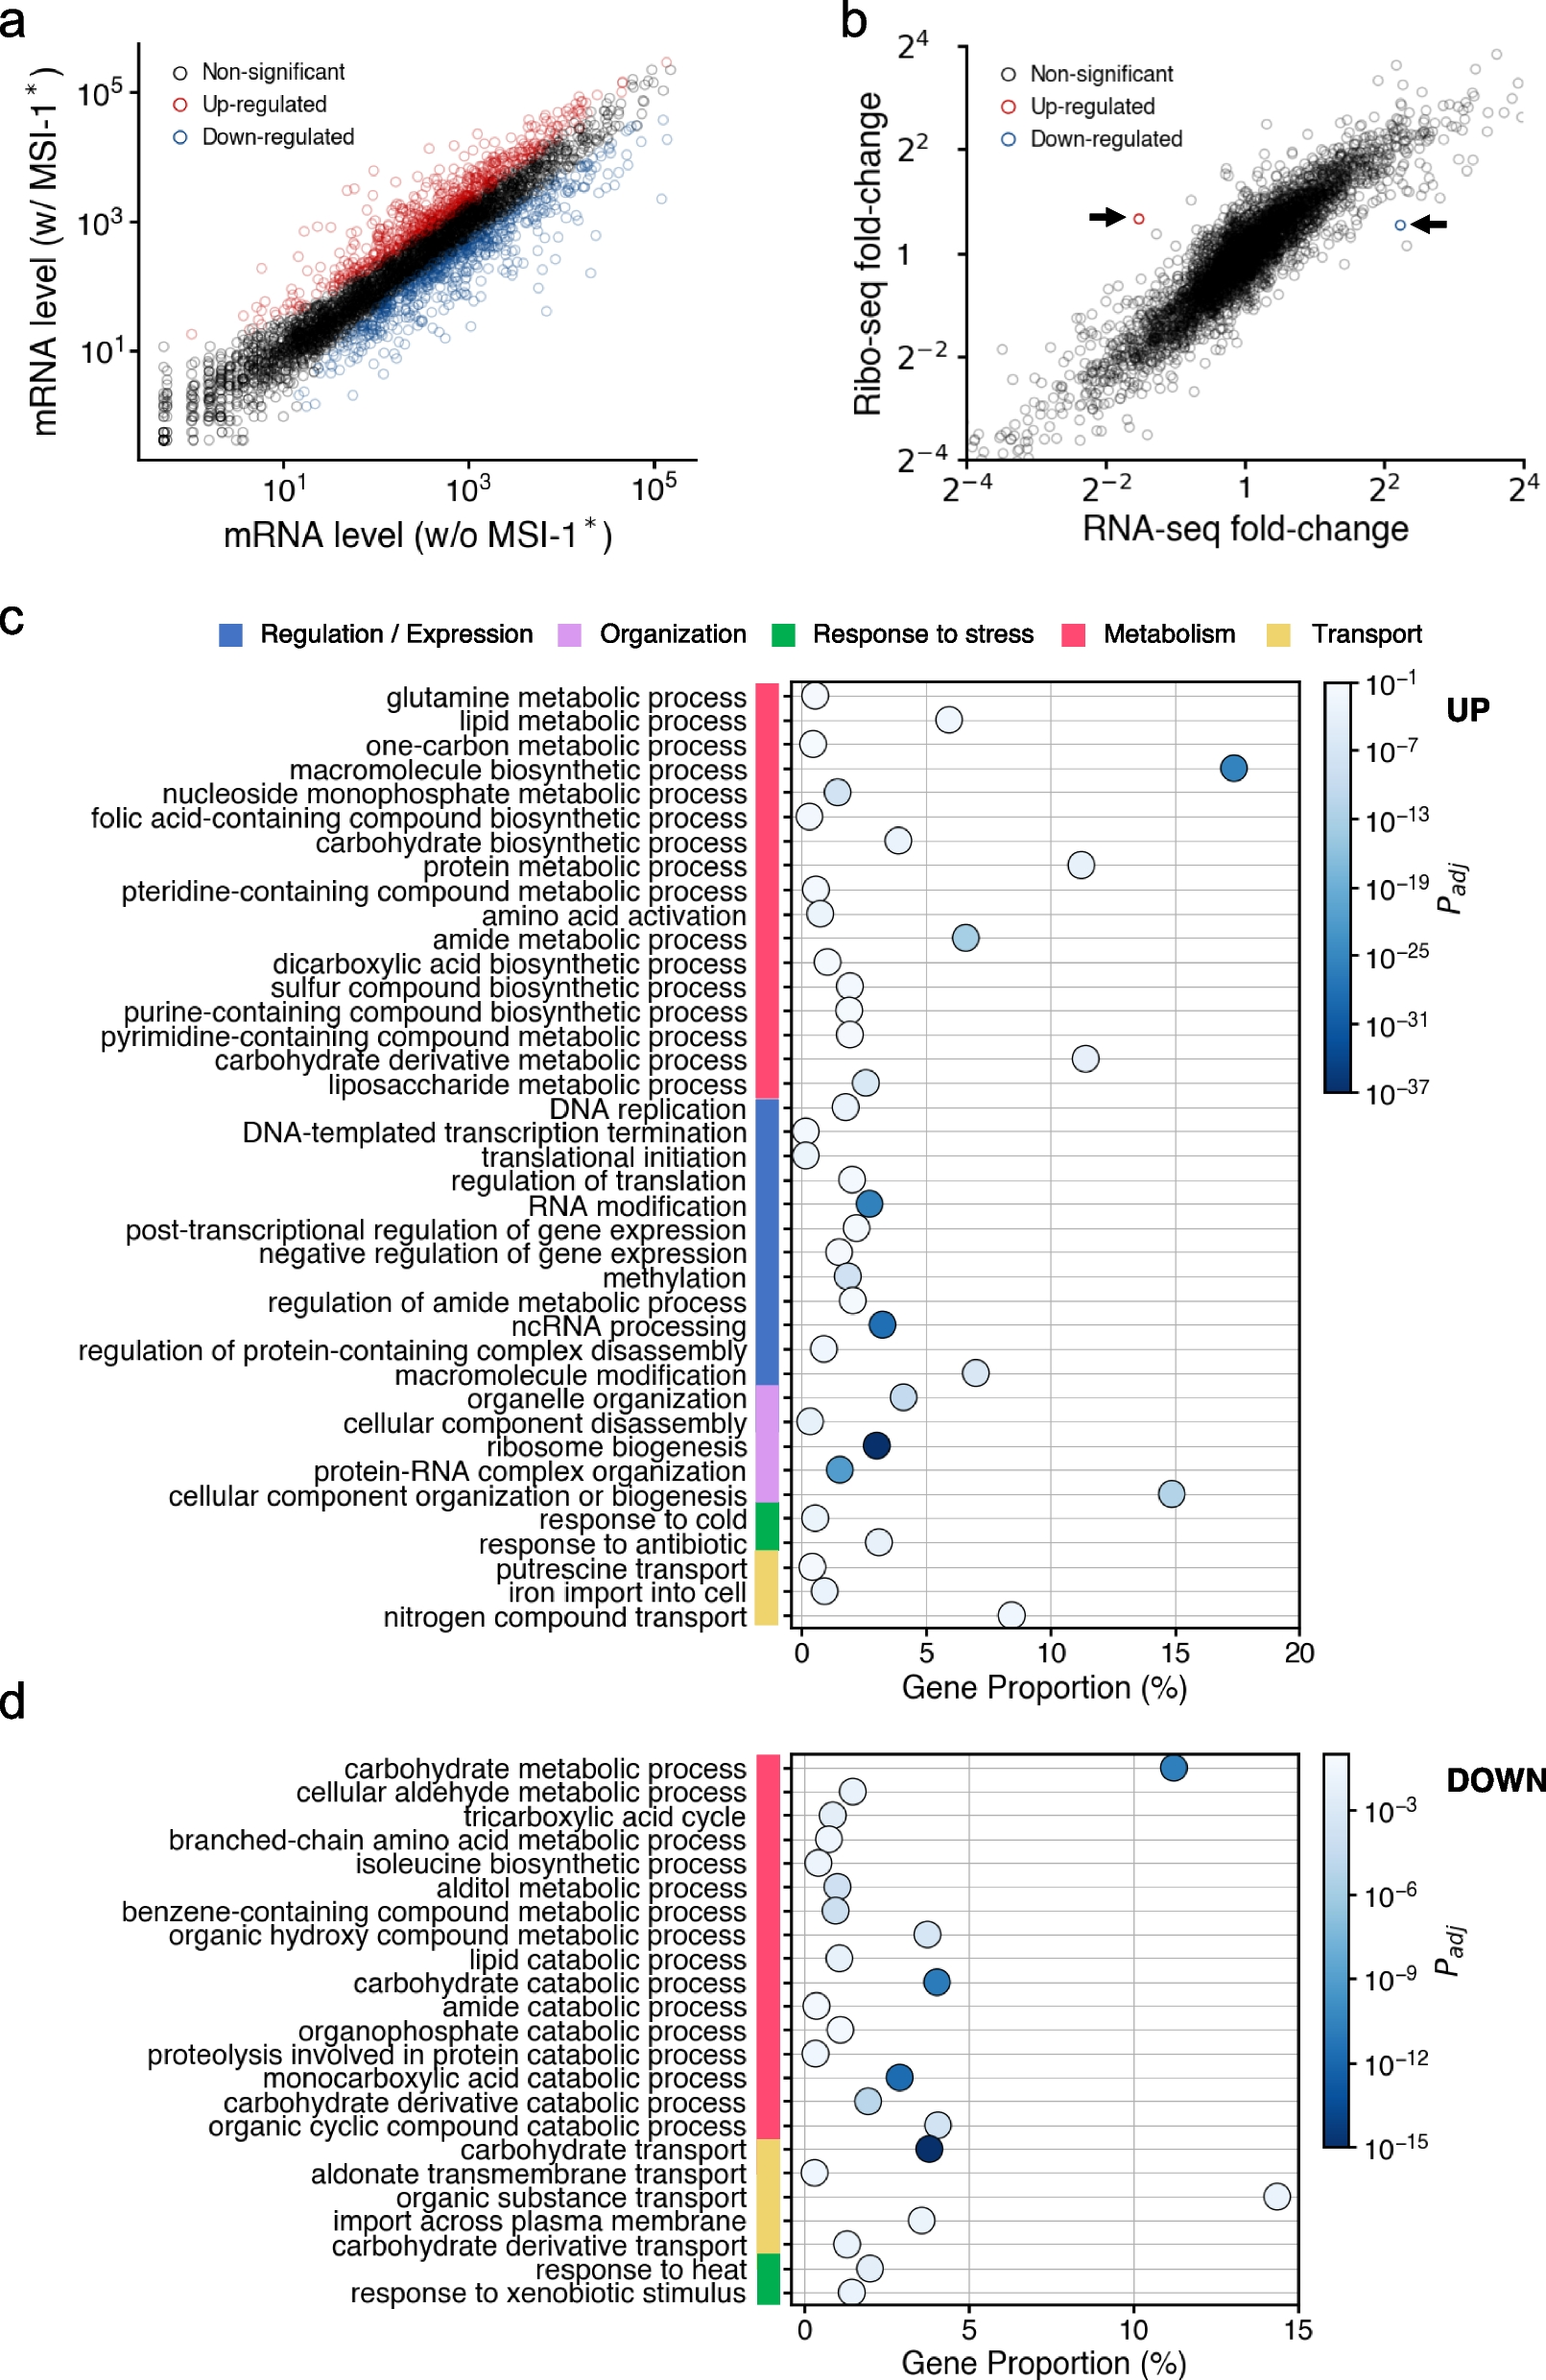
The gene expression profile of E. coli cells upon Musashi protein expression was analyzed. A truncated version of the Musashi-1 protein from M. musculus (termed MSI-1*, containing two RRMs) was expressed from a synthetic PL-based promoter (termed PLlac) in a high copy number plasmid. For that, we used E. coli cells with a knockout of the LacI gene, thereby ensuring a constitutive expression of MSI-1*. We employed RNA-seq to quantify the whole transcriptome of the cell with and without Musashi protein (each condition was measured in duplicate). We found 643 genes whose expression was significantly up-regulated in cells expressing MSI-1* (statistical significance assessed by a Wald test with Benjamini-Hochberg’s correction, P value < 0.05, and fold change > 1.5), whereas 616 genes whose expression was significantly down-regulated (Fig. 1a; see also Fig. S1). Among the up-regulated genes with larger fold change, we found genes coding for ribosomal proteins (e.g., rpsR or rlmF), genes related to sulfate metabolism and transport (e.g., cysJ or cysP), and genes coding for efflux pumps (e.g., mdfA). This suggested that E. coli deployed a general response following the stress imposed by MSI-1* expression [20]. In contrast, among the down-regulated genes with larger fold change, we found genes involved in the tryptophan synthesis and transport (e.g., tnaB), genes related to fructose utilization (e.g., fruA), and genes involved in the β-oxidation pathway by which energy is released from fatty acids (e.g., fadE or fadB) [21].
Fig. 1
Differential gene and protein expression upon MSI-1* expression by RNA-seq and Ribo-seq. a Scatter plot of the expression of all host genes with and without MSI-1* (average of two replicates from RNA-seq). Transcriptionally up-regulated genes marked in red and transcriptionally down-regulated genes in blue. b Scatter plot of the fold change in RNA and protein expression (from RNA-seq and Ribo-seq, respectively) of all host genes upon MSI-1* expression (average of two replicates). Gene with up-regulated translation marked in red and gene with down-regulated translation in blue. c Functional analysis for the transcriptionally up-regulated genes. A relationship between gene proportion and adjusted P value is presented. d Functional analysis for the transcriptionally down-regulated genes
To inspect in a comprehensive way the biological meaning of these alterations, we assessed the enrichment of certain processes within the list of differentially expressed genes upon MSI-1* expression taking advantage of gene ontology (GO) resources [22]. In the case of up-regulation, we found regulation of translation, response to antibiotic, as well as a series of metabolic processes (Fig. 1c). Synthetic gene circuits tend to stimulate the translation machinery of the host cell, in agreement with previous work [16]. Among the down-regulated genes, we mainly found catabolic processes of lipids and carbohydrates, transport of carbohydrates, and response to heat (e.g., dnaK was substantially down-regulated; Fig. 1d). Because DnaK is a negative modulator of heat-shock protein expression, such proteins were up-regulated in response to MSI-1* as a general mechanism against heterologous protein expression [23].
In addition, we employed ribosome profiling (Ribo-seq) [24] to quantify the change of the whole translatome upon expressing MSI-1*. We identified only two translationally regulated genes by normalizing the Ribo-seq counts by the RNA-seq counts (Fig. 1b). That is, lyxK, encoding a sugar kinase with up-regulated translation, and plsX, encoding a phosphate acyltransferase with down-regulated translation. The rest of the changes in protein expression were attributed to changes in RNA abundance (i.e., transcriptional effects; Fig. 1b). We searched the consensus pattern RUnAGU (n = 1-3) in duplicate, potentially recognized by the whole protein, along the host transcriptome, finding 43 messenger RNAs (mRNAs) harboring the intended sequence (Fig. S2). For such a task, we used the E. coli K-12 transcriptome from EcoCyc as a reference encompassing all known transcriptional units [25]. Among those identified mRNAs, we did not find lyxK or plsX. Isolated single instances of the consensus pattern were found within the transcripts involving lyxK and plsX, but within the coding region of other genes (Fig. S3). This suggested that those changes were due to indirect influences caused by the cost of expressing the heterologous protein. These high-throughput results help to describe in quantitative terms the impact of MSI-1* on the intracellular pathways of E. coli.
Measuring the impact of mutations in a Musashi protein on the dynamic regulatory range of an engineered circuitWe engineered a series of point mutations in the MSI-1* gene to study their impact on regulatory function in E. coli as a result of an altered RNA-binding capability (Fig. 2a). In particular, four mutations affected the RRM1 of the protein (L50P, R53E, R61E, and R99A), two affected the RRM2 (H127Q and A184V), and another one introduced a premature stop codon after the RRM1 (V113*). Most of these mutations were selected following previous work showing that they compromise RNA binding [15, 26, 27]. To perform the characterizations, we now used E. coli cells over-expressing LacI, thereby offering external control with IPTG as the PLlac promoter, which controls MSI-1* expression, is repressed by LacI. The high copy number plasmid harboring the MSI-1* gene was co-transformed with a low copy number plasmid from which to constitutively express a superfolder green fluorescent protein (sfGFP). This way, we forced a suitable ratio between the regulatory (protein) and regulated (RNA) molecules to ensure gene regulation. Two RNA motifs recognized by MSI-1* were introduced in the leader region of the sfGFP transcript, one in the ribosome binding site (RBS) and another after the start codon (Fig. 2b), to regulate its expression at the translation level.
Fig. 2
Impact of mutations in MSI-1* on the regulatory activity. a Scheme of the MSI-1* gene showing the different point mutations introduced. b Scheme of the different 5’ UTRs considered (containing RNA motifs). c-e Dynamic ranges of the responses upon induction with IPTG (1 mM) of the different genetic systems. pRM1+ and pREP7 in c), pRM1+ and pREP6 in d), and pRM1+ and pREP6b in e). Error bars correspond to standard deviations (three replicates). AU, arbitrary units. f Relationship between the predicted and experimental fold change for pRM1+ and pREP7. The predicted fold change for pRM1+ and pREP7 is the product of the experimental fold changes for pRM1+ and pREP6 and pRM1+ and pREP6b
The original protein showed 89.2% repression, and all mutants tested here, except the R53E one, displayed lower regulatory activity (Fig. 2c). Regarding the mutations affecting the RRM1, our results show that while the R53E and R99A mutation had minor effect on the performance (91.7% and 86.2% repression, respectively), both the L50P and R61E mutations reduced substantially the regulatory activity of MSI-1* (65.8% and 46.5% repression, respectively). According to previous structural simulations and in vitro assays, these four residues have been shown to establish contacts with small molecules, leading to allosteric regulation [15, 26]. Our data suggest that R61 and R99 also establish contacts with RNA, as well as they highlight the R53E mutant as a suitable regulator less sensitive to fatty acids [15] for further synthetic biology developments. For some mutations, we confirmed that they do not alter the expression level through a translational fusion of a red fluorescent protein (Fig. S4).
Regarding the mutations affecting the RRM2, our results show that both the H127Q and A184V mutations reduced moderately the performance (86.6% and 72.2% repression, respectively). Of note, Q127 is the native residue in the MSI-1 from Homo sapiens. Moreover, the A184V mutation has been shown to impede RNA binding in human cells, leading to deregulation of the target transcripts [27]. Notwithstanding, the use of a different sequence in the target mRNA, the lack of the C-terminal tail in the regulatory protein, and the prokaryotic context preclude establishing comparisons. Finally, the V113* mutation led to a 36.9% repression, suggesting that only one RRM is not enough to implement a post-transcriptional regulation with high dynamic range in vivo. This provides a rationale on why RRMs are typically found as repeated domains (from two to six) within a protein [13].
We also characterized the performance of the different mutants considering additional reporter systems in which only one RNA motif was present in the leader region of the sfGFP transcript (Fig. S5 shows the corresponding sequences and secondary structures). Figure 2d shows the regulatory activity when the motif is after the start codon, while Fig. 2e shows the activity when it is in the RBS. Assuming a scenario of independent binding, the fold change of the response with a two-motif target was well predicted by the product of the fold changes of the responses with one-motif targets (Fig. 2f; see also Fig. S6 where we depict the mathematical modeling of the response). Moreover, the reporter system lacking a hairpin after the start codon exhibited much higher expression levels [28]. Together, these results served to evaluate the mutational robustness of the heterologous RNA-binding protein.
Measuring the evolutionary stability of an engineered circuit involving a Musashi protein in E. coliTo evaluate the evolutionary stability of the system (i.e., its ability to behave as designed with time), we set up an experiment of serial dilutions by carrying in parallel 20 different bacterial populations during one week (using cells over-expressing LacI). In particular, 10 populations were evolved without IPTG (i.e., maintaining repressed the MSI-1* gene), while another 10 populations were exposed to IPTG (i.e., expressing MSI-1* in high amounts). We considered two different plasmids to express MSI-1*, one of high copy number and another of medium copy number. Every day, circuit functionality and stability were assessed by fluorometry and Sanger sequencing.
We found that in absence of IPTG, when sfGFP was expressed but not MSI-1*, the system accumulated mutations in the form of deletions in the sfGFP gene in most of the evolved lines, thereby abolishing the fluorescence signal (Fig. 3a,c; see also Fig. S7). As expected, this occurred irrespective of the plasmid copy number of the regulator. In these conditions, and considering 6.64 generations per day from a 1% bottleneck, the evolutionary stability of the sfGFP gene was assessed in about 20 generations as fluorescence declined in about 3 days (note that the plasmid copy number of the reporter is low). No mutations were detected in the MSI-1* gene, and the dynamic regulatory range of the system (i.e., repression fold obtained by inducing with IPTG) was roughly preserved during such first generations.
Fig. 3
Evolutionary stability of an engineered circuit involving MSI-1*. a Heatmap of the daily dynamic ranges (average of three replicates) of the responses upon induction with IPTG (1 mM) of the different genetic systems evolved during 7 d (46.5 generations). Data for five lines of cells co-transformed with pRM1+ and pREP7 evolved in a medium without IPTG. On the bottom, scheme of the genetic circuit. Crosses indicate that the genetic element accumulated mutations with time. b Heatmap of the daily dynamic ranges of the responses upon induction with IPTG. Data for five lines of cells co-transformed with pRM1+ and pREP7 evolved in a medium with IPTG. c Heatmap of the daily dynamic ranges of the responses upon induction with IPTG. Data for five lines of cells co-transformed with pRM1 and pREP7 evolved in a medium without IPTG. d Heatmap of the daily dynamic ranges of the responses upon induction with IPTG. Data for five lines of cells co-transformed with pRM1 and pREP7 evolved in a medium with IPTG. AU, arbitrary units
In presence of IPTG during evolution, when MSI-1* was expressed and sfGFP repressed at the translation level, the results were different. When the regulator was expressed from a high copy number plasmid, the system accumulated mutations in the form of deletions in the PLlac promoter and in the sfGFP gene (Fig. 3b; see also Fig. S8). As previously shown, the two LacI operators within the promoter triggered a homologous recombination event that removed the -35 region [29], so MSI-1* was no longer expressed. In this case, the fluorescence signal was lost in about 26 generations. However, when the regulator was expressed from a medium copy number plasmid, the system only accumulated mutations in the sfGFP gene (Fig. 3d; see also Fig. S8). The PLlac promoter remained stable and no mutations were detected in the MSI-1* gene, which suggested a correct MS1-1* expression with time. Certainly, synthetic circuit stability is usually increased by reducing the plasmid copy number [30]. In this latter case, a proper dynamic range of fluorescence held for up to 40 generations. In the light of these results, MSI-1* expression arguably created less burden to the cell than sfGFP expression. Hence, the MSI-1* gene seems sufficiently stable in E. coli to be used in synthetic biology applications.
留言 (0)