
記住我


Participant demographics are provided in Table 1. A total of 788 PSEN1 E280A mutation carriers (169 APOE ε4 + , 609 APOE ε4-; 154 cognitively impaired carriers) and 650 mutation non-carrier family members (165 APOE ε4 + , 485 APOE ε4-) had plasma NfL and APOE genotype data collected. One PSEN1 E280A mutation carrier and 4 mutation non-carriers did not have education data available. Age, sex distribution, and education did not differ by APOE ε4 group. A subset of 674 PSEN1 E280A carriers (141 APOE ε4 + , 533 APOE ε4-) and 594 non-carriers had cognitive data (148 APOE ε4 + , 446 APOE ε4-). Within this subset, the APOE ε4 + group had higher years of education.
Table 1 Participant characteristicsAmong PSEN1 non-carriers, 650 (165 APOE ε4 + , 485 APOE ε4-) had plasma NfL and APOE collected, and a subset of 594 (148 APOE ε4 + , 446 APOE ε4-) also had cognitive data. Age, education, and sex distribution did not differ as a function of APOE ε4 group either in the full sample or subset with cognitive data (Table 1). Participant demographics as a function of APOE ε2 group are provided in Supplementary Table S4.
Associations between APOE ε4 and plasma NfLWe first examined the effects of PSEN1 and APOE ε4 on plasma NfL collapsing across age. Plasma NfL was higher in PSEN1 E280A carriers than in non-carriers (Table 1) [F (1, 1424) = 86.84, p < 0.001]. There was no main effect of APOE ε4 nor an interaction between APOE ε4 and PSEN1 genotypes on plasma NfL concentrations (Fig. 1A). Similar negative results were observed when including age and sex as covariates.
Fig. 1
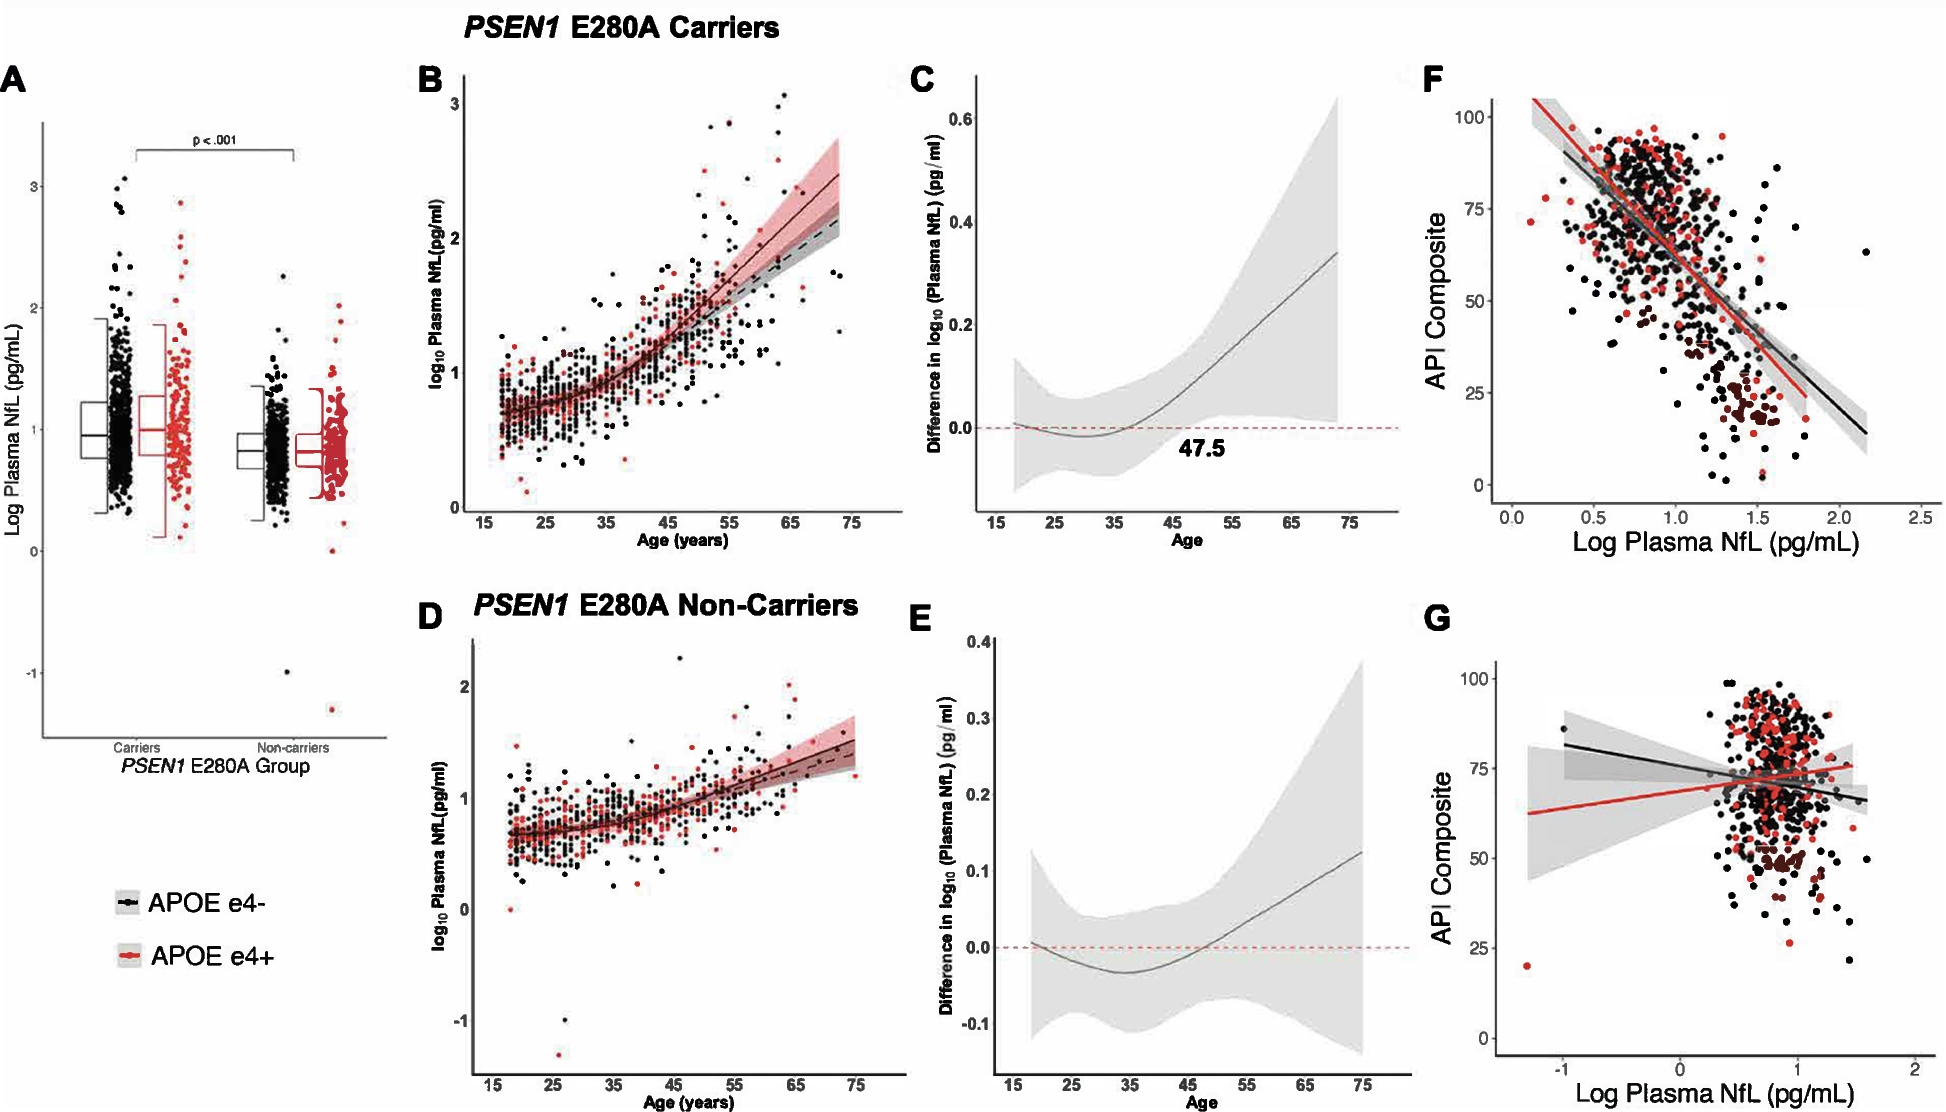
Plasma NfL as a function of APOE ε4. A Boxplot showing log-transformed plasma NfL concentrations (pg/mL) in PSEN1 E280A carriers and non-carriers as a function of APOE ε4 group (black: APOE ε4-, red: APOE ε4 +). B Log-transformed plasma NfL concentrations of PSEN1 E280A mutation carriers who are APOE ε4 + and APOE ε4- as a function of age. C Differences in NfL concentrations between APOE ε4 + and ε4- PSEN1 E280A mutation carriers as a function of age. D Log-transformed plasma NfL concentrations of PSEN1 E280A mutation non-carriers who are APOE ε4 + and APOE ε4- as a function of age. E Differences in NfL concentrations between APOE ε4 + and ε4- PSEN1 E280A mutation non-carriers as a function of age. F API composite score plotted by log-transformed plasma NfL concentrations in PSEN1 E280A mutation carriers stratified by APOE ε4 group. G API composite score plotted by log-transformed plasma NfL concentrations in PSEN1 E280A mutation non-carriers stratified by APOE ε4 group. In panels C and E, the shaded areas of each plot represent the 99% credible intervals around the model estimates drawn from the distributions of model fits derived by the Hamiltonian Markov chain Monte Carlo analyses. In panels F and G, plots show regression line with shaded standard error bands
We then examined the accumulation of plasma NfL across age as a function of APOE ε4 using a restricted cubic spline model. Among PSEN1 E280A carriers, those who were also APOE ε4 + had greater age-related accumulation of plasma NfL beginning around age 47.5 compared to those who were APOE ε4- (Fig. 1B, C), the typical age between the onset of MCI and dementia in this cohort [25]. Age-related plasma NfL accumulation did not differ by APOE ε4 group in PSEN1 E280A mutation non-carriers in the sample’s specified age range (Fig. 1D, E).
Within the subset of PSEN1 E280A mutation carriers with cognitive data, higher plasma NfL was associated with lower scores on the API cognitive composite (ß = -0.60, p < 0.001). There was no main effect of APOE ε4 nor an interaction between APOE ε4 and plasma NfL on cognitive scores (Fig. 1F). When including age and sex as covariates, there was a non-significant trend for the NfL-cognition association to be stronger in APOE ε4 + carriers (NfL: ß = -0.24, p < 0.001; APOE ε4: ß = 0.17, p = 0.059; NfL x APOE ε4 interaction: ß = -0.18, p = 0.054).
In PSEN1 E280A mutation non-carriers, there was no main effect of APOE ε4, but plasma NfL was inversely associated with API composite scores (ß = -0.11, p = 0.031), and APOE ε4 moderated the association between NfL and cognition (ß = 0.29, p = 0.033; Fig. 1G). These relationships did not remain statistically significant when including age and sex as covariates.
Associations between APOE ε2 and plasma NfLCollapsing across age, plasma NfL accumulation was higher in PSEN1 E280A mutation carriers than non-carriers, but there were no group differences by APOE ε2 nor an interaction between PSEN1 and APOE genotypes (Fig. 2A). When including age and sex in the model, however, the main effect of APOE ε2 was significant, such that participants who were APOE ε2 + had lower levels of plasma NfL than those who were APOE ε2-, in both the PSEN1 mutation carrier and non-carrier groups [PSEN1: F(1, 1422) = 198.43, p < 0.001); APOE ε2: F(1, 1422) = 5.92, p = 0.015; PSEN1 x APOE ε2 interaction: F(1, 1422) = 1.70, p = 0.192; age: F(1, 1422) = 1204.31, p < 0.001; sex: F(1, 1422) = 10.97, p = . 001]. The age-related trajectories of plasma NfL accumulation did not differ by APOE ε2 group in PSEN1 E280A mutation carriers or non-carriers (Fig. 2B-E).
Fig. 2
Plasma NfL as a function of APOE ε2. A Boxplot showing log-transformed plasma NfL concentrations (pg/mL) in PSEN1 E280A carriers and non-carriers as a function of APOE ε2 group (black: APOE ε2+, red: APOE ε2-). B Log-transformed plasma NfL concentrations of PSEN1 E280A mutation carriers who are APOE ε2 + and APOE ε2- as a function of age. C Differences in NfL concentrations between APOE ε2 + and ε2- PSEN1 E280A mutation carriers as a function of age. D Log-transformed plasma NfL concentrations of PSEN1 E280A mutation non-carriers who are APOE ε2 + and APOE ε2- as a function of age. E Differences in NfL concentrations between APOE ε2 + and ε2- PSEN1 E280A mutation non-carriers as a function of age. F API composite score plotted by log-transformed plasma NfL concentrations in PSEN1 E280A mutation carriers stratified by APOE ε2 group. G API composite score plotted by log-transformed plasma NfL concentrations in PSEN1 E280A mutation non-carriers stratified by APOE ε2 group. In panels C and E, the shaded areas of each plot represent the 99% credible intervals around the model estimates drawn from the distributions of model fits derived by the Hamiltonian Markov chain Monte Carlo analyses. In panels F and G, plots show regression line with shaded standard error bands
In PSEN1 E280A mutation carriers with cognitive data, both higher plasma NfL and being APOE ε2- were associated with lower API Composite scores (Fig. 2F; NfL: ß = -0.67, p < 0.001; APOE ε2-: ß = -0.26, p = 0.004). Further, APOE ε2 moderated the effect of plasma NfL on cognition, such that the negative association between plasma NfL and cognition was attenuated in APOE ε2 + PSEN1 E280A mutation carriers (ß = 0.29, p = 0.001). Results were consistent when including age and sex as covariates. In PSEN1 E280A mutation non-carriers, both NfL and being APOE ε2- were associated with lower cognitive scores (NfL: ß = -0.10, p = 0.033; APOE ε2-: ß = -0.30, p = 0.008), and APOE ε2 moderated the NfL-cognition relationship (ß = 0.24, p = 0.037). The main effect of NfL and the interaction between NfL and APOE were not statistically significant after including age and sex in the model, but being APOE ε2- remained associated with lower cognitive scores (ß = -0.28, p = 0.013) (Fig. 2G).
The findings from further analyses, which excluded three non-carrier outliers, remained consistent with the initial results and are presented in Supplementary Table S6 and Figures S4 and S5.
留言 (0)