Sample collection
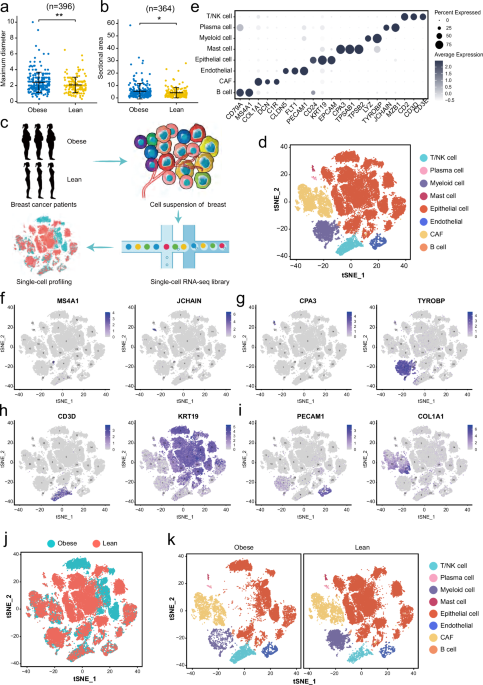
The primary untreated breast cancers used utilized in this study (Supplementary Table S1) were obtained following collected with written informed consent from all patients. For scRNA-seq analysis, three obese patients (BMI > 30) and three normal-weight BC patients (BMI < 30) were randomly selected, while four obese and four normal-weight BC patients were randomly selected for subsequent laser confocal immunofluorescence staining. Tumor tissues from 3 obese (BMI > 30) and 3 normal-weight BC patients (BMI < 30) were randomly selected for scRNA-seq, and tumor from 5 obese and 5 normal-weight BC patients were randomly selected for subsequent laser confocal immunofluorescence staining. Detailed clinical data were shown in Supplementary Table S1. In addition, clinical data of BC patients with primary invasive ductal carcinoma were collected to analyze the correlation between BMI and tumor-related clinical parameters. These patients underwent surgical resection in Qilu Hospital (Qingdao), Shandong University from January 2015 to December 2021 with written informed consent for their clinical data.
Tissue dissociation
Samples were obtained from fresh surgical resections. BC tumors were dissociated using the human Tumor Dissociation Kit (Miltenyi Biotec, Germany) following the manufacturer’s protocol. The dissociated cells were then resuspended to remove dead cells using Dead Cell Removal Kit (Miltenyi Biotec, Germany). Subsequently, the overall cell viability was confirmed to be above 85%. The cells were further resuspended for cell counting and diluted to an appropriate concentration.
Single-cell RNA-seq library preparation and sequencing
Single-cell suspensions were loaded onto 10X Chromium chip in order to capture 5000-10,000 single cells, following the manufacturer’s instructions of 10X Genomics Chromium Single-Cell 3’ kit (V3). The captured single cells underwent cDNA amplification and library construction using the standard protocol of the 3’ kit (V3). The single-cell libraries were sequenced on Illumina NovaSeq 6000 sequencing system (paired-end multiplexing run, 150 bp) by LC-Bio Technology Co., Ltd. (Hangzhou, China).
Single-cell data preprocessing and quality control
To generate a raw gene expression matrix for each sample, CellRanger (10X Genomics, version 3.1.0) was employed. The STAR algorithm (https://github.com/alexdobin/STAR) was used for mapping the reads to the human reference genome GRCh38. Subsequently, the Seurat package (version 3.1.5) was utilized for quality control (QC) of the single cells. Cells meeting the criteria of having >500 detected genes and <25% mitochondrial genes were considered to have passed QC. A total of 48,033 high-quality single cells were included for subsequent bioinformatic analysis using Seurat, which included cell normalization, principal component analysis (PCA), and cell clustering.
After removing low quality cells, we applied a global-scaling normalization method “LogNormalize” that normalized the gene expression measurements for each cell by default. To overcome the extensive technical noise in any single gene for scRNA-seq data, we then performed PCA and determined the number of PCs was used for the cell clustering. To further correct for batch effects originating from different patients, we applied the Harmony algorithm immediately after completing PCA. Harmony utilized the combined matrix of informative genes to correct for batch effects.
Identification of the major cell types and their subtypes
The clustering of major cell types and subtypes was performed with the “FindClusters” function of the Seurat. In order to identify the subtypes within each major cell type, the cells belonging to each major type were reanalyzed individually. Subsequently, major cell clusters and their sub-clusters were visualized using t-distributed Stochastic Neighbor Embedding (t-SNE), and the annotation of cell types was based on the average expression of well-recognized marker genes or highly expressed genes from related literatures of breast cancer [21, 22]. To identify genes that are specifically expressed in certain clusters or differentially expressed between clusters, the Seurat “FindAllMarkers” function was utilized. This function tested genes with a > 0.25-fold difference (log-scale) on average between the two groups of cells and detectable expression in more than 25% of cells in either of the two groups.
Single-Cell Regulatory Network Inference and Clustering (SCENIC) analysis
To investigate gene regulatory networks, we performed SCENIC analysis using the pySCENIC pipeline (v0.12.1), a fast implementation of the SCENIC pipeline as described by the developers [46, 47]. SCENIC utilizes transcription factors and cis-regulatory sequences to reconstruct gene regulatory networks [46]. Activated transcription factors (TFs) were identified in the Binary matrix, and the top differentially activated TFs in each cell population were selected using the Wilcoxon test based on the AUC matrix.
CNV analysis of epithlium
To distinguish the epithelium in obese and lean BC samples, we calculated the copy number variations (CNVs) of all epithelial cells in each sample based on the current scRNA-seq data using R package inferCNV (version 1.3.3) as described previously [48]. This package inferred the genetic profiles of each epithelial cell based on the average expression of large genes sets (101 genes) in each chromosomal region (sex chromosomes were excluded) compared to the control cells (T/NK cells). Other parameters were set as default.
In addition, the CNV and BMI data of 765 BC patients (including 711 patients with BMI > 30) from TCGA database were employed to study their correlation.
Multiplexed immunofluorescent staining
For immunofluorescence staining, breast cancer tissues were fixed in 4% paraformaldehyde, embedded in paraffin and then sectioned. Standardized procedures for dewaxing and antigen retrieval were applied to the sections. After treatment with 3% H2O2 for 15 min and blocking with 5% normal serum for 30 min at room temperature. The samples were incubated with primary antibodies for 1.5 h at room temperature and subsequently with secondary antibodies for 30 min at room temperature. Nuclei were stained with 4’, 6 diamidino-2-phenylindole (DAPI) for 15 min. Confocal microscopy was performed using a Leica ATELLARIS 5 laser scanning confocal microscope. The following antibodies were used for immunofluorescence staining: anti-IBA-1 antibody (1:200, Proteintech, 66827-1-Ig), anti-DAP12 antibody (1:200, Santa Cruz, sc-133174), anti-FABP4 antibody (1:200, Abcam, ab92501), anti-LXR alpha antibody (1:100,Abcam, ab41902), Goat-Anti-Mouse IgG H&L (1:1000, Abcam, ab150115), Goat-Anti-Rabbit IgG H&L (1:1000, Abcam, ab150077), DAPI (Solarbio, C0065).
Cell lines and siRNAs
Breast cancer cell line ZR-751 and human leukemia monocytic cell line THP-1 were cultured in RPMI 1640 (Invitrogen, Shanghai, China). Breast cancer cell line MCF7 and MDA-MB-231 was cultured in DMEM (Viva Cell, Shanghai, China). Breast cancer cell line SKBR3 was cultured in McCoy’s (Viva Cell, Shanghai, China). All the cells were purchased from Shanghai Institute of Cell Biology, Chinese Academy of Sciences, and they were authenticated and tested for mycoplasma contamination. All the media were supplemented with 10% fetal bovine serum (Viva Cell, Shanghai, China), 100 units/mL penicillin, and 100 μg/mL streptomycin (Procell, Wuhan, China). THP-1 cells (1 × 10⁶/ml) were differentiated using 200 ng/ml phorbol 12-myristate 13-acetate (PMA, Sigma-Aldrich, Shanghai, China) for 8 h. Differentiation of PMA treated cells was enhanced by removing the PMA-containing media then incubating the cells in fresh RPMI 1640 (10% FBS) for a further 16 h, before being used in the indicated experiments. The siRNA against NR1H3 (siRNA#1, Sense: 5’-GGAGUGUCGGCUUCGCAAA-3’ Antisense: 5’-UUUGCGAAGCCGACACUCC-3; siRNA#2, Sense: 5’-CACAGAGAUCCGUCCACAA-3’ Antisense: 5’-UUGUGGACGGAUCUCUGUG-3) was synthesized by TSINGKE (Beijing, China). Human NR1H3 expression plasmid GV-NR1H3 was synthesized by Genechen Co. (Shanghai, China). The negative control is referring to with a control siRNA sequence. The THP-1 cells were treated with siRNA or expression plasmid after PMA stimulation.
Co-culture experiments
Co-culture experiments were carried out using a transwell system (3.0 μm pore size, Transparent (PET) Membrane; Corning Life Sciences, Lowell, MA, USA). For experiments assessing THP-1 biology, 3.5 ×10⁴ ZR751 cells were seeded in the upper chamber with PMA-stimulated THP-1 in the bottom for 24 h. PMA-stimulated THP-1 cells cultured alone served as controls.
To obtain adipose tissue homogenate, 50 mg of pericancerous adipose tissue was transferred to a pre-cooled 1 ml RPMI 1640 (10% FBS, 1% PS) on ice. The tissues were then homogenized evenly using a sample homogenate solution. Following centrifugation at 3000 rpm for 10 min at 4 °C, the water liquid layer in the middle was retained. PMA-stimulated THP-1 were cultured with 30% conditioned medium (CM) containing adipose tissue homogenate for 24 h. There isn’t any PMA in the conditioned media given to the epithelial cell culture. Samples were obtained from fresh surgical resections.
RNA sequencing and analysis
Total RNAs were isolated from the THP-1 cells with or without NR1H3 knockdown using TRIzol LS reagent (Thermo Fisher Scientific, USA). The quality and quantity of the total RNA were assessed using Qubit 3.0 (Thermo Fisher Scientific, USA) and Agilent 2100 Bioanalyzer (Agilent Technologies, USA), respectively. The mRNA library was constructed according to the protocols of TruSeq Stranded Total RNA Library Prep Kit v2 (Illumina, USA) by Genesky Biotechnologies Inc., Shanghai (China).
The raw reads of mRNA sequencing were evaluated for quality using FastQC. The clean reads of mRNA were aligned to the human reference genome hg19 using HISAT2, and StringTie was used for transcript assembly and quantification.
RT-qPCR
Total RNAs were isolated from tissues or cultured cells using TRIzol LS reagent (Thermo Fisher Scientific, USA) and reverse-transcribed into cDNA using All-In-One 5X RT MasterMix (abm, Vancouver, Canada). Then qPCR was carried out using BlasTaqTM 2X qPCR MasterMix (abm, Vancouver, Canada). The primers was synthesized by Sangon Biotech (Shanghai, China). Sense and reverse primers were: GAPDH, Forward 5’-GGAGCGAGATCCCTCCAAAAT-3’, Reverse 5’-GGCTGTTGTCATACTTCTCATGG-3’; NR1H3, Forward 5’-G CCTTCAGAACCCACAGAGATCC-3’, Reverse 5’-ACGCTGCATAGCTCGTTCC-3’; FABP4, Forward 5’-ACTGGGCCAGGAATTTGACG-3’, Reverse 5’- CTCGTGGAAGTGACGCCTT-3’.
Chromatin immunoprecipitation and quantitative PCR analyses
Chromatin immunoprecipitation (ChIP) and quantitative PCR (qPCR) analyses were performed as described by Hyperactive pG-MNase CUT&RUN Assay Kit for PCR/qPCR (HD101-01, Nanjing, China). Calculate the circulating threshold of immunoprecipitated DNA for various samples using qPCR. Antibodies used for ChIP: normal rabbit IgG (ABcolonal, AC005), anti-H3K4me3 (ABcolonal, A22146) and anti-NR1H3 (Abcam, ab41902). Primers used for ChIP PCR analyses: FABP4, Forward 5’-ACTGGGCCAGGAATTTGACG-3’, Reverse 5’- CTCGTGGAAGTGACGCCTT-3’; SREBP1, Forward 5’-ACTTCTGGAGGCATCGCAAGCA-3’, Reverse 5’-AGGTTCCAGAGGAGGCTACAAG-3’.
Western blot
Protein lysates were obtained from THP-1 cells transfected with siRNA. The lysates were separated by sodium dodecyl sulfate polyacrylamide gel electrophoresis (SDS-PAGE) and transferred on polyvinylidene difluoride (PVDF) membranes. After being blocked with 5% fat-free dry milk, the membranes were incubated with using anti-β-actin (Gene Tex, Irvine, CA, USA), anti-NR1H3 (Abcam, Shanghai, China), anti-FABP4 (Abcam, Shanghai, China), anti-SREBP1 (ABcolonal, Wuhan, China).
ELISA
Culture supernatant from from THP-1 cells transfected with siRNA were obtained via centrifugation (10 min, 4 °C, 3000 RPM). We used enzyme-linked immunosorbent assay (ELISA) kits for FABP4 (BOSTER, Wuhan, China). All plates were analyzed using the SpectraMax i3x multimode reader (Molecular Devices, Shanghai, China) at 450-nm wavelengths, according to the manufacturers’ recommendations.
CCK-8 cell proliferation assay
To assess cell proliferation, MCF7, ZR-751, MDA-MB-231 and SKBR3 cell lines were cultured with 30% conditioned medium (CM) with or without siNR1H3 from PMA-stimulated THP-1 for 24 h. Then, 5 × 10³ cells/well were seeded in a 96-well plate and were cultured with 30% CM every 24 h. Cell proliferation was measured at OD450 nm using the CCK-8 kit (Dojindo CO. Ltd., Kumamoto, Japan) every 24 h. There isn’t any siRNA or PMA in the conditioned media given to the epithelial cell culture.
Transwell assay
Briefly, MCF7 and ZR751 cell lines were cultured with 30% CM with or without siNR1H3 from PMA-stimulated THP-1 for 24 h. Then, 3.5 × 10⁴ MCF7 or 5 × 10⁴ ZR751 in 200 μL of serum-free medium were added to the upper chambers of the Transwell plate, and the lower chambers were filled with 600 μL of medium containing 20% FBS as a chemoattractant. After 24 h, the migrated cells were fixed in 4% paraformaldehyde and stained with 0.1% crystal violet, and the non-migratory cells on the upper surface of the chambers were removed by a cotton swab. Then, at least four random fields were selected and observed by microscopy (Olympus, Japan). There isn’t any siRNA or PMA in the conditioned media given to the epithelial cell culture.
Tumor challenges
To monitor the progression of tumors in lean and obese mice, we followed the following experimental procedure. Six-week-old female C57BL/6 mice were randomly divided into two groups, with 8 mice in each group, and fed either a low-fat diet (LFD) or a high-fat diet (HFD) for a duration of 13 weeks. Subsequently, 5*105/100ul (PBS) E0771 cells were orthotopically implanted into the mammary fat pad of the lean and obese mice, respectively. Tumor growth was measured using calipers, and the tumor volume was calculated using the formula 0.5 * (large diameter) * (small diameter)2 twice a week. The mice were then continuously fed with their respective diets, either LFD or HFD, for an additional 21 days. After the designated period, tumor tissues were collected for frozen sections, and immunofluorescence analysis was performed. For the immunofluorescence staining, the following antibodies were utilized: anti-DAP12 antibody (1:200, Abcam, ab283679) and anti-FABP4 antibody (1:200, Santa Cruz, sc-261529). The researchers were informed of the grouping during the experiment and when evaluating the results.
Statistical analysis
All data processing was performed using R 3.6.1 software. The statistical methods and threshold for corresponding analysis were explicitly described in the results or figure legends or Materials and Methods. All statistical results with a p-value < 0.05 were considered to indicate statistical significance.


留言 (0)