Cell lines
Human prostate cancer PC3U cells are a subclone of PC3 cells, and they express more TGFβ receptors than PC3 cells, originally described in Franzén et al. [24]. PC3 is a cell line initiated from a bone metastasis of a grade IV prostatic adenocarcinoma from a 62-year-old, White, male. PC3U cells are more invasive than PC3 cells, and the similarities between PC3 and PC3U cells have been examined by whole genome sequencing reported in Zang et al. [25]. Human prostate cancer DU-145 cells which are derived from the brain metastasis of prostate cancer were purchased from ATCC, Cat. 30-2003. Human lung cancer cell line A549 was purchased from Sigma, Cat. R0883.
Cell culture
The human prostate cancer cell line PC3U and human lung cancer cell line A549 were grown in RPMI-1640 (Sigma, Cat. R0883) with l-glutamine (Sigma, Cat. G7513), and DU-145 was grown in EMEM (ATCC, Cat. 30-2003) supplemented with 10% fetal bovine serum (FBS) (Sigma, Cat. F7524). The cells were starved for 12–18 h in a medium supplemented with 1% FBS before stimulation with TGFβ1 (Prospec, Ness-Ziona, Israel) at a concentration of 10 ng/mL. All experiments were performed with mycoplasma-free cells.
Antibodies and reagents
The antibody against TβRI (Cat. SC-398) was from Santa Cruz, and the rabbit monoclonal antibody against TβRI (Cat. 235578) was from Abcam (Cambridge, UK) its specificity was verified by knockout cells. The antibodies against HA (Cat. 2367S), pSmad2 (Cat. 3108L), Smad2 (Cat. 3103S), and pSmad3 (Cat. 9520S) were purchased from Cell Signaling Technology. Antibodies against Smad3 (Cat. ab40854) and ITGAV (Cat. ab179475) were from Abcam, THBS1 (Cat. AF3074) from R&D System, Paxillin (Cat. 10029-1-Ig) and E-cadherin (Cat. 610182) from BD Biosciences, β-actin (Cat. A1978) from Sigma, AE1/AE3 (Cat. M351501-2) from Agilent, Alexa fluor 647 (Cat. A31571) from Invitrogen, and Alexa fluor 488 (Cat. 705-546-147) and Cy3 (Cat. 711-166-152) from Jackson ImmunoResearch. 4,6-Diamidino-2-phenylindole dihydrochloride (DAPI) (Cat. 5087410001) was from Merck. Pefabloc was from Roche (Mannheim, Germany), and PageRuler prestained protein ladder was from Thermo Scientific. Plasmid pGEM2hTSP-1 was a gift from Jack Lawler (Addgene plamid # 12993).
RNA-seq and bioinformatics analysis
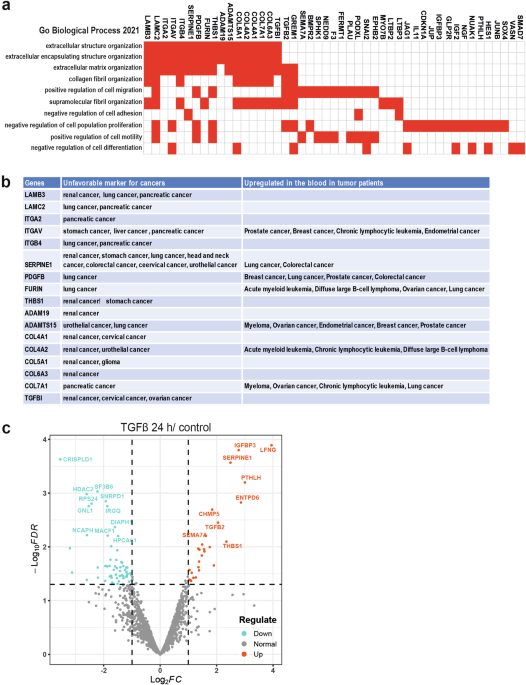
RNA was extracted from PC3U cells or A549 cells treated with or without TGFβ1 using the AllPrep DNA/RNA/Protein Mini Kit (QIAGEN, Cat. 80004) and subjected to RNA-seq at Novogene (Novogene Bioinformatics Institute, Beijing, China). The DEGs were analyzed with support from the Bioinformatics Infrastructure for Life Sciences (BILS). The top DEGs in PC3U cells and A549 cells that were upregulated (fold change > 2) by TGFβ1 treatment were used for GO enrichment analysis in the online tool Enrichr [33,34,35].
Secretome analysis
To collect the secreted proteins, the cells were washed two times with PBS and then cultured with TGFβ1 for 24 h in a medium without FBS. The culture media were collected and centrifuged at 1000 × g for 10 min to remove the cell debris. The supernatant was carefully removed, concentrated from 50 mL to 500 µL with Amicon Ultra-15 (Sigma, Darmstadt, Germany), and frozen at −20 °C for LC–MS/MS.
Samples were digested into peptides using a modified SP3 protocol [36, 37]. Briefly, samples were denatured in lysis buffer (2% sodium dodecyl sulfate (SDS), 20 mM tris(2-carboxyethyl) phosphine hydrochloride (TCEP)). SpeedBeads (Sigma Aldrich, beads A, Cat. GE45152105050250; beads B, Cat. GE65152105050250) were mixed with each sample and transferred onto a filter plate (Sigma Aldrich, Cat. MSGVN2210). The samples were washed to remove the unbound fraction and then digested overnight at room temperature with shaking. After centrifugation, the flowthrough containing peptides were collected and the bound peptides were eluted from the beads by adding 10 µL 2% DMSO. The obtained fraction was pooled with the previous flowthrough. Peptides were desalted on the Oasis HLB plate (Waters, Cat. 186001828BA) and dried.
Dried peptides were dissolved in 0.1% formic acid, and 1 µg peptide was used to obtain the mass spectrum using Vanquish Neo (Thermo Scientific). Trapping column PEPMAP NEO C18 (Thermo Scientific) and analytical column nano EaseTM M/Z HSS C18 T3 (Waters) were used for LC–MS/MS. Data acquisition was carried out on an Exploris 480 (Thermo Scientific) in a data-dependent method. Raw data were analyzed using FragPipe (version 18), and R (version 4.2.2) was used for statistical analysis and volcano plots. The data were normalized using the vsn package [38], and the differentially expressed proteins were analyzed using the limma package. The differences in protein abundances were statistically determined using the Student’s t-test moderated by Benjamini–Hochberg’s method.
Generation of TβRI-deficient cell line
The CRISPR mCas9 plasmid was from Addgene (PX462) [22], and two gRNA sequences targeting exon 2 of TβRI were chosen: (sense, TTGACTTAATTCCTCGAGAT and antisense, ATCTCGAGGAATTAAGTCAAC; sense, GTTGTGTATAACTTTGTCTG and antisense, CAGACAAAGTTATACACAACC). The complementary oligonucleotides were annealed, phosphorylated, and cloned into the PX462 vector, and the correct insertion of the gRNA was verified by sequencing. The gRNA-mCas9 plasmids were transfected into PC3U cells using xTREMEGene9 DNA transfection reagent (Roche) in 6-well plates. After transfection for 48 h, puromycin was used for selection in 10-cm dishes until the cells grew confluent. Single-cell clones were produced by serial dilution in a 96-well plate and screened to obtain the TβRI-deficient cell line.
PCR, single-strand conformation polymorphism analysis, and Cel-1 assay
Genomic DNA and total RNA were exacted from cells using ALLprep (Qiagen). The Cas9-targeted region in exon 2 of the TβRI gene was amplified by PCR. As in our previous report [25], PCR products were denatured and loaded on a pre-cast 12.5% acrylamide gel. For the Cel-1 assay (also named Surveyor nuclease assay), PCR products were denatured and re-annealed, digested with SURVEYOR Nuclease (Transgenomic, Omaha, USA), separated on the 10% polyacrylamide gel, and visualized by the silver staining method.
RT-PCR, qPCR, and primers
Purified total RNA (2 μg) was used as a template for cDNA synthesis in the Thermoscript RT-PCR system (Invitrogen Cat. 11146016) according to the manufacturer’s instructions. Purified cDNA was amplified and measured with the Stratagene RT-PCR system, and SYBR Green (Applied Biosystems Cat. 4385612) was used for qPCR. The primers used were: TβRI, forward primer (FP), GTGACAGATGGGCTCTGCTT, reverse primer (RP), AAGTGCTGCTCTGAATCCCC; Smad7, FP, CATGGTGTGCGGAGGTCAT, RP, GAGCGCAGATCGTTTGGTC; SERPINE1, FP, AGAGCGCTGTCAAGAAGACC, RP, AGTTCTCAGAGGTGCCTTGC; Fibronectin1 (FN1), FP, CCGTGGGCAACTCTGTC, RP, TGCGGCAGTTGTCACAG.
Sequencing analysis
RNA was purified from A9 cells, reverse transcribed into cDNA, and the Cas9-targeted region PCR-amplified for sequencing. Sequencing PCR (BigDye Terminator v 3.1 cycle sequencing kit) was performed using this amplified PCR product. The sequencing results were analyzed by Sequence Scanner v 1.0 software. Sequencing primers were: FP, GTGACAGATGGGCTCTGCTT; RP, AAGTGCTGCTCTGAATCCCC.
Reconstitution of HA-tagged T
βR1 in A9 cells
For reconstitution of cells with C-terminally HA-tagged wild-type TβR1, 5 × 10⁵ mutant PC3U (TβR1-deficent) cells from clone A9 were transfected with plasmid bearing the insert using the xTREMEgene9 DNA transfection reagent. After transfection for 24 h, Geneticin (500 μg/mL) was added to the cells for positive selection of transfected cells. Dead cells were continuously removed, and positive selection was maintained until the cells were confluent, after which the selection with Geneticin was stopped. Stable expression of HA-TβR1 was verified by western blotting the protein extract.
CAGA-luciferase reporter assay
As reported previously [39, 40], PC3U wild-type and gene-modified cells were transiently transfected with the TGFβ/Smad-responsive promoter CAGA reporter pCAGA12-MLP-luc promoter report for 36 h prior to TGFβ treatment for 16 h. pCMV-β-gal was transfected as a reference and other constructs were included as noted in the figure legends. Luciferase activity was measured in triplicate samples using the enhanced luciferase assay kit following the manufacturer’s protocol (BD Biosciences). Normalized promoter activity data are plotted in bar graphs as the mean ± SEM of at least three independent experiments.
Microarray analysis
As previously reported [41], total RNA from wild-type, mutant, and reconstituted HA-TβR1 were extracted using ALLprep (Qiagen). After evaluation of RNA quality using the Agilent RNA 6000 Nano Kit and Agilent 2100 Bioanalyzer, 750 ng RNA was used for the preparation of double-stranded cDNAs, and biotinylated cRNAs were hybridized to an Illumina Human HT-12 Beadchip (Illumina) according to the protocol. Microarray data were analyzed using GenomeStudio and DAVID Bioinformatics Resources.
siRNA transfection
SMART pool siRNA for TβRI or THSB1 and a non-specific control siRNA were purchased by Dharmacon Research (Lafayette, CO). The siRNA was transfected using Oligofectamine (Invitrogen, Carlsbad, CA) according to the manufacturer’s protocol as previously reported [11].
Immunoblotting and protein interactions
The cultured cells were washed once with ice-cold PBS and lysed in ice-cold lysis buffer (150 mM NaCl, 50 mM Tris pH 8.0, 0.5% (v/v) DOC, 1% (v/v) NP40, 10% (v/v) glycerol, 1 mM aprotinin, 1 mM Pefabloc, and 2 mM sodium orthovanadate). After centrifugation, the supernatant was collected and protein concentrations were measured by a BCA protein measurement kit (Thermo Scientific). An equal amount of protein from the total cell lysate was separated by SDS-PAGE and transferred onto polyvinylidene difluoride membranes. The membranes were blocked for 1 h with 5% BSA in Tris-buffered saline with 0.1% Tween 20 (TBS-T) and then incubated with specific antibodies overnight at 4 °C. The membranes were then washed three times with TBS-T, incubated for 1 h with a secondary horseradish peroxidase-conjugated antibody, and developed with ECL Western blotting detection reagent. Bands were detected using the Amersham Imager RBG system (GE Healthcare, Buckinghamshire, UK).
To detect protein–protein interactions, the cell lysates from HA-TβR1 reconstituted cell lines were subjected to immunoprecipitation with anti-HA antibodies, followed by immunoblotting with THBS1, ITGAV, and HA antibodies.
Wound-healing assay
Cells grown on sterile, uncoated cover slides in a serum-starved condition were scratched using a 1000 µL pipette tip. After washing with PBS, the cells were treated with TGFβ1 for the indicated time periods, and then fixed for immunofluorescent staining or in situ PLA.
Immunofluorescence staining of cultured cells
Cells were grown on the sterile glass microscope slides in a 6-well plate under the indicated conditions. The slides were washed four times with PBS, fixed in 4% paraformaldehyde for 30 min at room temperature, washed four times in PBS, and subsequently permeabilized in 0.2% Triton X-100 in PBS for 10 min and blocked in 10 mM glycine overnight. The slides were incubated with the primary antibodies in a humid chamber for 1 h at room temperature. After washing with PBS, the slides were incubated with secondary antibodies labeled with fluorescent dye for 45 min at room temperature, and then with DAPI (Invitrogen, Oregon, USA) for 5 min. Mounting medium was added to the slides for imaging. The samples were analyzed under a fluorescence microscope (Axioplan 2; Carl Zeiss Microimaging, Inc.) with a digital camera (C4742-95; Hamamatsu) using a Plan-neofluar 63× objective lens (Carl Zeiss MicroImaging, Inc.). Primary images were acquired with the camera’s QED software at room temperature.
In situ proximity ligation assay
In situ PLA was performed according to the protocol for the Duolink PLA probe and Duolink Detection Kit (Sigma). Briefly, cells were fixed on the glass cover, blocked, and incubated with two primary antibodies produced in different species overnight at 4 °C. After washing, the cells were incubated with two sets of probes conjugated with secondary antibodies. The probes were then ligated with a bridging probe in a proximity-dependent manner, which allowed rolling-circle amplification. Finally, the interacted proteins could be visualized as fluorescent dots under the microscope.
Invasion assay
Invasion assays were carried out in Growth Factor Reduced Corning Matrigel Invasion Chambers (Cell Biolabs, Inc., San Diego, CA). The Matrigel layer of the cell culture inserts was rehydrated in 500 μL serum-free RPMI-1640 media, and 2.5 × 10⁴ cells were seeded into the upper side of the chambers in 1% serum RPMI-1640. The lower wells of the invasion plates were filled with 750 μL RPMI containing 10% FBS. Non-invasive cells were removed from the upper chamber after incubation for 48 h, and the invasive cells were photographed under a Leica DMR light microscope after staining with crystal violet cell stain solution. Colorimetric quantification was performed by transferring inserts into 200 μL of extraction solution for 10 min. The optical density (OD) was measured at 560 nm in a 96-well plate by a Multiskan FC Microplate Photometer (Thermo Scientific).
Xenograft animal experiments
Male athymic nude mice (Hsd:Athymic Nude- Foxn1nu, Harlan) were purchased from Harlan Laboratories, UK (5–6 weeks of age) and maintained at the animal facility at Umeå University. All animal experiments were approved by the Umeå Ethical Review Board in full agreement with the Swedish Ethical Review Act (Approval ID: A26-2022).
As our previous report [25], this orthotopic animal model is reproducible. Briefly, mice were grouped randomly, 2% isoflurane was used to anesthetize the mice and the prostate exposed via an abdominal incision. 1 × 10⁵ wild-type or mutant PC3U cells were injected into the central prostate. The mice were monitored, and body weight was measured twice a week. Following the Swedish Ethical Review Act, the animals will be sacrificed when they show illness or lose weight sharply, otherwise, 4 weeks after the injection is the earliest suitable time to sacrifice the animals. Tumors and sentinel lymph nodes were resected and weighed. Small portions of the tumor tissues were frozen in liquid nitrogen for protein and RNA extraction. The remaining tumor tissues and lymph nodes were fixed in formalin and embedded in paraffin. The morphological evaluation under light microscopy is performed by another researcher as double-blind.
Immunohistochemistry staining for paraffin-embedded sections
Paraffin-embedded sections were rehydrated in xylene twice for 10 min each; 100% ethanol for 10 min; 95%, 80%, 70% ethanol, and deionized H2O for 5 min each; and then in PBS for 10 min. Thereafter, the sections were treated with Antigen Retrieval Reagent (Histolab, Cat. BC-DV2004MX; Cat. HTR1001M) at 95 °C for 5 min and then rinsed with PBS. The sections were kept in 0.75% H2O2/75% methanol for 30 min, washed twice with PBS, and blocked in 5% normal goat serum for 1 h at room temperature. The sections were incubated with primary antibodies overnight at 4 °C. After being washed with PBS three times for 5 min each, the sections were incubated with a secondary antibody (DAKO Envision system, Denmark) for 45 min at room temperature, followed by three washes in PBS. The sections were then developed using the Betazoid DAB Chromogen Kit (Histolab, Cat. BDB2004L), counterstained with hematoxylin, and mounted in an aqueous mounting medium (Vector Laboratories). Digital images were acquired by scanning with Pannoramic 250 Flash II (3DHistech, Hungary) and analyzed by ImageJ software. Human tissue microarray sections (Cat. PR1921c, PR208a) were purchased from TissueArray, US Biomax.
Immunofluorescent staining for paraffin-embedded sections
The paraffin-embedded sections with prostate cancer were kindly offered by the Department of Medical Bioscience, Pathology at Umeå University Hospital. The Umeå Ethical Review Board granted ethical permits to use decoded, tumor tissues to generate tissue slides in full agreement with the Swedish Ethical Review Act. As described above, the sections were rehydrated, retrieved, and blocked, and then were incubated with primary antibodies overnight at 4 °C and secondary antibodies for 45 min at room temperature. Finally, the sections were washed with PBS three times each for 5 min, mounted with mounting media with DAPI, and visualized with a fluorescence microscope (Axioplan 2; Carl Zeiss Microimaging, Inc.).
Quantitative assessment
The digital images were first scored by the proportion of stained cells multiplied by the intensity of staining. The proportion of stained cells was graded into six levels (1, 0–4%; 2, 5–19%; 3, 20–39%; 4, 40–59%; 5, 60–79%; 6, 80–100%), and the intensity of staining was graded into four levels (0, negative; 1, weak; 2, intermediate; 3, strong). Finally, THSB1 immunoreactivity was scored as four grades (grade 0, 0; grade 1, 1–6; grade 2, 7–12; grade 3, 13–18). Tukey’s multiple comparisons test was performed for statistical analysis.
Statistical analysis
Two-tailed unpaired Student’s t-test was performed for the two groups comparison with normal distribution. The Mann–Whitney U test was used for non-parametric data. p ≤ 0.05 was considered statistically significant. Error bars represent the standard deviation (SD) of the mean, unless otherwise is indicated. Statistical tests and the number of repeats are described in the figure legends.


留言 (0)