
記住我

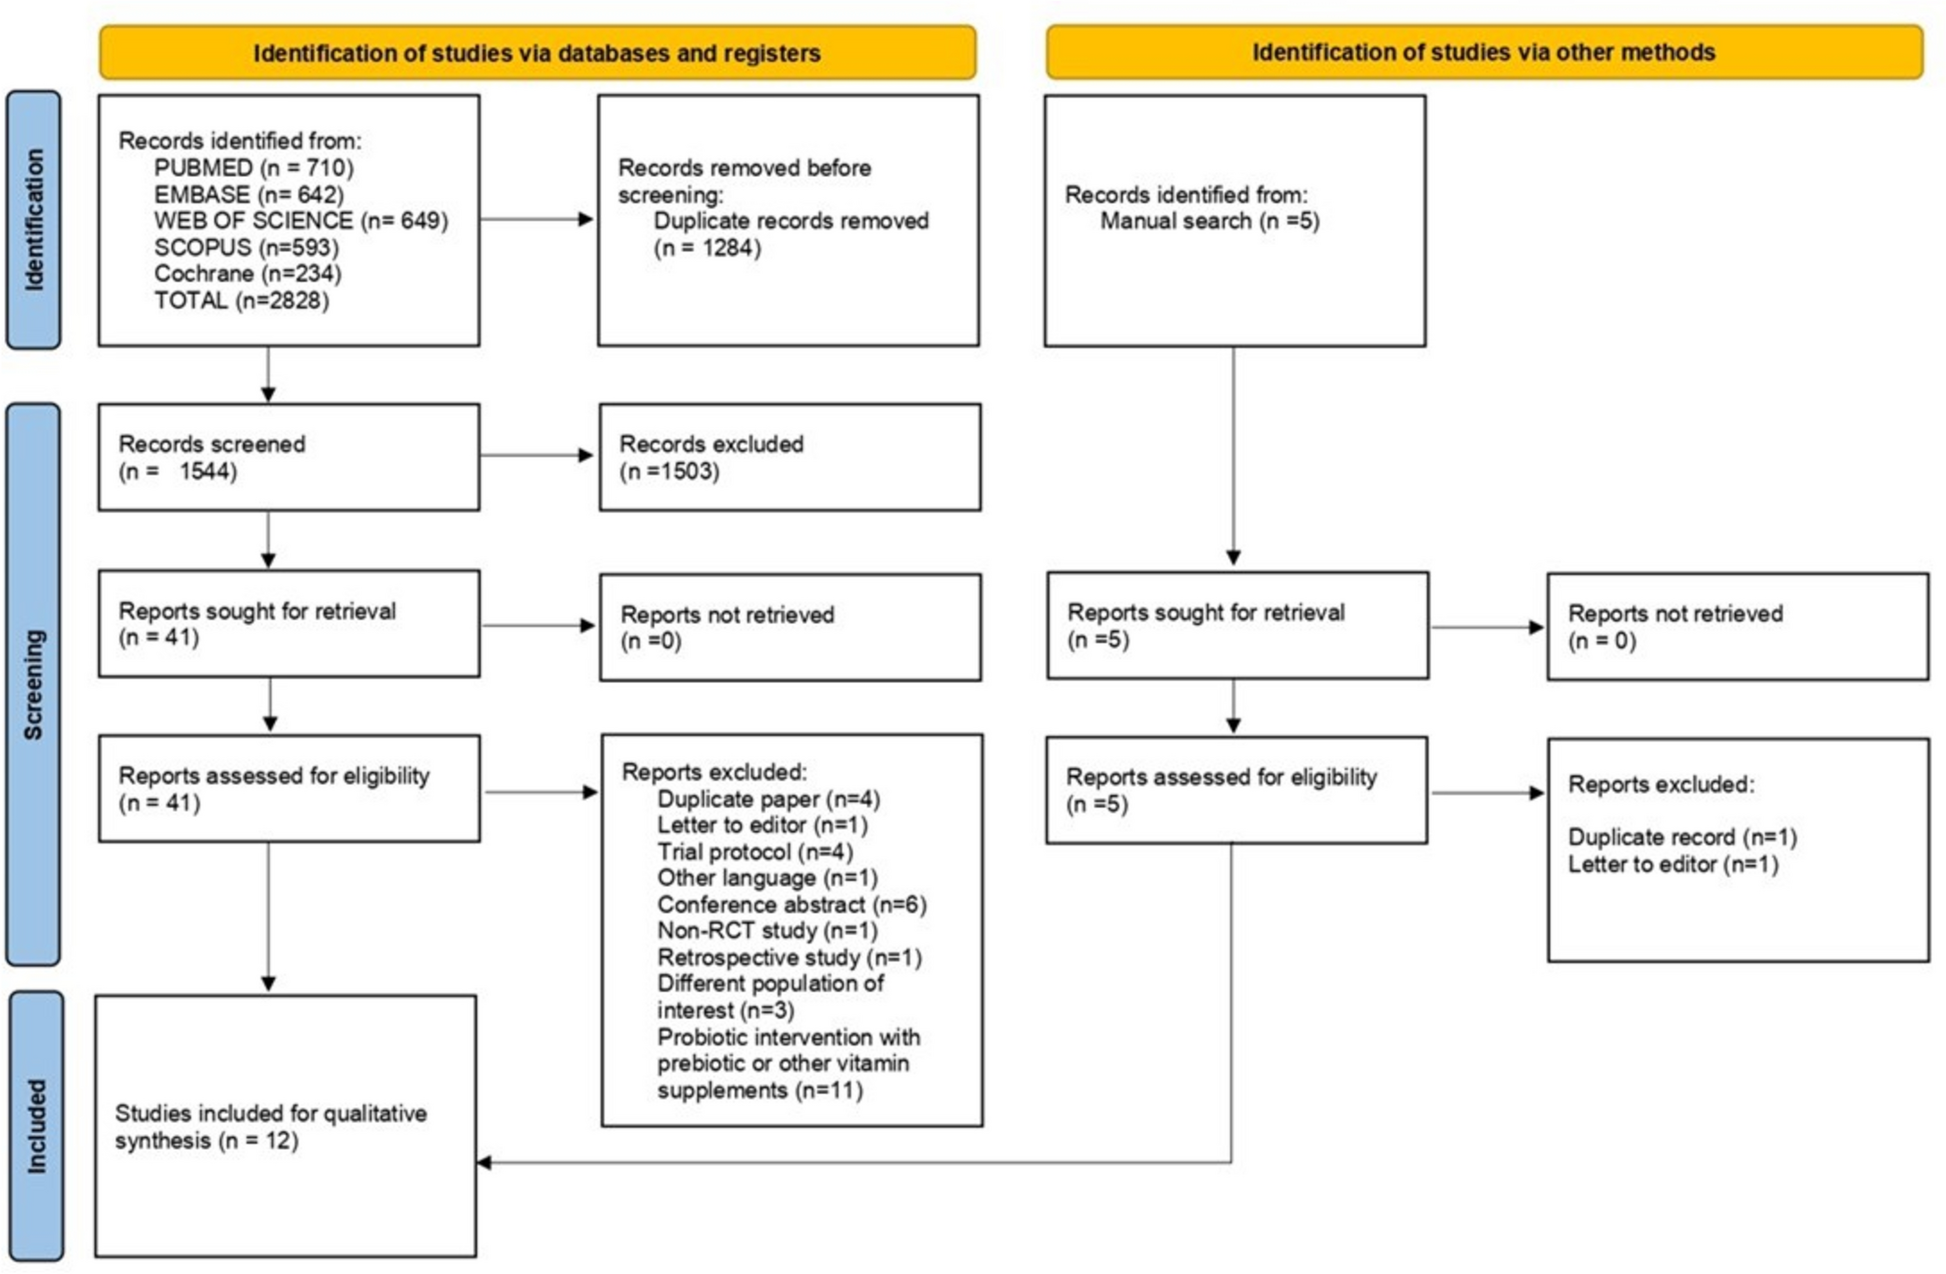

Overall, 49 patients were screened, of whom 42 were enrolled and dosed with study treatment; 23 new starters entered epoch 1, and 19 pretreated patients entered epoch 2 (Fig. 2). The overall mean (standard deviation [SD]) duration in the study was 15.5 (3.6) months, with a mean (SD) fSCIG 10% exposure of 14.4 (4.0) months. Baseline characteristics were broadly similar between new starters and pretreated patients (Table 1).
Fig. 2
Patient disposition. †22 of 23 new starters completed epoch 1, and continued and completed epoch 2. fSCIG, hyaluronidase-facilitated subcutaneous immunoglobulin
Table 1 Baseline demographics and disease characteristicsPrimary outcome: noninfectious treatment-related serious or severe adverse eventsNo noninfectious or infectious treatment-related SAEs were reported across the entire study. Only two severe treatment-related treatment-emergent AEs (TEAEs) (infusion site pain, emotional distress) were reported in a new starter who discontinued epoch 2, with an overall rate of < 0.1 events per infusion, per patient, and per patient-year. Both events were noninfectious, and the patient had a history of self-harming and several ongoing medical conditions including developmental delay, anxiety, and attention deficit hyperactivity disorder. Following discontinuation in epoch 2, the patient entered epoch 3 and went on to complete the study (see Supplementary results, Additional file 1 for additional details).
Other safety and tolerability outcomesIn total, 152 noninfectious TEAEs were reported in 29 patients (69.0%) (Table 2); 102 TEAEs were reported in 18 new starters (78.3%) and 50 in 11 pretreated patients (57.9%). Forty-one local noninfectious TEAEs, of which 36 (87.8%) were mild, were reported in 14 patients (33.3%), and 111 systemic TEAEs, of which 95 (85.6%) were mild, were reported in 25 patients (59.5%).
Table 2 Summary of noninfectious treatment-emergent adverse eventsRates of noninfectious TEAEs per infusion, per patient, and per patient-year were 0.2, 3.6, and 2.9, respectively. Overall local TEAE rates per infusion, per patient, and per patient-year were < 0.1, 1.0, and 0.8, respectively, which were higher among new starters (< 0.1, 1.7, and 1.3, respectively) than pretreated patients (< 0.1, 0.2, and 0.1, respectively). The most frequently reported local AE was infusion site pain, predominantly in new starters (Table 2). Systemic TEAE rates were comparable between patient groups (new starters: 2.2 events per patient-year; pretreated patients: 2.0 events per patient-year). The most commonly reported individual systemic AEs were cough and pyrexia across both groups (Table 2).
In total, 49 noninfectious adverse reactions were reported in 15 patients (35.7%) with a rate per infusion of < 0.1, with higher numbers reported in new starters (42 events in 12 patients; 52.2%) than in pretreated patients (7 events in 3 patients; 15.8%).
A total of 63 treatment-related/temporally associated TEAEs were reported in 19 patients (45.2%), with a rate per infusion of < 0.1, and with a lower overall number of events in pretreated individuals (11 events in 6 patients; 31.6%) than in new starters (52 events in 13 patients; 56.5%).
Overall, 8 serious TEAEs (including infections) were reported in 7 patients (16.7%), consisting of one event each of acute sinusitis, dental caries, idiopathic orbital inflammation, inflammatory bowel disease, pharyngitis, pilonidal cyst, pneumonia, and pyrexia.
ImmunogenicityNo patients developed binding anti-rHuPH20 antibodies with a titer of ≥ 1:160; therefore, no individuals were assessed for neutralizing anti-rHuPH20 antibodies.
InfectionsOverall, 78 treatment-emergent infections were reported in 32 patients (76.2%), with 46 reported in 17 new starters (73.9%) and 32 reported in 15 pretreated patients (78.9%).
Rates of all infections per infusion and per patient-year were < 0.1 and 1.5, respectively, with rates similar across both fSCIG 10% new starters and pretreated patients. The most frequently reported infections (occurring in ≥ 10% of patients across groups) were rhinitis (14 events in 8 patients [19.0%]), gastroenteritis (7 events in 5 patients [11.9%]), and nasopharyngitis (6 events in 5 patients [11.9%]).
Only a single ASBI (bacterial pneumonia) was reported in the entire study (< 0.1 event per patient-year). This occurred in a new fSCIG 10% starter (male, aged 16 years at the time of event) who was hospitalized owing to pneumonia. This event was of moderate severity and assessed by the site investigator as unrelated to fSCIG 10%, with the patient’s underlying agammaglobulinemia proposed as an alternative etiology. The infection was treated using intravenous rehydration therapy and antibiotics (14-day course of oral ciprofloxacin 400 mg twice daily). The patient’s serum IgG trough level closest to the timing of the event was 8.12 g/L (48 days prior to onset of the ASBI).
Serum IgG trough levelsOverall, no substantial differences in serum IgG trough levels occurred between patient groups, with levels remaining stable throughout epoch 2 (Fig. 3). Overall mean (SD) and median (range) serum total IgG levels for all 42 patients enrolled and dosed were 8.8 (2.0) g/L and 8.9 (4.9–13.1) g/L at baseline, and 8.5 (2.7) g/L and 8.7 (1.4–15.9) g/L at 1 year. The slight serum IgG trough level decrease observed at month 12 of epoch 2 could be attributed to the critically low serum IgG trough level (1.4 g/L; change from baseline: − 8.0 g/L) developed by an 11-year-old male patient pretreated with fSCIG 10%, potentially due to newly-diagnosed Crohn’s disease (as reported by the treating physician) at the month 12 visit of epoch 2. This event was reported as an unrelated TEAE, and following management of the AE, the patient’s serum IgG trough level had improved by study completion (6.8 g/L).
Fig. 3
Mean (SD) concentration–time profile of total serum IgG trough levels over time. E2M0, epoch 2 month 0; E2M6, epoch 2 month 6; E2M12, epoch 2 month 12; IgG, immunoglobulin G; SD, standard deviation
Administration characteristicsIn total, 795 infusions were administered (464 in new starters; 331 in pretreated patients), with an overall mean (SD) infusion duration of 89.0 (34.5) minutes and mean (SD) number of infusions per patient of 18.9 (5.3). The mean (SD) number of infusions was 1.3 (0.2), with a median (range) of 1.2 (1.0–1.7) infusions per month. The mean (SD) number of infusion sites per month was 1.7 (0.8), and the median (range) number of sites per month was 1.5 (0.3–3.0). Overall, the mean (SD) infusion volume was 139.7 (89.8) mL/site, the mean (SD) maximum infusion rate was 177.6 (83.0) mL/hour/site, and 57.1% of patients received a maximum infusion rate of up to 300 mL/hour/site. In total, 10 patients (23.8%) (6 [26.1%] new starters and 4 [21.1%] pretreated patients) had infusions that changed in rate; 3 patients (7%) (all new starters) had infusions interrupted, and 1 patient (2%) (new starter) had infusions stopped owing to severe AEs (infusion site pain, emotional distress).
HRQoL and HCRUAt baseline, most patients responding to the Treatment Preference Questionnaire preferred treatment administration at home (14/15 patients; 93.3%); responses were similar among new starters and pretreated patients. At the end of epoch 2, of the 20 patients who responded, all reported that they would choose to continue receiving fSCIG 10% (see Supplementary results, Additional file 1).
Improvements from baseline in some domains and total scores of the 9-item Treatment Satisfaction Questionnaire for Medication, Pediatric Quality of Life Inventory, and European Quality of Life 5-Dimension questionnaires were also observed at the end of epoch 2. No conclusive findings could be determined with regard to HCRU. Further information on HRQoL and HCRU data is provided in Supplementary results, Additional file 1 and Supplementary Tables 1–4, Additional files 2–5.
留言 (0)