
記住我
Our research complies with all relevant ethical regulations. Refer to each specific section for details in the committee and institution that approved the study protocol.
Production of ISB 2001 and other antibody constructsISB 2001 and other antibody constructs were expressed transiently in CHO-S cells (cGMP banked, Invitrogen, cat. no. A1136401). Typically, cells were prepared at 8 million cells per ml in CD-CHO medium (Gibco). Cells were then co-transfected with engineered chains vectors and a vector encoding Epstein–Barr virus nuclear antigen‐1 (EBNA‐1) using polyethyleneimine (PEI) at 37 °C. Four hours post-transfection, the cell culture was diluted 1:1 in PowerCHOTM 2 (Lonza) supplemented with 4 mM l-glutamine and incubated for 10 days with orbital shaking at 32 °C, 5% CO2 and 80% humidity. Clarified cell culture supernatants containing the recombinant proteins were prepared by centrifugation followed by filtration. Antibodies were purified by protein A10, followed by a second step of purification by cation exchange chromatography to reach monodispersity >95%, as judged by analytical SE-HPLC. ISB 2001 could be made available upon agreement.
Expression vectors for teclistamab and alnuctamab were synthesized using publicly available sequences information. Molecules were produced transiently in CHO-S cells. Teclistamab was expressed as two separate monoclonal antibodies with anti-BCMA or anti-CD3 binding domains and further reconstituted60. For the preparation of the 2 + 1 CrossFab IgG alnuctamab, cells were transfected with the four corresponding expression vectors, using an optimal expression vector ratio6. Antibodies were purified as above and then transferred to an appropriate buffer.
Production of EM801 (83A10-TCBcv) in stable HD-BIOP3 poolsEM801 was deemed to be 83A10-TCBcv, described in WO2018083204 as per the data comparison between WO2018083204 and a published article6. Sequences of 83A10-TCBcv were extracted from WO2018083204. In brief, HD-BIOP3 cells were electroporated (Neon electroporation system, Thermo Fisher) with the ATUM Leap-In transposase mRNA and a donor vector containing the genes for the expression of the two light chains and two heavy chains of 83A10-TCBcv. These genes, as well as the glutamine synthetase gene (selection marker), were flanked by two inverted terminal repeats for transposase-driven integration in the host cell’s genome. Selection was performed by transferring cells in a glutamine-free medium and carried out until cell recovery (viability >90% and 20–25-h doubling time). After selection, a 12-day fed-batch production was performed in a shake flask (37 °C, 5% CO2, 80% humidity and 150 rpm), with a temperature shift to 32 °C on day 4. At the end of the process, clarified cell culture supernatants containing the recombinant proteins were prepared by centrifugation followed by filtration. EM801 was purified as described in the previous section.
Biophysical characterization of antibodiesSE-HPLC was run on a TSKgel G3000SWXL 7.8 mm × 30 cm L column with 5-μm particles and 250 Å pores (Tosoh Bioscience) at room temperature with 0.1 M sodium phosphate buffer, 0.15 M sodium chloride, pH 6.8 as eluent at 1 ml min−1 flow rate on an HPLC Alliance 2695 (Waters) or an Acquity Arc HPLC (Waters) with column heater and either UV/Vis detector (2487 or 2489 from Waters) or PDA detector (2996 or 2998 from Waters). Capillary gel electrophoresis was performed on a Beckman Coulter PA 800 system with DAD/PDA detector (Diode Array Detector/Photodiode Array Detector). The IgG Purity kit (Beckman Coulter) was used according to the manufacturer’s instructions. Samples were desalted before the run and mixed with iodoacetamide (Sigma-Aldrich) for nonreduced samples or with β-mercaptoethanol (Sigma-Aldrich) for reduced samples. Resulting electropherograms were analyzed and integrated using the Empower software (Waters). Calorimetric measurements were carried out on a VP-DSC differential scanning calorimeter or a MicroCal PEAQ-DSC differential scanning calorimeter (Malvern Instruments) using a 1 °C min−1 heating rate. ISB 2001 was used at a concentration of 1–2 mg ml−1 in PBS. The molar heat capacity of the molecule was estimated by comparison between duplicate samples containing identical buffer, from one of which the protein had been omitted. The partial molar heat capacities and melting curves were analyzed using standard procedures (non-two-state model) in the manufacturer software.
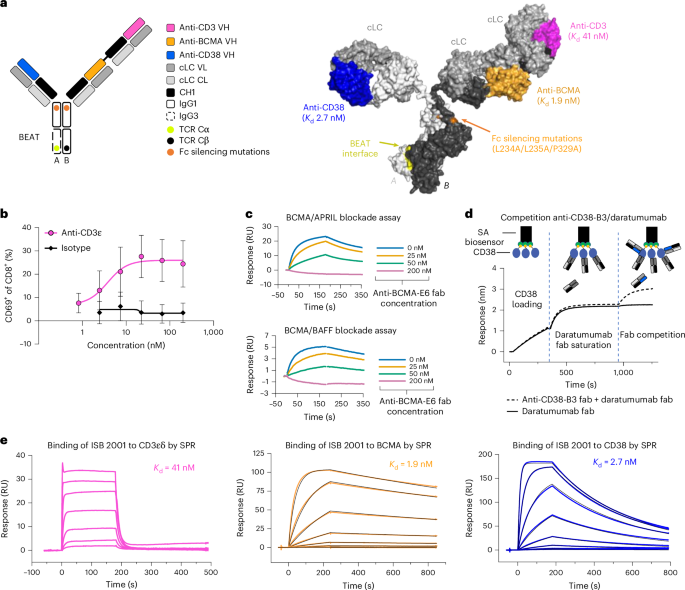
BCMA–APRIL and BCMA–BAFF blockade assayBlockade of the BCMA–APRIL or BCMA–BAFF interaction upon binding of anti-BCMA Fab to BCMA was assessed by SPR on a Biacore 8K+ instrument (Cytiva). Human APRIL HisTag protein (Acrobiosystems, APL-H5244) or human BAFF HisTag protein (Acrobiosystems, BAF-H5248) was immobilized on an anti-histidine-coated sensor chip (Cytiva). Pre-mixed solutions of 50 nM human BCMA FcTag protein (Acrobiosystems, BC7-H5254) and of anti-BCMA Fab at various concentrations (0, 25, 50 and 200 nM), were individually flushed over immobilized APRIL or BAFF.
Competition assays by BLICompetition of Fab domains or antibody constructs was assessed using BLI. Measurements were carried out on an OctetRED96e instrument (Sartorius). Streptavidin biosensors (Sartorius) coated with biotinylated human CD38 protein (Acrobiosystems, CD8-H82E7) were dipped into a solution of a saturating Fab or antibody, followed by a successive dip into a mixed solution of the same and of competing Fab or antibody. The putative binding site of ISB 2001 was mapped to the surface of human CD38 based on competition profile to daratumumab and isatuximab using their respective published structures (Protein Data Bank (PDB) 7DHA and 4CMH).
Affinity measurements by SPRSPR measurements were performed on a Biacore 8K+ instrument (Cytiva).
For binding to CD3εδ, BCMA and CD38, biotinylated human CD3ε&CD3δ protein (Creative Biomart, CD3E & CD3D-377H), biotinylated human CD38 protein (Acrobiosystems, CD8-H82E7) or biotinylated human BCMA protein (Acrobiosystems, BCA-H82E4) were immobilized on a Biotin Capture (CAP) sensor chip (Cytiva) and increasing concentrations of ISB 2001 were flushed onto the immobilized ligand. Concentrations ranged from 1 µM to 1.37 nM or from 100 nM to 0.05 nM in a 1:3 dilution series for binding to CD3εδ and BCMA or to CD38, respectively. Data were fitted to a steady-state affinity model (CD3εδ) or to a 1:1 kinetic model (BCMA and CD38). The same procedure was followed for the assessment of the binding of alnuctamab, teclistamab and EM801 to CD3εδ and BCMA, using concentrations from 400 nM to 0.55 nM to CD3εδ and from 50 nM to 0.07 nM (alnuctamab and teclistamab) or from 100 nM to 0.14 nM (EM801) to BCMA in 1:3 dilution series.
For binding to the Fcγ receptors, the antibody constructs were immobilized on a Protein G sensor chip (Cytiva) for human FcγRIA, FcγRIIA, FcγRIIB and FcγRIIIA binding or on a Protein L sensor chip (Cytiva) for FcRn binding and increasing concentrations of the receptors were flushed onto the immobilized antibodies. Measurements to FcRn were conducted at pH 6.0, whereas measurements to the other Fcγ receptors were performed at neutral pH. Binding to FcγRIA was fitted using a 1:1 kinetic model and binding to FcγRIIA, FcγRIIB, FcγRIIIA and FcRn were fitted using a steady-state affinity model.
Human T cell activationAnti-human CD3 produced as human IgG1 LALA were coated at increasing concentrations up to 200 nM in PBS in a 96-well plate overnight (ON) at 4 °C. Isolated T cells from buffy coats (EasySep Human T Cell Isolation kit, STEMCELL technologies, 17951) were added to the coated plate at 106 cells per ml and incubated at 37 °C for 48 h. T cell activation was measured as the proportion of live CD8+ T cells expressing CD69 by flow cytometry (Cytoflex-S, Beckman Coulter).
Human primary samples and cell linesBMAs or peripheral blood samples from patients with MM without sex distinction were obtained from University Hospital Geneva (Geneva ethical committee 2021-02416), Oxford University Hospitals (Oxford Clinical Research Ethics Committee (17/SC/0572) and the HaemBiobank Governance Committee (BBProj-27.0 and BBProj-13.0)) and Nantes Université (MYRACLE cohort61; NCT03807128) with written informed consent under each site ethical approvals. Human PBMCs (hPBMCs) from HDs and patients with MM and BMMCs were isolated using Ficoll gradients. KMS-12-BM (DSMZ, cat. no. ACC551), MOLP-8 (DSMZ, cat. no. ACC569), NCI-H929 (Sigma-Aldrich, cat. no. 9505041), NCI-H929 deficient for BCMA or CD38 (Methods), were tested as Mycoplasma-free and cultured in the medium recommended by the supplier in a humidified atmosphere of 5% CO2 at 37 °C. The identity of the cell lines was confirmed at early passages and at the end of the culture using short tandem repeats performed according to Microsynth guidelines. Human samples were used in their totality.
Generation of NCI-H929 BCMA KO and NCI-H929 CD38 KO cellsNCI-H929 BCMA KO and CD38 KO cell lines were derived from original NCI-H929 cells (Sigma-Aldrich, cat. no. 9505041) by targeting the first exon of the TNFRSF17(BCMA) or CD38 gene using clustered regularly interspaced short palindromic repeats (CRISPR)/Cas9 technology (guide RNA target sequences CAATAACGCTGACATGTTAG and TACTGACGCCAAGACAGAGT, respectively). The NCI-H929 cell line was transfected using 4D-nucleofector (Lonza) according to the manufacturer’s recommendation, then sorted using Melody sorter (BD Biosciences) to generate cell pools. The lack of BCMA or CD38 expression was further verified by flow cytometry using QIFIKIT reagent (Agilent DAKO, K0078) and mapping breakpoint analysis using TA-cloning, Sanger sequencing and ICE (Synthego) software.
Redirected lysis assayCell lines were labeled with 0.5–1 µM eFluor 670 dye (Invitrogen, 65-0840-85) and co-cultured for 72 h with hPBMCs or for 48 h with isolated T cells from HD- or patient sample (PS)-PBMCs or BMA at an effector to target ratio (E:T) of 5:1 with increasing concentration of the tested molecules diluted in RDL medium (Supplementary Table 2). In assays evaluating the effect of soluble factors on the cytotoxic potency, soluble BCMA (150 ng ml−1), APRIL (100 ng ml−1) and soluble CD38 (2.8 ng ml−1) were added to the cultures, alone or in combination. When indicated, effector cells were labeled with 5 µM of eFluor450 dye (Invitrogen, 65-0842-85). Tumor cell killing was measured as the percentage of dead target cells or as the decrease of live target cells count normalized to the untreated condition. Data acquisition was performed by flow cytometry (IntelliCyt iQueScreenerPlus, Sartorius) and analysis was performed using ForeCyt Software (Sartorius). T cell activation was measured as the percentage of live CD4+ or CD8+ T cells expressing CD25 and the loss of eFluor450 dye was used to measure T cell proliferation (see Supplementary Table 3 for antibody references).
High-density PBMC assayPBMCs from HDs were cultured at 107 cells per ml for 48 h, then incubated for an additional 48 h at 0.5 × 10⁶ cells per ml with increasing concentrations of tested molecules in HD-PBMC medium (Supplementary Table 2). T cell activation was measured as the percentage of CD4+ or CD8+ T cells expressing CD25, granzyme B and perforin using Cytoflex-S cytometer. Alternatively, quantification of the events of CD4, CD8, CD14, CD20 and CD56 was assessed. Analysis was performed using CytExpert software (Beckman Coulter).
Confocal live imagingKMS-12-BM cells were stained with 15 μM of CellTracker Blue Dye (Invitrogen, C2111) and plated with T cells from HDs labeled with 5 μM CellTracker Orange Dye (Invitrogen, C2927) at an E:T of 5:1. Tested antibodies were labeled using Zenon Alexa Fluor 647 Goat IgG Labeling kit (Invitrogen, Z25608). Labeled molecules (10 nM) were added to the cells on ibiTreat pre-coated slides (Ibidi) for 4 h at 37 °C. Live microscopy was carried out using a Zeiss LSM 800 inverted confocal microscope incubation system (Carl Zeiss). Images were processed with Imaris software (Oxford Instruments).
Tumor T cell interaction by live imagingKMS-12-BM cells were labeled with 2 μM CellTracker Red Dye (Invitrogen, C34552) and co-cultured for up to 24 h with isolated T cells, labeled with 2.5 μM CellTracker Green Dye (Invitrogen, C2925) at an E:T ratio of 5:1 with tested samples at doses ranging from 2000-2 pM. Images were acquired on Incucyte S3 with ×20 objective every 30 min for 6 h and every hour up to 24 h.
Cytokine release quantificationCytokine release in the culture supernatant of RDL and HD-PBMC assays were assessed by LEGENDplex Multi-Analyte Flow Assay kit (BioLegend) according to the manufacturer’s instructions. Human CD8/NK Mix and Matched Subpanel was used to quantify IFNγ, TNF, granzyme B, perforin, IL-2, IL-6 and IL-10. Samples were acquired on a Cytoflex-S cytometer and data were analyzed with LEGENDplex online tool. Lower limits of detection (LLOD) were set for each cytokine using the lowest concentration of the calibration curve or quality control sample with a coefficient of variation below 30 %. Upper limits of detection (ULOD) were set for each cytokine using the highest concentration of the calibration curve. When cytokine release was below the LLOD or above the ULOD the value of the sample was set at LLOD or ULOD respectively.
Cytokine release in serum and tumor supernatant samples (undiluted) was assessed by multiplex Luminex quantification, according to the manufacturer’s instructions. The cytokine and chemokine 34-Plex Human ProcartaPlex Panel 1A kit (Invitrogen, EPXR340-12167-901) was used. Acquisition was carried out with a Luminex 200 instrument and data were analyzed with ProcartaPlex Analyst 1.0 software. Cytokine concentration was normalized to the upper and lower limit of quantification (defined using ProcartaPlex standards) for each cytokine/chemokine. The final concentration was then normalized per gram of tumor.
Multiple mode of action killing assayHuman PBMCs labeled with 5 µM eFluor450 dye (Invitrogen, 65-0842-85) were co-cultured with KMS-12-BM cell line previously labeled with 1 µM eFluor 670 dye (Invitrogen, 65-0840-85) in MMoAK medium (Supplementary Table 2) at an E:T of 5:1. Effector and target cells were incubated with increasing concentrations of ISB 2001 or teclistamab. Daratumumab (Darzalex, Janssen Biotech) was tested at 100 nM either alone or in combination with ISB 2001 or teclistamab. After 48 h, MM cells were stained for viability (Live/Dead Green) and tumor cell killing was measured as the percentage of dead target cells using an IntelliCyt iQueScreenerPlus flow cytometer (Sartorius). Analyses were performed using ForeCyt Software (Sartorius).
Specific antibody-binding capacity by flow cytometrySpecific antibody-binding capacity of human CD38 and human BCMA was measured using QIFIKIT (Agilent DAKO, K0078) or Human IgG Calibrator (BioCytex, CP010) according to the manufacturer’s instructions. Mouse anti-human CD38, mouse anti-human BCMA and mouse isotype IgG1 were used as primary antibodies at saturating concentration with QIFIKIT. Daratumumab (Darzalex, Janssen Biotech) and anti-human BCMA (produced in-house from vectors synthesized using publicly available sequence information) were used as primary antibodies at saturating concentration with Human IgG Calibrator kit.
Cell-based affinity assayKMS-12-BM, MOLP-8, NCI-H929, NCI-H929 deficient for BCMA or CD38 or purified T cells from hPBMCs were incubated with increasing doses of tested molecules in a 96-well plate at 4 °C in the dark for 30 min, washed with FACS buffer supplemented with 0.05% sodium azide, then stained with Live/Dead NIR. Binding was detected using an APC-labeled anti-human Fc monoclonal for MM cells or a PE-labeled anti-human Fc monoclonal for T cell secondary antibody. For binding to T cells, additional staining with anti-CD38 FITC antibody was performed. Acquisition was performed on an IntelliCyt iQueScreenerPlus flow cytometer (Sartorius). The geometric mean of fluorescence intensities (MFI) of the viable single cells (for cell lines) or viable CD38− T cells (for T cells) was extracted using ForeCyt Software (Sartorius). The values of MFI from the control antibody were subtracted to the matching concentration MFI of the tested antibodies to generate the relative fluorescence intensity.
Ex vivo cytotoxic assay on samples from patients with MMBMMCs or peripheral blood of patients were co-cultured at 1–2 × 10⁶ cells per ml with increasing concentration of tested molecules in PS medium for 17–32 h at 37 °C (Supplementary Table 2). Samples were acquired using Cytoflex-LX cytometer (Beckman Coulter) or LSRFortessa cytometer (BD Biosciences). Tumor cell killing was calculated as the decrease of the remaining live target cell counts CD138+ after treatment and normalized to the untreated condition. T cell activation was measured as the percentage of CD8+ T cells expressing CD69.
MiceNCG (NOD-Prkdcem26Cd52Il2rgem26Cd22/NjuCrl) mice were purchased from GemPharmatech Co. and used in PK evaluation at Crown Bioscience and in a subcutaneous tumor model at Crown Bioscience in accordance with reviewed and approved Institutional Animal Care and Use Committee protocols. hFcRn Tg32 SCID mice (B6.Cg-Fcgrttm1Dcr Prkdcscid Tg(FCGRT)32Dcr/DcrJ; JAX stock no. 018441) were purchased from The Jackson Laboratory and used directly at The Jackson Laboratory for PK evaluation in accordance with JAX Institutional Animal Care and Use Committee protocols. NSG ((NOD.Cg-Prkdcscid Il2rgtm1Wjl/SzJ) and HIS-NXG (human immunized system-NOD-Prkdcscid-IL2rgTm1/Rj, reconstituted with human cord blood CD34+ cells) mice were purchased from Janvier France and used at the animal facilities of the University of Lausanne in accordance with protocols approved by the veterinary authorities of the Canton de Vaud. All mice were maintained under standardized environmental conditions in rodent cages (20–26 °C temperature, 40–70% relative humidity and 12-h light–dark cycle). Mice received irradiated food and bedding and 0.22-µm-filtered drinking water ad libitum. Tumor-bearing mice were killed when the tumor volume reached >1,000 mm3 in accordance with approved protocols.
For PK experiments, mice of either sex were used, based on availability and bodyweight (to ensure ethical blood sampling as maximum blood volume is determined by weight). Only female mice were used in studies with tumors to respect the need for social housing and the 3Rs after randomization based on tumor volume. Mice with the same treatment were co-housed to minimize the animal stress and the risk of experimental error.
PK evaluation in NCG and hFcRn miceThe PK profile of ISB 2001 was assessed in NCG mice following either i.v. or s.c. administration at 0.5 mg kg−1 or 5 mg kg−1 on day 0. For the study comparing ISB 2001 and teclistamab, mice also received 200 mg kg−1 of IgG (Boxin Biotech) i.v. on day −1, day 6 and day 13, to mimic the conditions in the improved KMS-12-BM xenografted model (see below). Micro-samplings (25–30 µl blood) were collected at 15 min, 4 h, 1 day, 2 days, 4 days, 7 days, 9 days, 15 days and 21 days post-dose. Plasma concentrations of ISB 2001 and teclistamab were determined using an electrochemiluminescence (ECL) method using a Meso Scale Discovery (MSD) platform. For PK evaluation in hFcRn Tg32 SCID mice, micro-samplings were collected at 5 min, 1 day, 3 days, 7 days, 10 days, 14 days, 17 days, 21 days, 24 days and 28 days after i.v. administration of ISB 2001 (5 mg kg−1). Plasma concentrations of ISB 2001 were assessed using Mabtech (ref. 3850-1AD-6) total human IgG Fc ELISA kit. All PK calculations were performed using noncompartmental analysis with Phoenix WinNonlin v.8.3 (Certara).
ECL quantification using MSD from mouse plasmaAntibodies in mouse plasma were quantified by an exploratory ECL-based immunoassay method developed using the MSD platform. Assays were performed as per the manufacturer’s instructions, using their reagents except for plate coating, which was carried out overnight at 2–8 °C with recombinant human BCMA HisTag protein at 2.0 µg ml−1 (ISB 2001) or 1.0 µg ml−1 (teclistamab), and for detection, where sulfo-tag conjugated anti-idiotypic antibody of CD38 domains of ISB 2001 at 2 µg ml−1 or a mixture of biotin conjugated anti-idiotypic antibody of CD3 domains of teclistamab at 1 µg ml−1 and 0.25 µg ml−1 streptavidin sulfo-tag was used. Casein was used in the blocking step and diluent buffer.
Tumor modelsThe 6–7-week-old NSG or NCG female mice were engrafted s.c. with 1 × 10⁷ KMS-12-BM or 1 × 10⁷ NCI-H929 tumor cells, respectively and inoculated intraperitoneally (i.p.) with 1 × 10⁷ PBMCs from human HDs on the same day. When tumors reached an average of 150 mm3, mice were randomized based on the tumor volume and injected i.v. on the following day with vehicle, ISB 2001 or CD3DU control at the indicated doses once per week for 3 weeks. Tumors and spleens of satellite animals (that received a single dose of molecules) were collected at day 2 and 6 post-dose. Single-cell suspensions were analyzed by flow cytometry. Human cytokine detection was performed with a Luminex assay on the serum and tumor supernatant. When comparing ISB 2001 and teclistamab, mice were injected i.v. with 200 mg kg−1 IVIG (Privigen) 1 day before treatment injection, a pretreatment mimicking physiological levels of irrelevant immunoglobulin to compensate for the mouse B cell deficiency.
HIS-NXG mice (24–30-week-old mice reconstituted with CD34+ from five donors) were stratified into control and treatment groups based on tumor size and donors (Extended Data Fig. 6f). At 24 h after pre-conditioning with IVIG (i.p.), mice were treated s.c. with ISB 2001, teclistamab, daratumumab or both teclistamab and daratumumab.
Tumor volumes were measured by caliper and calculated using the formula: V = (L × W × W)/2, where V is the tumor volume (mm3), L is the longest tumor dimension and W is the longest tumor dimension perpendicular to L. The last observation carried forward was applied to display the tumor volume. An exclusion criterion was that if animals demonstrated signs of graft-versus-host disease, a common effect in systemic PBMCs of humanized mice, they were killed before the study end point and excluded from the analysis.
Assessing progenitor cells in humanized mice bone marrowThe 30–34-week-old HIS-NXG mice were pretreated with 200 mg kg−1 IVIG (i.p.) 24 h before s.c. injection with 1.5 mg kg−1 ISB 2001, teclistamab, CD38 × CD3 control antibody or with PBS. CD34+ humanized mice were reconstituted from three different donors, equally distributed in the treated groups. Three days after treatment with the different molecules, mice were killed and both femurs were collected. CD38 expression on progenitor cells in the bone marrow was analyzed by flow cytometry.
Sample preparation and staining for flow cytometryTo obtain the cell suspension, femurs were flushed with PBS, spleens were mashed through a 70-μM nylon cell strainer and tumors were dissociated using a tumor dissociation kit from Miltenyi (130-095-929) in a gentleMACS dissociator. Cell suspensions were incubated with viability dye, human and mouse Fc Block for 15 min at 4 °C in FACS buffer (PBS and 2% FBS), followed by surface staining with an antibody cocktail (or relative controls) for 30 min at 4 °C in FACS buffer. Samples were acquired on the Cytek Aurora instrument and analyzed with FlowJo v.10.8.1.
QSP modelThe QSP model was built by combining a minimal PBPK model with a target-binding model based on the published method27,33. The method of Betts was modified to include binding interactions of three binders (CD3, CD38 and BCMA) and the available preclinical datasets. The building, benchmarking and prediction strategy of the QSP model are described here sequentially (Fig. 8a).
Model buildingThe QSP model is constituted by sequentially generated mathematical models. Each model was built by an iterative process using assumptions and experimental data to define key parameters applied in subsequent models. MATLAB/Simbiology v.R2021a (The MathWorks), was used for all PKPD/QSP analyses and simulations.
Target-binding modelThis model, based on equilibrium binding kinetics (Fig. 8b), was created using SPR binding data, cell numbers along with CD38 and BCMA receptor densities on MM cell lines, CD3 receptor density on T cells27 and internalization t1/2 for each target from the literature62,63,64. This model assumes that the following complexes could be formed: (1) dimers of ISB 2001 with either CD3, CD38 or BCMA; (2) trimers of ISB 2001-CD3 with one of the targets (CD38 or BCMA) or with ISB 2001 with CD38 and BCMA on the tumor; and (3) tetramers of ISB 2001-CD3 with both targets on the tumor (CD38 and BCMA). The sum of trimers and tetramers consisting of TCE, CD3, BCMA and/or CD38 were assumed to be equipotent pharmacologically active species (ACT) that drive T cell activation and tumor cell killing. A single compartment was used for the binding model consistent with the in vitro test conditions used for RDL (Extended Data Fig. 8a). To facilitate the translation across various experimental conditions in vitro, in vivo and ultimately to clinical scenario, ACT was expressed as normalized ACT per tumor cell (nACT).
In vitro cytotoxicity and T cell activation modelThis model simulates tumor cell growth and degradation, as well as T cell proliferation and activation consistent with an RDL assay at 72 h. The tumor cytotoxic effect of ISB 2001 was modeled through the formation of nACT, which stimulated the tumor cell degradation rate as a sigmoidal function of the nACT. T cell activation and proliferation was modeled as a sigmoidal function of ACT per T cell, stimulating the activation rate and proliferation rate, respectively (Extended Data Fig. 9).
In vivo mouse PKPD modelThe PK data from NCG, NSG and hFcRn TG32 SCID mice were fitted to a minimal PBPK model33. This model assumed that ISB 2001 behaves like a typical IgG antibody without cross-reactivity of its binding domains to mouse. This model gave a dose–time–exposure relationship, which was used in mouse PKPD modeling. The model estimated clearance (CL) from single-dose PK data of hFcRn TG32 SCID was scaled to a human model (Extended Data Fig. 8d).
To develop a mouse PKPD model27, an additional tumor compartment was added to the PBPK model developed earlier33, to estimate the nACT profile in the tumor. It was assumed that following i.v. administration of PBMCs, T cells were able to distribute to the tumor and back to the central compartment with fixed rate constants; the CD3 density on T cells, permeability and diffusivity of TCE into the tumor were obtained from the literature27. As PD data were available from early post-ISB 2001 administration, but limited later in the treatment due to tumor regression, trafficking rather than proliferation was assumed to be the dominant mechanism of delivering T cells to the tumor in this model. Tumor regression was described as a sigmoid function of the nACT profile in the cell distribution transduction model explained by Betts et al.27 (Fig. 7 and Extended Data Fig. 10a).
Human QSP modelFinally, a human QSP model integrating the target engagement and the PBPK model was developed (Extended Data Fig. 10b). A published minimal PBPK model, including blood, leaky tissue, tight tissue and lymph was adapted to estimate the nACT profiles in the bone marrow33. The leaky tissue compartment in the base model was split into two subcompartments: bone marrow and leaky tissues65,66. For ISB 2001, all physiological parameters, except for CL, were fixed to the parameters published for typical IgG67,68. The clearance of ISB 2001 in the human model was estimated by allometric scaling of CL from hFcRn TG32 SCID mice using an exponent of 0.85 (ref. 28). To model subcutaneous injection bioavailability and absorption, rates were taken from the literature69. Additional assumptions were obtained from the literature: cell counts70,71,72,73,74,75,76,77,78 (https://my.clevelandclinic.org/), soluble BCMA and CD38 levels2,23, CD3, CD38 and BCMA expression levels2,6,76. This model predicted the nACT profile in the bone marrow over time following either i.v. or s.c. administration. This nACT profile was then related to efficacy based on the calculated nACT levels at a specific ECx (tumor cell killing) from the in vitro and in vivo PD models. The final QSP model used outputs from all previous models either as parameters or linked active species levels to possible outcomes. (Extended Data Fig. 10c).
Calibration and benchmarkingThe QSP models were recalibrated and fine-tuned to describe the ISB 2001 and teclistamab preclinical datasets. The teclistamab target-binding model was achieved by adapting the ISB 2001 target-binding model to use teclistamab-specific affinity parameters for BCMA and CD3 binding determined by SPR and setting the CD38 affinity to ‘0’ (Extended Data Fig. 8a). A similar approach was taken to adapt the in vitro model (Extended Data Fig. 9). For the in vivo modeling, the same minimal PBPK model was used with single-dose PK data for teclistamab to determine the dose–exposure relationship (Extended Data Fig. 10a).
Human modelThe teclistamab clinical PK data36 were used to build the human PBPK model33, including bone marrow, blood, leaky tissue, tight tissue and lymph (Extended Data Fig. 10b).
Statistical analysisStatistical analysis and graphs were generated using GraphPad Prism software (GraphPad Software). For in vitro experiments, no statistical methods were used to predetermine sample size, the experiments were not randomized and the Investigators were not blinded to allocation during experiments and outcome assessment. A nonlinear one-site binding (hyperbola) regression was applied to calculate Kd in cell binding assays. To allow Kd calculations, tested concentrations inducing a >20% hook-effect were excluded. The percentage of tumor cell killing, killing of CD138+ cells and T cell response (activation or proliferation) were fitted with four-parameter logistic nonlinear regression with a variable slope. EC50 values were excluded when the R2 of the fitting curve was <0.7, the observed maximum response was <25% or the calculated EC50 values were below or above the tested concentrations.
EC50 and Kd were log10-transformed before performing any statistical comparison. The normality of data was checked using the Shapiro–Wilk or Kolmogorov–Smirnov test and homogeneity of the variance was tested using a Bartlett or Spearman’s test. All EC50 and Kd statistical comparisons were performed two-sided. Differences between two groups were analyzed by a multiple paired t-test using Holm–Šidák’s or false discovery with the two-stage step-up (desired false discovery rate Q set at 1%) method. A classical one-way analysis of variance (ANOVA), repeated measures (RM) one-way ANOVA (assuming sphericity), two-way ANOVA or mixed-effects model (REML) were used for multiple group comparisons or using Friedman or Kruskal–Wallis tests for nonparametric comparisons. Post-hoc comparisons were performed for parametric testing using Tukey’s multiple comparisons between all groups, a Dunnett’s test for comparisons with a control group, the uncorrected Fisher’s LSD comparison or a Šidák’s multiple comparison for two samples in a specific group. For nonparametric post-hoc comparisons, Dunn’s multiple comparisons test was used. For in vivo studies, 7–9 mice per group were used based on power calculations using G*Power (90% power and 0.05 error probability)77. In tumor models, a randomization based on the tumor volume was carried out before starting the treatment. Data collection and analysis were performed blind for the outsourced in vivo experiments performed in Crown Bioscience and The Jackson Laboratories but not for the other models and experiments. P ≤ 0.05 was considered significant. The number of biological replicates, independent experiments performed and statistical analysis performed are stated in all figure legends.
RSE (relative standard error) was calculated in MATLAB at the EC50 of each predication shown in the modeling goodness-of-fit plots.
Reporting summaryFurther information on research design is available in the Nature Portfolio Reporting Summary linked to this article.
留言 (0)