
記住我


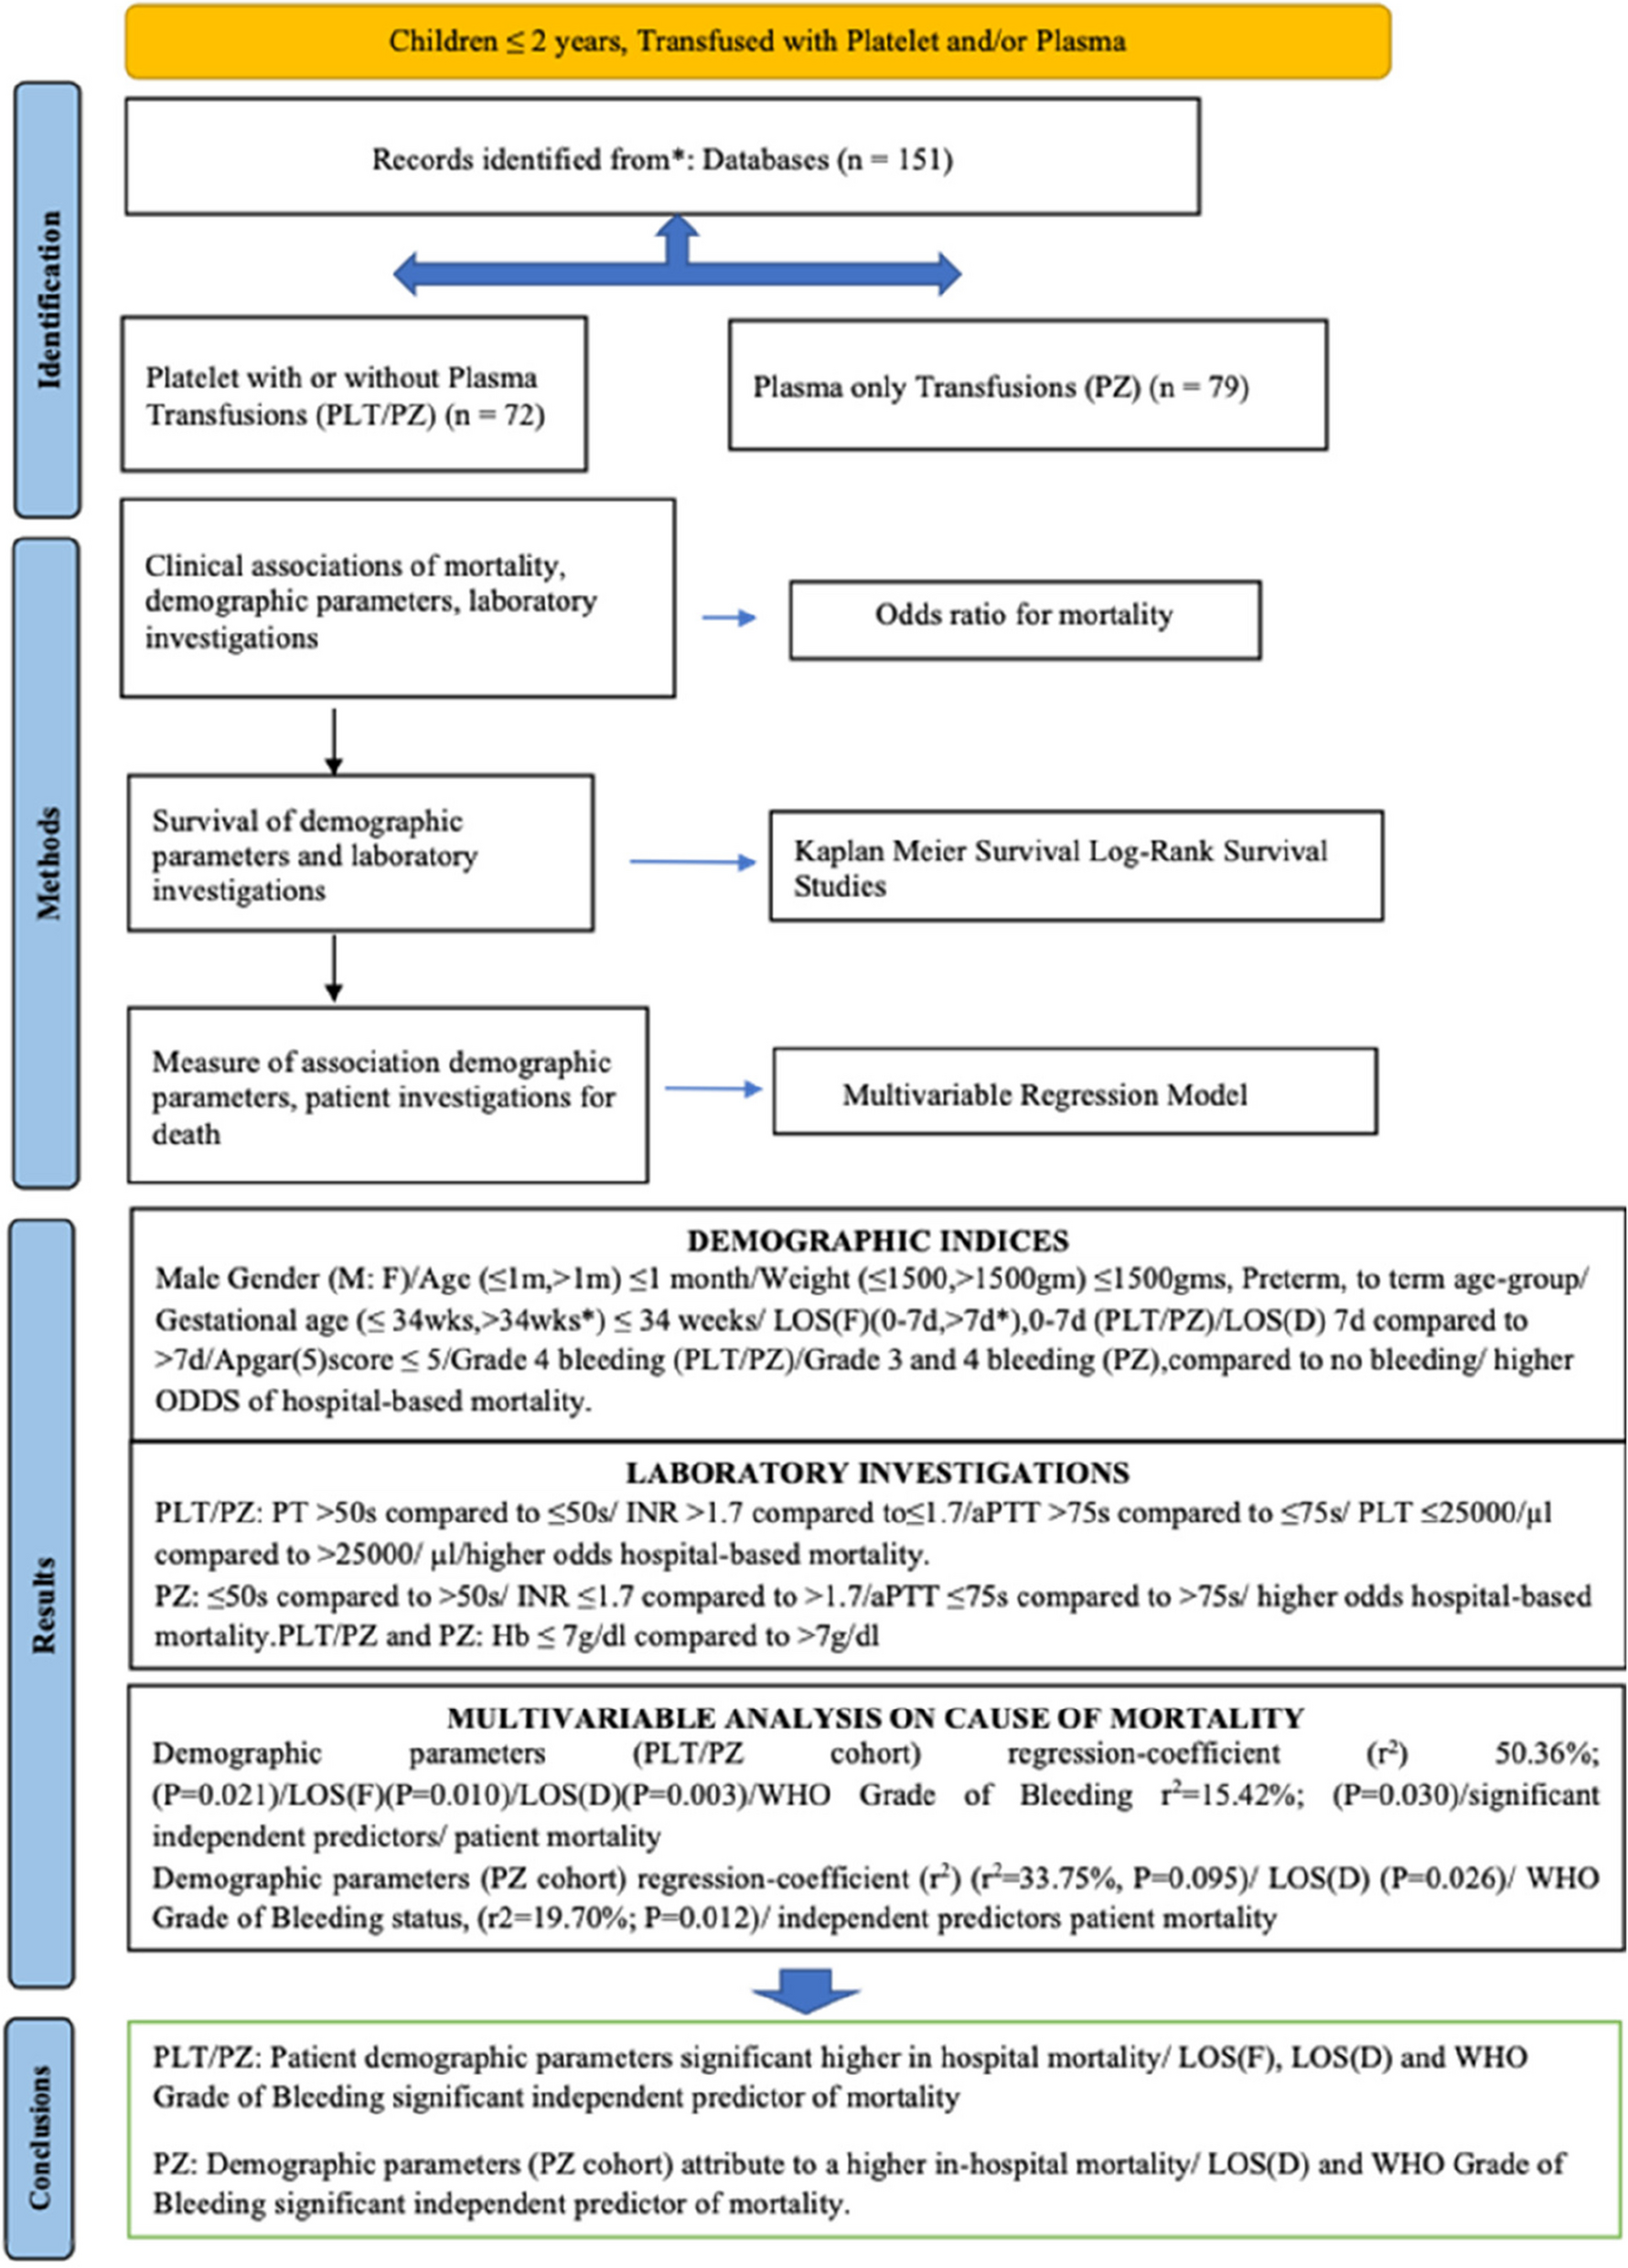
In the present study from 2019-2022 of hospitalized Pediatric patients (≤ 24 months, n = 151), treated with PLT/PZ (n = 72) or PZ (n = 79) transfusions, we observed no significant statistical differences (P>0·05) (PLT/PZ, PZ cohort) for the following demographic and laboratory variables Age(months), Weight (gm), BSA(m2), Gestational age (weeks), LOS(D), AvHb (g/dl), AvPT/INR, aPTT with significant differences in LOS(F)(P=0·019). (Mann-Whitney test) (Table 1).
Demographic association in mortality and survivalGender (M*:F) had higher OR of mortality (PLT/PZ) of females with no significant differences in survival across LOS(D) (Tables 2, 3).
Table 3 Log-rank survival comparisons of demographic parametersAge ≤ 1 m had a higher OR of mortality during the hospital stay (PLT/PZ and PZ) with no significant differences in survival between age groups across LOS(D) (Tables 2, 3).
We observed weight ≤ 1500 g (PLT/PZ and PZ cohort) with higher mortality and with no significant difference in survival across LOS(D) (Tables 2, 3).
Preterm age group had higher mortality compared to term with no significant differences in survival across LOS(D) (PLT/PZ, PZ cohort) (Tables 2, 3).
Gestational age ≤ 34 weeks (PLT/PZ, PZ cohort) had higher mortality, with no significant difference in survival across LOS(D) (Tables 2, 3).
LOS(F) 0–7 days (PLT/PZ) had higher mortality. We observed a higher survival (PLT/PZ cohort) when transfused at 0–7 days compared to > 7 days across age (m) and weight (g) distribution (P = 0·002; < 0·01) (Table 3, Figure 1 (supplementary) i and ii). We did not observe significant survival difference (PZ cohort) whether transfused ≤ 7 days or > 7 days of hospital stay across age (months) (P = 0·790) and weight (g) distribution· (P = 0·955) (Table 3).
LOS(D) (0–7 days; ≥ 15 days*) had higher mortality at 0–7 days compared to longer duration of hospital stay in both PLT/PZ and PZ cohort. PZ showed significant differences in survival LOS(D) across age (m) and weight (g) distribution (P = 0·036, 0·001) with the lowest survival at 0–7-day period across the age (m) and weight (g) distribution (Tables 2, 3; Figure 2 (supplementary) — (i, ii)).
Laboratory parameters and differences in mortality and survivalWe observed a higher mortality with INR > 1·7 and aPTT > 75 s (PLT/PZ cohort), INR ≤ 1·7, and aPTT ≤ 75 s (PZ cohort) across LOS(D) (Tables 2, 3). We observed a higher survival (PLT/PZ cohort) with INR ≤ 1.7 and aPTT ≤ 75 s (with coexistent thrombocytopenia) but no significant differences in survival with platelets(T) (≤ 25,000, > 25,000/µl) across LOS(D) (P = 0.991) (Tables 2, 3, Figure 3 (supplementary) i, ii, iii).
We observed higher OR mortality with lower derangement of laboratory profile for PT(INR) and aPTT (PZ cohort) (Table 2). We however observed no significant difference in overall survival (PZ) INR (≤ 1·7, > 1·7) (P = 0·699) and aPTT (≤ 75 s, > 75 s) (P = 0·193) across LOS(D) (PZ cohort).
Bleeding status and mortalityIn the PLT/PZ cohort, we noted significant differences in age (m), mean (SD) 3·98 (7·56), months (P = 0·039) with most transfusions (n = 21) having no clinical bleeding, during the first month. We noted no significant differences in weight (P = 0·320), PLT(T) (P = 0·346), INR (P = 0·090), aPTT (P = 0·347), and LOS(D) (P = 0·677). Mean (SD) and Hb (g/dl) (PLT/PZ) among patients within GOB were significantly different (P = 0·013) (Kruskal–Wallis test) (Table 1 (supplementary)).
In the PLT/PZ cohort, GOB 4 had higher OR for mortality compared to “no bleeding”· (Table 2). We noticed, GOB 1–3, with relative lower OR of mortality compared to no bleeding (n = 21) (Table 2). We observed a significant difference in survival (PLT/PZ cohort) within GOB across LOS(D) cohort (n = 71) (P = 0·052) (Table 3, Figure 4 (supplementary) i, ii).
In the PZ cohort, most FFP transfusions (PZ cohort) were among patients without any clinical bleeding (n = 19) mostly during the first month of birth mean (SD) 0·36 (0·52) months with significant differences in age (m) (P = < 0·01), weight (P = 0·008), Hb (P < 0·01), PT (P = 0·004), and INR (P = 0·002) with no bleed and GOB (1 to 4). We observed nonsignificant difference of aPTT (P = 0·076) across GOB. We observed higher OR of mortality in GOB 3 and 4 compared to “no bleeding” (n = 19) (Table 2). We observed a significant difference in survival (PZ cohort) within GOB across LOS(D) (P = 0·005) (Table 3, Figure 4 (supplementary) ii).
Multivariable analysis on the causes of mortalityA “multivariable regression analyses” of PLT/PZ cohort, gender (*M:F), preterm/term*, age (m), weight (g), Apgar (5), LOS(D), LOS(F), and gestational age, evaluated for death during hospital stay, had r2 = 50·36% (P = 0·021) . We observed LOS(F) (P = 0·010) and LOS(D) (P = 0·003) among significant predictors of mortality during a hospital stay (Fig. 2i). GOB PLT/PZ cohort is a significant contributor towards death in hospital r2 = 15·42% (P = 0·030). LI (PLT/PZ) during hospital stay, Hb (g/dl), PT, INR, aPTT, and PLT (T) together amounted to a small proportion of factors attributed to death in hospital (r2 = 10·44%; P = 0·470).
Fig. 2
i Demographic predictors of death during hospitalization (PLT/PZ). ii Demographic predictors of death during hospitalization (PZ)
In the PZ cohort, gender (*M:F), preterm-term*, age (months), weight (g), LOS(D), LOS(F), Apgar (5), and gestational age, on multivariable regression analysis, attributed to a nonsignificant cause of death during hospital stay (r2 = 33·75%, P = 0·095). LOS(D) (P = 0·026) is a significant contributor to hospital mortality (Fig. 2ii). We found GOB (PZ) (r2 = 19·70%; P = 0·012) a significant contributor towards hospital mortality. Investigations (PZ) of Hb (g/dl), PT (s), INR, and aPTT (s) contributed towards a small proportion of factors attributing to hospital death (r2 = 8·79%; P = 0·254).
留言 (0)