
記住我
The coronavirus N protein exhibits higher sequence conservation when compared to the S protein19,20. Our previous study reported the development of a nucleoside-modified mRNA vaccine expressing ancestral SARS-CoV-2 N (mRNA-N)11. Prior to investigating the extent of protection conferred by mRNA-N against newer variants, we conducted an analysis of the sequence diversity of the N protein among various SARS-CoV-2 strains (BA.1, BA.5, and BQ.1 versus Wuhan-Hu-1 strain), compared to the S protein (Table 1). The analysis reveals that compared to Wuhan-Hu-1 strain, the three Omicron variants demonstrate an overall sequence diversity in 53 (out of 1273) residues for the S protein, and 8 (out of 419) residues for the N protein, supporting that N is more conserved among these SARS-CoV-2 strains relative to S (Table 1).
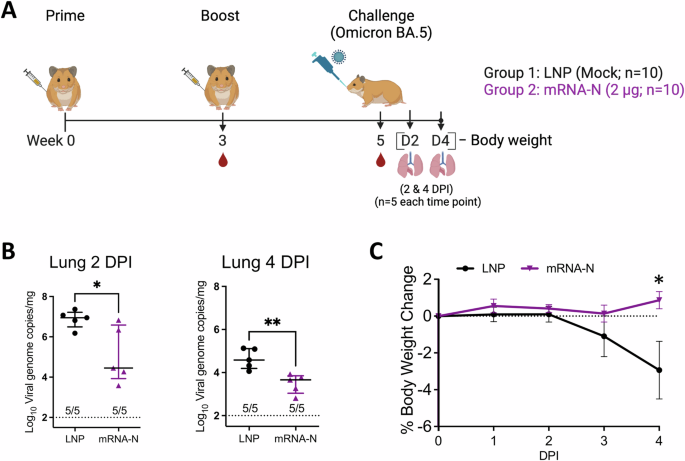
Table 1 Residue Diversity Within the Spike and Nucleocapsid Proteins of SARS-CoV-2 strainsNext, we assessed the efficacy of mRNA-N against Omicron BA.5 in hamsters, which was a dominant circulating variant in human population and showed substantial neutralization escape21,22 when this study was conducted. Two groups of hamsters (n = 10 per group) were IM vaccinated with empty LNP (mock) or mRNA-N (2 μg) at weeks 0 and 3, followed by intranasal (IN) challenge with BA.5 (2 × 10⁴ pfu) at week 5 (Fig. 1A). The mRNA vaccine dose was selected based on our recent study11. Two (n = 5) and four (n = 5) days post infection (DPI), hamsters were euthanized and lung tissues were harvested for viral RNA quantification by RT-qPCR (Fig. 1A). Our primary goal was to evaluate the vaccine efficacy based on reductions in viral RNA copies. Since viral replication kinetics for different SARS-CoV-2 strains in animal models varies, lungs are usually harvested at multiple time points after challenge (e.g., 2 and 4 DPI) for quantification of viral loads11. Hamster body weights were also monitored daily until the terminal harvest (4 PDI) as a secondary measure of vaccine-induced protection. At 2 DPI, lung viral RNA copies were reduced in the mRNA-N-vaccinated group compared to the mock-vaccinated group (60-fold reduction in mean viral RNA copies; mock versus mRNA-N; p < 0.05) (Fig. 1B). At 4 DPI, mRNA-N also induced a significant reduction of lung viral RNA copies (8.3-fold reduction in median copies compared to the mock group; p < 0.01; Fig. 1B). Body weight analysis showed that BA.5 infection caused weight reduction in the mock-vaccinated group by ~3% on 4 DPI (Fig. 1C). However, mRNA-N-vaccinated hamsters were protected from weight loss (4 DPI mRNA-N vs. LNP: p < 0.05) (Fig. 1C). Together, these data indicated that mRNA-N induced a modest but significant protection against SARS-CoV-2 BA.5. This level of protection is consistent with its efficacy against the Delta strain reported in our previous study11.
Fig. 1: mRNA-N vaccine is efficacious against Omicron variant BA.5 in hamsters.
A Experimental design and timeline (Created with BioRender.com). Two groups of hamsters (n = 10/group) were vaccinated intramuscularly with either empty LNP (mock) or mRNA-N vaccine (2 µg/dose) at weeks 0 and 3. At week 5, hamsters were intranasally challenged with Omicron BA.5 (2 × 10⁴ pfu). B Lungs were harvested at 2 and 4 DPI (days post infection; n = 5 at each time point) for quantification of viral RNA copies by RT-qPCR. C Hamster body weight was monitored from 0 to 4 DPI. In (B) symbols represent individual animals, midlines represent the median, error bars represent the interquartile range (IQR), and the dashed lines represent the lower limit of detection (LOD). The number of animals with viral loads above the LOD is noted. Log10 normalized data was compared by Mann-Whitney test. In (C) symbols represent the mean, error bars represent the standard deviation, and the dashed line highlights 0% weight change. Weight change at individual time point between the two groups was compared by unpaired t-test. *p < 0.05, **p < 0.01.
Intramuscular immunization with mRNA-N alone induces modest respiratory T cell responses in the lung and bronchoalveolar lavage of micePrior results are conflicting regarding whether peripheral mRNA immunization (e.g., IM) elicits effective immunity in the airway, in addition to systemic immunity15,16,17,18. Our previous study showed induction of systemic T cell responses and circulating antibodies by mRNA-N in BALB/c mice11. Here, we investigated respiratory immune responses following IM mRNA-N vaccination in C57BL/6 mice. Use of C57BL/6 mice was in part because SARS-CoV-2 N-epitope specific MHC-I tetramer (H2-Db; N219-227: LALLLLDRL)23 is available for the identification of N-specific CD8 T cells in the mouse BAL and lung samples. The N219-227 is one of the dominant CD8 T cell epitopes within the N protein that was bioinformatically predicted8 and then confirmed in humans and mice24,25.
Two groups of C57BL/6 mice (n = 5 per group) were IM vaccinated with either empty LNP (mock) or mRNA-N (1 μg) at week 0 (prime) and week 3 (boost). Two weeks after boost vaccination (week 5), lung and BAL samples were collected for analysis of respiratory immune response. Serum and spleen samples were also collected for analysis of systemic immune response for comparison (Fig. 2A). Single cell suspensions prepared from lung and BAL were stained for CD3, CD4, CD8, CD44, CXCR6, and SARS-CoV-2 N-tetramer, to identify activated T cells (based on CD44)26, T cells with tissue-homing potential (CXCR6)27, and vaccine-elicited, N-specific CD8 T cells (tetramer+). Vaccine-induced binding antibodies (IgG and IgA) were also examined in the BAL.
Fig. 2: Respiratory T cell response induced by mRNA-N in mice.
A Mouse experimental design and timeline (Created with BioRender.com). Two groups of C57BL/6 mice (n = 5/group) were intramuscularly vaccinated with either empty LNP (mock) or mRNA-N vaccine (1 μg) at weeks 0 and 3. Two weeks after booster dose (week 5), immune responses were analyzed. B, C Analysis of tetramer positive, N-epitope specific T cells in the lungs by flow cytometry. B Representative flow cytometry plots for N-tetramer staining of CD8 T cells from LNP and mRNA-N vaccinated mice. C Frequencies of N epitope-specific CD8 T cells in the lungs of LNP and mRNA-N vaccine group. Analysis of total and N epitope-specific T cells in the BAL. Frequencies of activated (CD44+) CD4 and CD8 T cells (D), CXCR6+ CD4 and CD8 T cells (E), and N epitope-specific CD8 T cells (F) in BAL were examined. Data were presented as median and interquartile range, and were compared by Mann-Whiteney test between the two groups. *p < 0.05, **p < 0.01, ***p < 0.001.
Gating strategy to identify T cell populations and N-tetramer+ CD8 T cells in the lungs is shown in Supplementary Fig. 1. Representative flow cytometric plots for N-tetramer+ CD8 T cells are shown in Fig. 2B. Compared to mock control, mRNA-N vaccination elicited comparable levels of total CD4 and CD8 T cells in the lung (Supplementary Fig. 2A), and slightly higher levels of activated CD44+ (Supplementary Fig. 2B) or CXCR6+ (Supplementary Fig. 2C) CD4 and CD8 T cells in the lung. Analysis of N-tetramer straining (Fig. 2B) revealed that compared to mock control, mRNA-N vaccination elicited significant levels of N epitope-specific CD8 T cells in the lungs (p < 0.001) (Fig. 2C). Of interest, this N epitope-specific CD8 T cell response was not evident in the spleens after mRNA-N vaccination (Supplementary Fig. 3).
We next evaluated T cell response in the BAL after mRNA-N vaccination. Gating strategy for flow cytometric analysis of BAL cells is shown in Supplementary Fig. 4. Compared to mock control, mRNA-N vaccination elicited higher levels of CD44+ CD4 T cells and CD44+ CD8 T cells in the BAL, although statistical significance was only achieved for CD4 T cells (p < 0.05 for CD4) (Fig. 2D). A similar trend was observed for CXCR6+ T cells, with mRNA-N eliciting significantly higher levels of CXCR6+ CD4 T cells in the BAL compared to mock control (p = 0.01 for CD4) (Fig. 2E). Analysis of N-tetramer+ cells revealed that mRNA-N vaccination elicited a trend towards higher levels of N epitope-specific CD8 T cells in the BAL compared to mock control (p = 0.055) (Fig. 2F). Analysis of binding antibodies showed that mRNA-N vaccination induced readily detectable N-specific binding IgG in the BAL (Supplementary Fig. 5A). No binding IgA was detected following IM mRNA-N vaccination (Supplementary Fig. 5B), consistent with the previous report15. Together, the data indicate that mRNA-N vaccine elicits a modest respiratory immune response including N-specific CD8 T cells in the mouse lungs and BAL.
mRNA-S+N vaccination induces strong protection against SARS-CoV-2 Omicron BA.5 in hamstersAfter demonstrating that mRNA-N alone elicited modest protection against BA.5, we next explored whether dual mRNA-S+N vaccination induces stronger protection against this variant than mRNA-S alone. Three groups of hamsters were vaccinated with empty LNP (mock), mRNA-S (2 μg), or mRNA-S+N (2 μg for each mRNA) at weeks 0 and 3, followed by intranasal challenge at week 5. On 2 (n = 5) and 4 (n = 5) DPI, vaccine-induced protection was analyzed based on viral loads (Fig. 3A). Analysis of viral RNA in the lungs revealed that, compared to mock vaccination, mRNA-S alone induced modest but significant protection, reducing the lung viral RNA copies by 22 and 4 folds at 2 and 4 DPI, respectively (Fig. 3B–C). Relative to mRNA-S alone, mRNA-S+N induced a more robust effect, leading to complete viral control with no detection of the viral RNAs on 4 DPI (mRNA-S vs. mRNA-S+N: p < 0.0001 on 4 DPI) (Fig. 3C). We previously showed that the stronger protection against an Omicron variant (BA.1) by mRNA-S+N relative to mRNA-S alone was not due to the difference in total mRNA or LNP doses11. Lastly, vaccination with mRNA-S alone and mRNA-S+N both protected the hamsters from weight loss, with no significant difference detected between the two vaccine groups (Fig. 3D).
Fig. 3: Dual mRNA-S+N vaccination protects hamsters from Omicron BA.5.
A Hamster experimental design and timeline (Created with BioRender.com). Three groups of hamsters (n = 10/group) were vaccinated intramuscularly with empty LNP (mock), mRNA-S (2 μg), or mRNA-S+N (2 μg for each mRNA) at weeks 0 and 3, followed by intranasal challenge with SARS-CoV-2 Omicron BA.5 (2 × 10⁴ pfu) at week 5. Lungs were harvested at 2 (B) and 4 (C) DPI (n = 5 at each time) for quantification of viral RNA copies by RT-qPCR. (D) Hamster body weights were monitored from 0 to 4 DPI. In (B, C), symbols represent individual animals, midlines represent the median, error bars represent the interquartile range, and the dashed line represents the lower limit of detection (LOD). The number of animals with viral loads above the LOD is noted. Data were compared among the three groups by Kruskal-Wallis test. In (D), symbols represent the mean, error bars represent the standard deviation, and the dashed line highlights 0% weight change. Weight change was compared by 2-way ANOVA followed by Tukey’s multiple comparisons test (two factors; hamsters’ weight and time). *p < 0.05, **p < 0.01, ****p < 0.0001.
mRNA-S+N vaccination induces strong protection against SARS-CoV-2 Omicron BQ.1 in hamstersTo further determine the breadth of protection by mRNA-S+N, we next examined efficacy of mRNA-S and mRNA-S+N against BQ.1 in the hamster model. BQ.1, derived from BA.5, emerged with additional spike mutations that contributed to its strong immune evasion and efficient transmission13,28. Hamsters were vaccinated at weeks 0 and 3 before intranasal challenge with BQ.1 (2 × 10⁴ pfu) at week 5 (Fig. 4A). Lungs were harvested at 2 (n = 5) and 4 (n = 5) DPI with hamster body weights monitored throughout the course of the experiment (Fig. 4A). Compared to BA.5 (Fig. 3) and earlier variants (BA.1 and Delta)11, BQ.1 appears to replicate to lower levels in hamsters and with faster clearance by 4 DPI (Fig. 4B, C). Similarly, body weight data indicated that nonvaccinated (mock) hamsters showed marginal weight loss through 4 DPI (Fig. 4D). This is consistent with the observations that BQ.1 is moderately pathogenic compared to BA.513,29. Vaccination with mRNA-S+N led to complete viral control with no detection of viral RNA in four out of five hamsters at 2 DPI (Fig. 4B) and five out of five hamsters at 4 DPI (Fig. 4C). Both mRNA-S and mRNA-S+N protected hamsters from the mild weight loss resulting from BQ.1 infection with no significant difference detected between the two vaccine groups (Fig. 4D).
Fig. 4: Dual mRNA-S+N vaccination protects hamsters from Omicron BQ.1.
A Experimental design and timeline (Created with BioRender.com). Three groups of hamsters (n = 10/group) were vaccinated intramuscularly with empty LNP (mock), mRNA-S (2 μg), or mRNA-S+N (2 μg for each mRNA) at weeks 0 and 3, followed by intranasal challenge with SARS-CoV-2 Omicron BQ.1 (2 × 10⁴ pfu) at week 5. Lungs were harvested at 2 (B) and 4 (C) DPI (n = 5 at each time point) for quantification of viral RNA copies by RT-qPCR. D Hamster body weights were monitored from 0 to 4 DPI. In (B, C), symbols represent individual animals, midlines represent the median, error bars represent the interquartile range, and the dashed line represents the lower limit of detection (LOD). The number of animals with viral loads above the LOD is noted. Log10 normalized data was compared among the three groups by Kruskal-Wallis test. In (D), symbols represent the mean, error bars represent the standard deviation, and the dashed line highlights 0% body weight change. Weight change was compared by 2-way ANOVA followed by Tukey’s multiple comparisons test (two factors; hamsters’ weight and time). *p < 0.01, **p < 0.01, ****p < 0.0001.
mRNA-S+N induces binding antibodies that manifest no detectable neutralizing activities against BA.5 and BQ.1 variantsIn the above hamster experiments (Fig. 3, 4), serum samples were collected prior to viral challenge (two weeks after booster) for analysis of vaccine-induced antibody responses (Fig. 5). Binding antibody endpoint titers (EPTs) were determined by ELISA. Compared to the mock control, both mRNA-S alone and mRNA-S+N induced significant levels of S-specific binding antibodies in sera (Fig. 5A–C). Median IgG EPTs for both mRNA-S and mRNA-S+N groups were 104.9 (Fig. 5A). Other than IgG, serum IgA and IgM were also detectable. Median IgA EPTs for mRNA-S and mRNA-S + N were 103.95 and 104.43, respectively (Fig. 5B), and median IgM EPTs for mRNA-S and mRNA-S+N were 102.76 and 103, respectively (Fig. 5C). These serum samples were also examined for neutralization against SARS-CoV-2 WA.1, BA.1, BA.5, and BQ.1 using the plaque-reduction neutralization test (PRNT) with corresponding live virus. While the sera of hamsters immunized with mRNA-S and mRNA-S+N showed strong neutralizing activity against the ancestral WA.1 strain (Fig. 5D), their neutralizing activities against BA.1 were substantially reduced: 4/10 samples had weakly detectable neutralization in the mRNA-S alone group and 5/10 weakly detectable neutralization in the mRNA-S+N group. Notably, neutralizing activities of these sera against BA.5 and BQ.1 variants were completely lost, with all samples showing undetectable neutralization activity for these variants (Fig. 5D). These data are consistent with the observations that BA.5 and BQ.1 manifest strong immune escape from the ancestral S-based vaccine induced neutralization. The data also show that the strong viral control by mRNA-S+N in the hamster lungs is occurring even in the absence of detectable neutralizing antibodies, indicating a role of cellular immunity in mRNA-S+N induced protection against variants as described previously11.
Fig. 5: Serum antibody response in hamsters following mRNA vaccination.
S-specific binding IgG (A), IgA (B), and IgM (C) endpoint titers (EPTs) in the hamster sera at week 5 after immunization (n = 4 for LNP; n = 10 for mRNA-S or mRNA-S+N). Log10 normalized EPTs for each group is indicated. D Neutralization of the hamster sera (n = 10 for all three groups) against SARS-CoV-2 WA.1, BA.1, BA.5, and BQ.1 as measured by PRNT50. Data are presented as median with interquartile range. Dotted lines in each plot indicates LOD for each assay. Number of animals in each group with neutralizing titers above the LOD is noted in (D). Data were compared among the three groups by Kruskal-Wallis test. *p < 0.05, **p < 0.01, ****p < 0.0001.
mRNA-S+N vaccination induces strong respiratory T cell responses in the lungs and bronchoalveolar lavageAfter showing that mRNA-S+N vaccine induced complete viral control in the hamster lungs in the absence of detectable neutralizing antibodies, we next examined respiratory immune responses induced by mRNA-S+N as compared to mRNA-S alone. For this, we utilized the C57BL/6 mouse model and the available S- (S539–546: VNFNFNGL) and N- (N219–227: LLLDRLNQL) specific MHC-I tetramers. Similar to N219–227 (Fig. 2), S539-546 (VNFNFNGL) is a highly dominant CD8 T cell epitope within the S protein that was predicted based on bioinformatic analysis and later validated in the context of both infection and vaccination30,31,32. Multiple vaccine studies have confirmed a protective role of the CD8 T cell response induced against this particular S epitope33,34.
Three groups of C57BL/6 mice (n = 5 per group) were vaccinated (IM) with empty LNP (mock), mRNA-S alone (1 μg), or mRNA-S+N (1 μg per mRNA) at week 0 and 3, followed by analysis of vaccine-induced immune responses in the lungs and BAL (Fig. 6A). T cell responses in the spleen were also examined for comparison. The gating strategies to identify T cell populations and tetramer+ CD8 T cells are shown in Supplementary Fig. 1, Supplementary Fig. 4, and the main figures.
Fig. 6: Respiratory T cell response following different mRNA vaccination.
A Mouse experimental design and timeline (Created with BioRender.com). Three groups of C57BL/6 mice (n = 5/group) were intramuscularly vaccinated with either empty LNP (mock), mRNA-S vaccine (1 μg), or mRNA-S+N vaccine (1 μg for each mRNA) at week 0 and 3. Two weeks after final dose (week 5), mice were euthanized and immune analyses were performed. Analysis of activated T cells in the lungs (B), BAL (C), and spleens (D) of mice. Expression of CD44 on CD4 and CD8 T cells was examined by flow cytometry and shown as percent CD44+ of the parental population. Expression of CXCR6 on CD4 and CD8 T cells in the lungs (E), BAL (F), and spleens (G) was examined by flow cytometry and shown as percent CXCR6+ of the parental population. H Representative flow cytometry plots for S- and N-tetramer staining of CD8 T cells from LNP, mRNA-S, and mRNA-S+N vaccinated mice. Tetramer+ (S- and N-epitope specific CD8 T cells) in the lungs (I), BAL (J), and spleens (K) of mice. Data are presented as median and interquartile range. Kruskal-Wallis test was used for statistical comparison among the three groups. *p < 0.05, **p < 0.01.
In the lungs, compared to mock control, both mRNA-S and mRNA-S+N elicited slightly higher levels of total activated (CD44+) CD4 T cells, although only the mRNA-S group reached statistical significance (p < 0.05 for mock versus mRNA-S) (Fig. 6B, left). A significant increase in the frequency of total activated CD8 T cells in the lungs of mRNA-S+N-vaccinated mice (median: 15%) was observed when compared to the mock group (median: 6.53%) (p < 0.01) (Fig. 6B, right). In the BAL, a stronger effect was observed. Compared to mock control, mRNA-S+N vaccine elicited substantially higher levels of activated CD4 (Mock versus mRNA-S+N: 20.1%, 88.5%; p < 0.01) and CD8 (Mock versus mRNA-S+N: 14.6%, 92.9%; p < 0.01) T cells (Fig. 6C). Compared to mRNA-S+N, mRNA-S alone induced weaker CD4 and CD8 T cell activation in the BAL and no statistical significance was detected between the two vaccine groups (Fig. 6C). In contrast, in the spleen, we only noted a modest increase in CD4 and CD8 T cell activation in the mRNA-S+N group compared to mock control (Fig. 6D). In all these compartments, no significant difference in the frequency of total CD4 and CD8 T cells was observed among the groups (Fig. S6).
We next examined frequencies of T cells positive for CXCR6 in the lungs, BAL, and spleen (Fig. 6E–G). A pattern similar to the activated T cells was revealed. Compared to the mock control, mRNA-S+N elicited significantly higher levels of CXCR6+ CD8 T cells in the lungs (1.47% versus 6.99%; p < 0.01) (Fig. 6E) as well as in the BAL (6.08% versus 51.6%, p < 0.01) (Fig. 6F). In the BAL, mRNA-S+N also induced a markedly higher level of CXCR6+ CD4 T cells when compared to the mock control (7.87% versus 66.9%, p < 0.01) (Fig. 6F). These data indicate lung-homing potential of the induced T cells by mRNA-S+N. In contrast, mRNA-S alone only elicited a trend towards increase in CXCR6+ CD4 and CXCR6+ CD8 T cells in the BAL when compared to the mock control (Fig. 6F). As anticipated, lower levels of CXCR6+ T cells were observed in the spleens when compared to those in the BAL and lung following mRNA-S or mRNA-S+N vaccination (Fig. 6G).
Antigen-specific CD8 T cells in these compartments were measured (Fig. 6H–K). Representative flow cytometry plots for S- and N-tetramer staining showed that mRNA-S alone elicited S-specific, but not N-specific, CD8 T cells, while mRNA-S+N vaccine elicited both S- and N-specific CD8 T cells, supporting the specificity of the tetramer staining (Fig. 6H). We observed that, compared to mRNA-S alone, mRNA-S+N vaccine elicited higher levels of S-specific CD8 T cells in the lungs (p < 0.05) (Fig. 6I). A more profound effect was observed in the BAL, where mRNA-S+N induced much higher levels of S-specific CD8 T cells (~36%) than mRNA-S (~14%) (Fig. 6J). Of note, while mRNA-S+N also elicited detectable N-specific CD8 T cells in the lungs (Fig. 6I), their levels in the BAL were low (Fig. 6J). Lastly, only low levels of S-epitope specific CD8 T cells were detected in the spleen after mRNA-S+N vaccination (Fig. 6K). Together, these data indicate that mRNA-S+N elicits strong respiratory T cell responses, especially S-specific CD8 T cells, after IM mRNA immunization. The data also reveal that the presence of N for co-immunization has some synergistic effect and augments S-specific T cell response in the respiratory tract, a finding also observed for systemic immunity in our previous study11.
Vaccine-induced binding antibodies in the BAL were also examined. Compared to mock control, both vaccines induced significant levels of S-specific binding IgG (Fig. S7). As expected, only mRNA-S+N vaccination resulted in the production of both S- and N-specific binding IgG in the BAL (Fig. S7), whereas mRNA-S alone only elicited S-specific binding IgG. Unlike IgG, there was a lack of detectable antigen-specific IgA in the BAL, consistent with the result of mRNA-N vaccination (Supplementary Fig. 5) as well as with a previous study reporting limited mucosal IgA production following IM mRNA immunization15.
留言 (0)