Protein purification and labelingMeCP2
Human MeCP2 in the pTXB1 plasmid (Addgene #48091) was propagated in Escherichia coli 5-alpha cells (New England BioLabs). Following mutagenesis for fluorescent labeling and/or creating RTT mutations using the Q5 mutagenesis kit (New England BioLabs), plasmids were transformed into E. coli BL21(DE3) cells (Thermo Fisher) for overexpression. Expression and purification of MeCP2 started with chitin–intein MeCP2 fusion proteins. The protocol was adapted from a previously published protocol57 and the manufacturer’s instructions for the IMPACT system (New England BioLabs). Four liters of cells in the presence of 100 μg ml−1 carbenicillin were grown to an OD600 of 0.5 and induced with 0.5 mM isopropyl β-d-1-thiogalactopyranoside overnight at 16 °C. Lysates were prepared by resuspending cell pellets in column buffer (20 mM Tris hydrochloride pH 8.0, 500 mM sodium chloride, 0.1% Triton X-100 and 0.1 mM phenylmethylsulfonyl fluoride (GoldBio)) followed by sonication and centrifugation at 23,700g for 30 min. Lysates were applied to a 10 ml bed volume of chitin resin (New England BioLabs) that was preequilibrated with column buffer for 1.5 h at 4 °C on a tube rotator. The resin was washed with 20× resin bed volumes of column buffer and then flushed with 3× resin bed volumes of column buffer supplemented with 50 mM dithiothreitol before being capped and left overnight at room temperature for intein cleavage. Fractions were eluted with column buffer and analyzed by SDS–PAGE, and peak fractions were pooled, concentrated and added to a Superdex 200 Increase 10/300 GL column equilibrated with column buffer attached to an AKTA pure system (Cytiva) for gel filtration. Peak fractions were analyzed by SDS–PAGE and aliquoted for fluorescent labeling or flash frozen and stored in −80 °C.
To obtain full-length MeCP2 site-specifically labeled with a Cy3 or Cy5 fluorophore, two out of three native cysteine residues were mutated to serine (C339S and C413S), leaving a single cysteine residue (C429) located near the end of the disordered CTD. None of the labeling positions used has been implicated in RTT. MeCP2C339S,C413S (referred to as MeCP2 in this study) was expressed and purified as described above and subsequently incubated with 3× molar excess of Tris carboxy ethyl phosphene at 4 °C for 30 min. Cy3- or Cy5-maleimide dye (Cytiva) was added at a 20:1 molar ratio of dye to MeCP2 and incubated at 4 °C overnight in the dark. To remove free dye, labeled protein was dialyzed in 3× 1-liter column buffer and subsequently analyzed by SDS–PAGE, concentrated, aliquoted, flash frozen and stored in −80 °C. A similar protocol was performed to fluorescently label MeCP2 mutants, several of which contain different labeling positions to accommodate for truncating mutations: Cy3-C429 T158M MeCP2, Cy3-C429 P225R MeCP2, Cy3-S242C R270X MeCP2, Cy3-S194C K210X MeCP2 and Cy3-S13C R162X MeCP2. The labeling efficiencies for these MeCP2 constructs range from 80% to 100%.
Histone octamers
Recombinant human core histones were purified and labeled with an LD655 or AF488 fluorophore as previously described58. Briefly, core histones were individually expressed in E. coli BL21 (DE3) pLysS cells, extracted from inclusion bodies and purified under denaturing conditions using Q and SP ion exchange columns (GE Healthcare). H4L50C was labeled with LD655-maleimide (Lumidyne Technologies) under denaturing conditions. Octamers were reconstituted by adding equal molar amounts of each core histone (LD655-H4L50C, H3.2, H2A and H2B) and purified by gel filtration as described previously. The same protocol was performed to obtain histone octamers containing AF488-H2AK12C.
TBLR1
Recombinant human TBLR1CTD (residues 134–514) was inserted into a pCAG-TEV-3C plasmid, and the GFP fusion protein was expressed in 400 ml of suspension HEK293 cells. Cell pellet was lysed in 20 ml lysis buffer (50 mM Tris hydrochloride pH 8.0, 300 mM sodium chloride, 3 mM 2-mercaptoethanol, 0.2% NP40, 1 mg ml−1 aprotinin, 1 mg ml−1 leupeptin, 1 mg ml−1 pepstatin A, 100 mM phenylmethylsulfonyl fluoride, 2 mM ATP and 2 mM magnesium chloride) with the addition of 1 µl Benzonase (Millipore Sigma) by vortexing. The solution was nutated on a rotating nutator at 4 °C for 20 min and centrifuged at 48,300g for 30 min at 4 °C. The lysate was collected, added to 1 ml of GFP nanobody-coated agarose bead slurry that was preequilibrated with wash buffer (50 mM Tris hydrochloride pH 8.0, 300 mM sodium chloride and 3 mM 2-mercaptoethanol) and nutated on a rotating nutator at 4 °C for 1.5 h. The beads were pelleted by centrifugation at 1,000g for 2 min, and the supernatant was removed. The beads were washed 3× with 1 ml wash buffer to remove detergent and protease inhibitors. The beads were resuspended in 250 µl wash buffer, and 250 µl of 3C protease was added. The bead solution was nutated at 4 °C in the rotating nutator overnight. Beads were then pelleted by centrifugation at 1,000g for 2 min at 4 °C, and the supernatant was collected. This step was repeated 3× after the addition of wash buffer to collect 5 ml of supernatant in total. The eluted protein was then concentrated and added to a Superdex 200 Increase 10/300 GL column equilibrated with wash buffer attached to an AKTA pure system (Cytiva) for gel filtration. Peak fractions were analyzed by SDS–PAGE and aliquoted for fluorescent labeling.
To attach a fluorophore to the N terminus of TBLR1CTD, the purified protein was dialyzed in 3× 1 liter of labeling buffer (45 mM HEPES pH 7.0, 200 mM sodium chloride, 1 mM dithiothreitol and 0.25 mM EDTA) and LD655-NHS dye (Lumidyne Technologies) was added at a 5:1 molar ratio of dye to TBLR1CTD. The mixture was incubated at room temperature for 1 h in the dark, and the reaction was quenched by adding 30 mM Tris hydrochloride pH 7.0 for 5 min at room temperature. To remove free dye, labeled protein was dialyzed in 3× 1 liter of storage buffer (45 mM HEPES pH 7.6, 200 mM sodium chloride and 1 mM dithiothreitol) and subsequently analyzed by SDS–PAGE, concentrated, aliquoted, flash frozen and stored in −80 °C. The final labeling efficiency was estimated to be ~85%.
Recombinant Saccharomyces cerevisiae Nap1 was expressed and purified as previously described34. Recombinant linker histone H1.4A4C was purified and labeled with a Cy3 fluorophore as previously described59.
DNA substrate preparationBiotinylated λ DNA
To generate terminally biotinylated double-stranded DNA (dsDNA), the 12-base overhang on each end of the bacteriophage λ genomic DNA from Dam and Dcm methylation-free E. coli (48,502 bp; Thermo Fisher) was filled in with a mixture of unmodified and biotinylated nucleotides by the exonuclease-deficient DNA polymerase I Klenow fragment (New England BioLabs). The reaction was performed by incubating 17 µg of λ DNA (dam-, dcm-), 32 µM each of dGTP/biotin-14-dATP/biotin-11-dUTP/biotin-14-dCTP (Thermo Fisher) and 5 U of Klenow in 1× NEBuffer 2 (New England BioLabs) (120 µl total volume) at room temperature for 15 min. The reaction was stopped by adding 10 mM EDTA and heat inactivated at 75 °C for 20 min. Biotinylated DNA was then ethanol precipitated for at least 1 h at −20 °C in 3× volume ice-cold ethanol and 300 mM sodium acetate pH 5.2. Precipitated DNA was recovered by centrifugation at 13,500g for 30 min at 4 °C. After removing the supernatant, the pellet was washed twice with 1 ml of 70% ethanol, each round followed by centrifugation at 13,500g for 1 min at 4 °C and removal of the supernatant. The resulting pellet was air dried, resuspended in TE buffer (10 mM Tris–HCl pH 8.0 and 1 mM EDTA) and stored at 4 °C.
CpG methylated λ DNA
To generate CpG methylated DNA, 500 ng of biotinylated λ DNA was incubated at 37 °C with 1.6 M of S-adenosylmethionine (New England BioLabs) and 20 U of CpG methyltransferase M.SssI (New England BioLabs) (20 µl total volume) overnight. The reaction was stopped by heat inactivation at 65 °C for 20 min. The DNA was then isolated by phenol–chloroform extraction by raising the volume to 250 µl, adding an equal volume of phenol:chloroform:isoamyl alcohol (25:24:1, v/v) and inverting the tube vigorously to mix. The mixture was centrifuged at 13,500g for 5 min at room temperature and the supernatant was collected. The process was repeated using the supernatant. The DNA was then purified by ethanol precipitation, resuspended in TE buffer and stored at 4 °C. Methylation efficiency was assessed by incubating the methylated DNA with CpG methylation-sensitive restriction enzyme BstUI (New England BioLabs), which is unable to perform digestion in the presence of methylation at its cut site (157 predicted sites on λ DNA).
Single-molecule experimentsExperimental setup
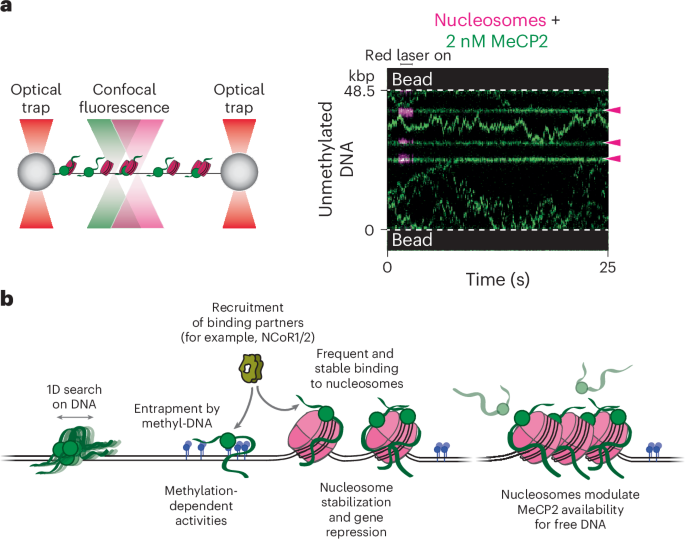
Single-molecule experiments were performed at room temperature on a LUMICKS C-Trap instrument, which combines three-color confocal fluorescence microscopy with dual-trap optical tweezers28. Data were acquired using LUMICKS Bluelake software version 1.6.16. Rapid optical trap movement was enabled by a computer-controlled stage within a five-channel flow cell (Fig. 1a). Channels 1–3 were separated by laminar flow, which were used to form DNA tethers between two 3 µm streptavidin-coated polystyrene beads (Spherotech) held in optical traps. Under a constant flow, a single bead was caught in each trap in channel 1. The traps were then moved to channel 2, and biotinylated DNA was caught between both traps as detected by an increase in the force reading. Flow was stopped, and the traps were moved to channel 3 containing only buffer where the presence of a single DNA tether was confirmed by the force–distance curve. Channels 4 and 5 were loaded with proteins as described for each assay. Flow was turned off during data acquisition and visualization of protein behavior.
Fluorescence detection
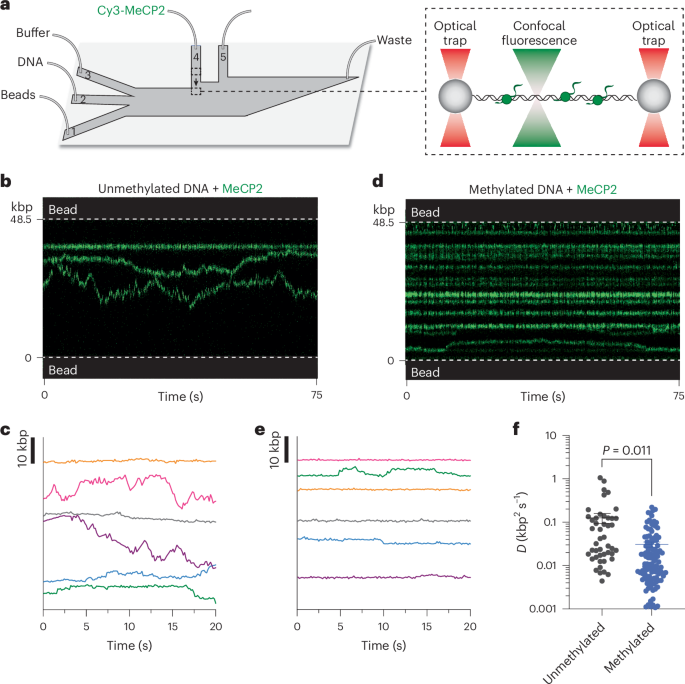
Cy3, LD655 (or Cy5) and AF488 fluorophores were excited by three laser lines at 532, 638 and 488 nm respectively. Kymographs were generated by confocal line scanning through the center of the two beads at 100 ms per line. Individual lasers were occasionally turned off to confirm the presence of other fluorophore-labeled proteins. To investigate the behavior of Cy3-MeCP2 on DNA, optical traps tethering a λ DNA molecule under 1 pN of constant tension were moved into channel 4 of the microfluidic flow cell containing 2 nM of Cy3-MeCP2 (unless specified otherwise) in an imaging buffer containing 20 mM Tris hydrochloride pH 8.0 and 100 mM sodium chloride. Following 30 s incubation, the tether was moved to channel 3 containing buffer only for removal of nonspecific binding events and imaging.
To generate nucleosome-containing DNA tethers, optical traps tethering a λ DNA molecule under 1 pN of constant tension were moved into channel 4 of the microfluidic flow cell containing 2 nM LD655-histone octamers and 2 nM Nap1 in 1× HR buffer (30 mM Tris acetate pH 7.5, 20 mM magnesium acetate, 50 mM potassium chloride and 0.1 mg ml−1 bovine serum albumin). Following a 3 s incubation (both octamer concentration and incubation time were optimized to form three to ten nucleosomes on each DNA tether), tethers were moved to channel 3 containing 0.25 mg ml−1 sheared salmon sperm DNA in 1× HR buffer for removal of nonspecific octamer binding. Formation of properly wrapped nucleosomes was confirmed by pulling the tether to generate force–distance curves showing force-induced transitions of expected distance change occurring at expected force regime60. To investigate the behavior of Cy3-MeCP2 on this substrate, a nucleosome-containing DNA tether was moved to channel 5 containing 2 nM of Cy3-MeCP2 (unless specified otherwise) in imaging buffer. Following a 30 s incubation, the tether was moved to channel 3 for imaging.
To investigate the interplay between MeCP2 and H1, AF488-nucleosome-containing DNA tethers were moved to channel 5 containing 2 nM of LD655-MeCP2 and 10 nM of Cy3-H1 in imaging buffer. Following a 30 s incubation, tethers were moved to channel 3 for imaging. The same protocol was used to investigate the interplay between MeCP2 and TBLR1, except that 2 nM of Cy3-MeCP2 and 20 nM of LD655-TBLR1CTD were used.
Force manipulation
Nucleosomal DNA tethers (unbound or bound with MeCP2/H1 proteins) were first relaxed by lowering the distance between traps in channel 3 until ~0.25 pN of force was reached. The force was zeroed, and the tether was subjected to pulling by moving one trap relative to the other at a constant velocity of 0.1 µm s−1 until the DNA entered the overstretching regime (~65 pN) or the tether broke.
Data analysis
Kymographs were processed and analyzed using a custom script (https://harbor.lumicks.com/single-script/c5b103a4-0804-4b06-95d3-20a08d65768f) that incorporates tools from the lumicks.pylake Python library and other Python modules (Numpy, Matplotlib and Pandas) to generate tracked lines using the kymotracker greedy algorithm. To determine the MSD, the tracked lines were smoothed using a third-order Savitzky–Golay filter with a window length of 11 tracked frames, and the MSD was calculated from each smoothed trajectory. The diffusion coefficient (D) was calculated by fitting the MSD curve for each trajectory to the equation for 1D diffusion where \(}}=2D^\) (α is the exponential term used to characterize normal diffusion (\(\alpha =1\)), subdiffusion (\(\alpha < 1\)) or superdiffusion (\(\alpha > 1\))). The first 1.5 s segment of each MSD curve was used for the fit61. The fit was discarded if the \(^\) value of the fit was less than 0.8. Trajectories with an α value between 0.7 and 1.3 (over 50% of all trajectories) were included for further analysis. The estimated number of molecules per trajectory was determined by dividing the photon count for each trajectory averaged over a 30 s time window by the photon count for a single Cy3-MeCP2 under the same imaging condition. The loading efficiency of MeCP2 or TBLR1 on DNA was determined per tether by dividing the number of fluorescent trajectories by the incubation time (30 s) in the protein channel (channel 4). Only stably bound proteins were considered, defined as those that survived dragging from channel 4 to channel 5 and lasted longer than 30 s in the protein-free channel (channel 5).
Force–distance curves obtained from pulling experiments were analyzed by extracting the distance change (ΔL) and the transition force of abrupt rips associated with individual nucleosome unwrapping events. Only rips occurring above 8 pN were analyzed, which correspond to unwrapping of the inner DNA turn of the nucleosome60.
nMS analysis
Mononucleosomes used for nMS were assembled by salt gradient dialysis using unlabeled WT human histone octamers as previously described62. Two micromolar of the reconstituted nucleosome was mixed with MeCP2 at varying molar ratios and then buffer-exchanged into nMS solution (150 mM ammonium acetate pH 7.5 and 0.01% Tween-20) using Zeba desalting microspin columns with a 40 kDa molecular weight cutoff (Thermo Scientific). Each nMS sample was loaded into a gold-coated quartz capillary tip that was prepared in-house and was electrosprayed into an Exactive Plus Extended Mass Range (EMR) instrument (Thermo Fisher Scientific) using a modified static nanospray source63. The mass spectrometry parameters used included the following: spray voltage, 1.22 kV; capillary temperature, 150 °C; S-lens RF level, 200; resolving power, 8,750 at m/z of 200; AGC target, 1 × 10⁶; number of microscans, 5; maximum injection time, 200 ms; in-source dissociation, 0–10 V; injection flatapole, 8 V; interflatapole, 4 V; bent flatapole, 4 V; high-energy collision dissociation, 150–180 V; ultrahigh vacuum pressure, 5 × 10⁻¹⁰ mbar; total number of scans, 100. Mass calibration in positive EMR mode was performed using cesium iodide. Raw nMS spectra were visualized using Thermo Xcalibur Qual Browser (version 4.2.47). Data processing and spectra deconvolution were performed using UniDec version 4.2.0 (refs. 64,65).
nMS analysis of the four individual histone proteins and MeCP2 confirmed their primary sequences and revealed that these proteins had undergone canonical N-terminal processing (removal of N-terminal methionine). In addition, unbound bacterial DnaK was observed in the MeCP2 sample. Overall, the following expected masses based on the sequence after N-terminal processing were used for the component proteins: H2A, 13,974.3 Da; H2B, 13,758.9 Da; H3.2, 15,256.8 Da; H4, 11,236.1 Da; MeCP2, 52,309.4 Da. Based on its sequence, the mass of the 207 bp dsDNA used was 127,801.8 Da. For the reconstituted nucleosome sample, we obtained one predominant peak series corresponding to the fully assembled nucleosome (histone octamer + dsDNA) with a measured mass of 236,277 Da (mass accuracy of 0.01%).
MP
Data were collected using a OneMP mass photometer (Refeyn) that was calibrated with bovine serum albumin (66 kDa), β-amylase (224 kDa) and thyroglobulin (670 kDa). Movies were acquired for 6,000 frames (60 s) using AcquireMP software (version 2.4.0) and default settings. Final protein concentrations were empirically determined to achieve ∼75 binding events per second. Peak mass values are predicted to fall within ~5% error. Raw data were converted to frequency distributions using Prism 9 (GraphPad) and a bin size of 5 or 10 kDa.
EMSA
In a buffer containing 20 mM Tris hydrochloride pH 8.0 and 100 mM sodium chloride in a total volume of 20 µl, 147 bp or 207 bp unmethylated or CpG methylated DNA or mononucleosome wrapped with 207 bp unmethylated DNA at described concentrations was incubated with an indicated molar ratio of MeCP2 at room temperature for 10 min. Then, 3.6 µl of 2 M sucrose was added and 15 µl of each sample was run on a 6% native PAGE gel at 110 V for 70 min (for DNA sample) or 90 min (for nucleosome sample). The DNA was stained with SYBR Safe DNA Gel Stain (Thermo Fisher) and visualized using a gel imager (Axygen).
Statistical analysis
The errors reported in this study represent s.d. or s.e.m. P values were determined from two-tailed unpaired t-tests (with Welch’s correction as specified in each figure caption) for comparison between two conditions and determined from one-way analysis of variance (ANOVA) with Tukey’s tests for comparison between multiple conditions using Prism 10 (GraphPad).
Reporting summary
Further information on research design is available in the Nature Portfolio Reporting Summary linked to this article.


留言 (0)