
記住我


B16-F10 (ATCC CRL-6475) and B16-OVA cells (OVA-transfected B16-F10 cells) were cultured in DMEM (FBS, Gibco) supplemented with 10% fetal bovine serum (Gibco), penicillin (100 U/ml), and streptomycin (100 mg/ml). E.G7-OVA cells (ATCC CRL-2113) (OVA-transfected EL4 murine T lymphoma cells) were cultured in RPMI 1640 (Gibco) supplemented with 10% FBS (Gibco), penicillin (100 U/ml), streptomycin (100 mg/ml), and G418 (0.4 mg/ml) (Invivogen, ant-gn-1). Human embryonic kidney 293T (HEK293T) (ATCC CRL-11268) cells were cultured in DMEM (Gibco) complete medium. Mouse primary spleen lymphocytes were cultured in RPMI 1640 (Gibco) supplemented with 10% FBS (Gibco), penicillin (100 U/ml), streptomycin (100 mg/ml), 1 mM sodium pyruvate (Gibco), 55 μM 2-mercaptoethanol (Gibco), and 2 mM L-glutamine. All of these cell lines were cultured at 37 °C with humidified 5% CO2. A Mycoalert Mycoplasma Detection Kit (Lonza) was routinely used to monitor mycoplasma contamination.
MiceAll mice were subjected to specific-pathogen-free conditions (temperature: 21–25 °C; humidity: 30-70%; dark/light cycle: 12 h/12 h) in the State Key Laboratory of Biotherapy (Sichuan University). The mice were sacrificed when the tumor volume reached 1600 mm3 or when they were in poor condition and expected to die soon. All animal experiments were approved by the Institutional Animal Care and Use Committee of Sichuan University (Chengdu, Sichuan, China). C57BL/6 (Beijing Vital River Laboratory Animal Technology Co., Ltd.), TLR2−/−, TLR4−/−, TLR9−/−, STING−/−, ASC−/−, NLRP3−/− and OT-1 mice (Jackson Laboratories) (female, 6–8 weeks old and ~20 g weight) were used.
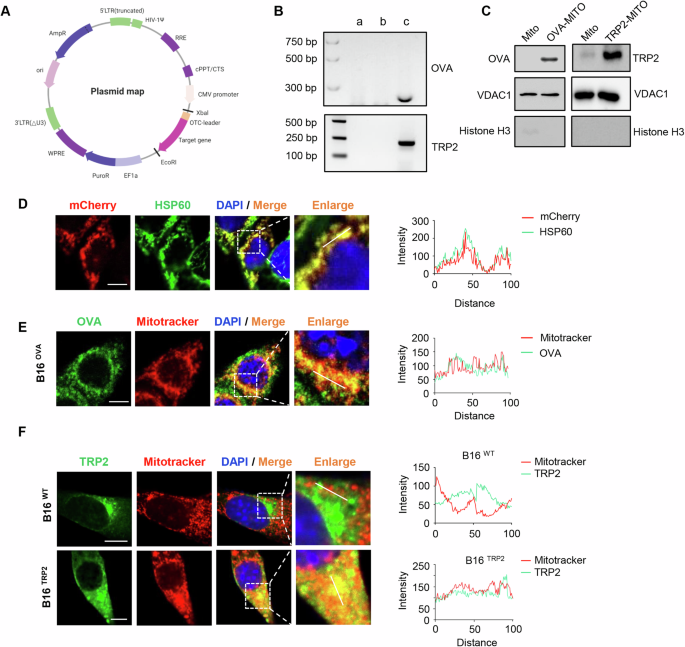
Construction of OVA-MITO- and TRP2-MITO-expressing cell linesWe synthesized a cDNA fragment containing sequences encoding the first 32 amino acids of the mouse OTC followed by the full-length sequence encoding OVA (GeneBank: AAB59956.1) or TRP2 amino acids 1-472 (GeneBank: 13190) or mCherry (GeneBank: UFQ89828.1). After digestion by EcoR1 and XhoI restriction enzymes, the purified OTC-OVA/OTC-mCherry fragment was inserted between the EcoR1 and XhoI sites of the pCDH plasmid. Then, we engineered pLV105-TRP2 using the same approach. The constructed plasmids with the packaging vector psPAX2 and the VSV-G encoding plasmid pMD2. G (Addgene) were transiently transfected into HEK293T cells together as previously described [59]. To generate a B16-F10 cell line stably expressing OTC-OVA (OTC-TRP2 and OTC-mCherry), lentiviral particles were transduced into B16-F10 cells, and the clones were selected with puromycin dihydrochloride (2 ng/ml).
Mitochondria lysate preparationCells were collected and resuspended in PBS and washed twice with PBS. A mitochondrial isolation kit (Sigma–Aldrich, 0000104130) was used for the isolation of mitochondria according to the manufacturer’s instructions. In brief, the cells were resuspended in mitochondrial isolation buffer and homogenized with a Dounce homogenizer. Nuclei and cell debris were removed by centrifugation at 600 × g for 10 min, and the supernatant containing mitochondria was collected. Then, the mitochondria were concentrated by centrifugation at 3500 × g for 10 min. After washing once with PBS, the mitochondria were concentrated by centrifugation at 11,000 × g for 10 min. Purified mitochondria were isolated using Percoll density gradient centrifugation [60]. Next, the pellet of purified mitochondria was resuspended in endotoxin-free PBS (Solarbio). A BCA protein assay kit (Thermo Scientific) was used to determine the mitochondrial concentration. All the experiments in this study were performed with freshly isolated mitochondria.
RNA isolation and real-time quantitative PCRThe Cell Total RNA Isolation Kit (FOREGENE, No. RE-03113) was used for RNA extraction according to the manufacturer’s instructions. cDNA for downstream applications was synthesized using iScript reverse transcriptase (Bio-Rad). Then, cDNA was combined with the gene-specific primers SYBR Master Mix PCR Power SYBR Green (Bio-Rad, 1725124). Real-time quantitative PCR (RT‒qPCR) was performed using the CFX Connect real-time PCR system (Bio-Rad). The PCR products were electrophoresed on 1.5% agarose and visualized using ethidium bromide fluorescence.
Western blotWestern blot analysis was performed according to a standard protocol. After removing the supernatants, the cells were lysed with RIPA buffer (Beyotime Biotechnology, P0045) in the presence of protease inhibitor cocktail (Med Chem Express, HY-K0010) and phosphatase inhibitor cocktail II (Med Chem Express, HY-K0022) and boiled for 10 min. Then, the proteins were loaded (10 μl/lane), resolved by 12.5% SDS‒PAGE and electroblotted onto PVDF membranes (Millipore). After blocking with 5% (weight/vol) skim milk in Tris-buffered saline–0.1% Tween-20 for 1 h (TBST) at room temperature (RT), PVDF membranes were incubated with the primary antibody at 4 °C overnight. Then, PVDF membranes were washed three times with TBST and subsequently incubated with the secondary antibody in TBST-BSA for 1 h at RT. We replaced the WB blocking buffer with containing primary antibodies (anti-TRP2 mAb, anti-anti-VDAC1 mAb, and anti-Histone H3 mAb) and incubated them overnight at 4 °C. A Supersignal West Pico kit (Thermo Fisher Scientific) was used to detect HRP on PVDF membranes.
Immunofluorescence stainingCells were cultured overnight (5 × 10³ cells/well) in 24-well plates placed with glass coverslips. Next, the supernatant of the culture medium was aspirated, and the cells were fixed with 4% paraformaldehyde for 30 min, followed by permeabilization with 0.4% Triton X-100. The cells were blocked with 5% fetal bovine serum and washed three times with PBS. The cells were incubated with the indicated primary antibodies, including HSP60 (Abcam, ab46798), OVA (Abcam, ab181688), TRP2 (Biorbyt, orb227952), and LMP2 (Hangzhou Huaan Biotechnology Co., Ltd, ET7107-24), and were then labeled with Goat anti-Rabbit IgG (Heavy Chain) Recombinant Superclonal™ Secondary Antibody, Alexa Fluor® 488 conjugate (Invitrogen, A27034). Finally, the fluorescent signals of the cells were analyzed using a Zeiss LSM 710 confocal microscope. Of note, cells incubated with FITC anti-mouse CD11c antibody (Biolegend, 117306) were not repeatedly labeled with Alexa Flour secondary antibodies.
Mito-vaccine treatments in vivoTo evaluate the prophylactic effect of the Mito-vaccine, 6-week-old C57BL/6 or TLR2−/− mice were subcutaneously (s.c.) injected (the left flanks of the mice) with 100 μl PBS containing 5 μg soluble OVA (Sigma‒Aldrich, vac-pova-100), 50 μg Mito plus 5 μg soluble OVA, 50 μg Mito or 50 μg OVA-MITO on day 0, 14 and 28. One week after the last immunization, mice were s.c. inoculated with 1×10⁶ E.G7-OVA or 2 × 10⁵ B16-OVA tumor cells on the right flank. For the B16-F10 models, C57BL/6 mice were s.c. injected (the left flanks of the mice) with 100 μl PBS containing 5 μg soluble TRP2, 50 μg Mito or 50 μg TRP2-MITO on day 0, 14 and 28. One week after the last injection, mice were s.c. inoculated with or without 2 × 10⁵ B16-F10 tumor cells on the right flank. One week after tumor inoculation, tumor volume was measured every two days using an electronic caliper and calculated according to the formula (length × width2 × 0.52).
To assess the therapeutic effect of the Mito-vaccine, the mice were s.c. inoculated with 1 × 10⁶ E.G7-OVA or 2 × 10⁵ B16-OVA tumor cells on day 0 and then vaccinated three times with 5 μg soluble OVA, 50 μg Mito plus 5 μg soluble OVA or 50 μg OVA-MITO on day 3, 10 and 17. For the B16-F10 models, the mice were s.c. inoculated with 2 × 10⁵ B16-F10 tumor cells on day 0 followed by three inoculations with 100 μl PBS, 50 μg Mito or 50 μg TRP2-MITO on day 3, 10 and 17. One week after the inoculation of tumor cells, tumor volume was measured every two days using an electronic caliper and calculated according to the formula (length × width2 × 0.52).
To further investigate the therapeutic effect of the Mito-vaccine in combination with PD-1 antibodies, 6-week-old C57BL/6 mice were s.c. inoculated with 2 × 10⁵ B16-F10 tumor cells on day 0. Then, the mice were vaccinated by s.c. injecting 5 μg soluble TRP2, 50 μg TRP2-MITO or 50 μg Mito on day 3, 10 and 17. Three days after tumor inoculation, mice were intraperitoneally (i.p.) administered 10 mg/kg anti-PD-1 antibodies or isotype-matched control antibodies every 5 days. One week after tumor inoculation, tumor volume was measured every two days using an electronic caliper and calculated according to the formula (length × width2 × 0.52).
Tumor microenvironmentTo analyze immune cells infiltrating the tumor microenvironment, C57BL/6 mice were sacrificed on day 14 after incubation with B16-OVA, and the tumor tissues were isolated and digested with collagenase type IV (Gibco, USA) at 37 °C for 30 min. The cells were washed three times with PBS and incubated for 30 min at 4 °C with the following antibodies: PerCP-Cyanine 5.5-conjugated anti-mouse CD3 (Biolegend, 100218), BV421-conjugated anti-mouse Gr1 (Biolegend, 108445), FITC-conjugated anti-mouse CD4 (Biolegend, 100405), PE-conjugated anti-mouse CD107a (Biolegend, 121612), PE-conjugated anti-mouse F4/80 (Biolegend, 123110), APC-conjugated anti-mouse CD8a (Biolegend, 100712), APC-conjugated anti-mouse CD206 (Biolegend, 141708), FITC-conjugated anti-mouse CD45 (Biolegend, 157214), PE-Cy7-conjugated anti-mouse CD11c (Biolegend, 117318), and FITC-conjugated anti-mouse CD11b (Biolegend, 101206). Samples were acquired using a NovoCyte flow cytometer (ACEA Biosciences), and data were collected and analyzed using NovoExpress software.
In vivo memory T-cell responseImmunized C57BL/6 mice (6–8 weeks) were sacrificed on day 7 after the last injection. The live and dead cells were detected by using a LIVE/DEAD® Fixable Near-IR Dead Cell Stain Kit (Invitrogen, 2277713). The splenic lymphocytes were harvested and then incubated with the following antibodies: FITC-conjugated anti-mouse CD62L (Biolegend, 104406), PerCP-Cyanine5.5-conjugated anti-mouse CD69 (Biolegend, 104522), APC-conjugated anti-mouse CD8 (Biolegend, 100712), BV421-conjugated anti-mouse CD4 (Biolegend, 116023), and BV510-conjugated anti-mouse CD44 (Biolegend, 103044). Samples were acquired and analyzed by a NovoCyte flow cytometer (ACEA Biosciences) with NovoExpress software.
Analysis of DC mobilization and activation in vivoTo analyze DC mobilization and activation in vivo, ten C57BL/6 mice (n = 5 each group) were intradermally injected with PBS, Mito (50 µg). 3h, 6h and 18 h later, the mice were sacrificed, and single-cell suspensions were prepared from the skin and right draining lymph nodes (popliteal lymph nodes and inguinal lymph nodes). The cells were then incubated for 30 min at 4 °C with a combination of fluorochrome-conjugated antibodies against the following surface markers: PerCP-Cyanine5.5-conjugated anti-mouse CD45 (Biolegend, 103132), BV421-conjugated anti-mouse CD11c (Biolegend, 117343), BV650-conjugated anti-mouse MHC II (Biolegend, 107641), PE-conjugated anti-mouse CD8a (Biolegend, 162304), APC-conjugated anti-mouse CD103 (Biolegend, 121414), FITC-conjugated anti-mouse CD11b (Biolegend, 101206), PE-Cy7-conjugated anti-mouse B220 (Biolegend, 103222), and BV421-conjugated anti-mouse CD197 (Biolegend, 120120). Samples were collected using a NovoCyte flow cytometer (ACEA Biosciences).
DC maturation in vitroBone marrow-derived DCs (BMDCs) from wild-type or TLR2−/− mice and TLR4−/−, TLR9−/−, STING−/−, ASC−/−, and NLRP3−/− mice were prepared as described previously [61] and cultured in RPMI 1640 (Gibco) supplemented with 10% FBS (Gibco), penicillin (100 U/ml), streptomycin (100 mg/ml) with IL-4 (10 ng/ml) (PeproTech, AF-214-14) and GM-CSF (20 ng/ml) (PeproTech, AF-315-03). The activation and maturation of BMDCs were detected after incubation with OVA-MITO or mitochondria lysate for 24 h. Briefly, the culture supernatants were collected, and the levels of IL-6, TNF-α and IL-12p70 in DC-conditioned medium were measured using ELISA kits (Invitrogen, 88-7064-88, 88-7324-88, 88-7121-88). The cells were collected and stained with FITC-conjugated anti-mouse CD40 (Biolegend, 553790), PE-conjugated anti-mouse CD86 (Biolegend, 105008), APC-conjugated anti-mouse CD11c (Biolegend, 117310), BV421-conjugated anti-mouse CD80 (Biolegend, 104725), and PE-Cy7-conjugated anti-mouse MHC II antibodies (Biolegend, 107630). Samples were collected using a NovoCyte flow cytometer (ACEA Biosciences).
Mitochondrial staining and DC uptakeTo label the mitochondria, the MitoTracker Red CMXRos dye (Thermo Fisher, I34154) stock solution was diluted to a working concentration of 50 nM by supplementing the medium. B16-F10 cells were then incubated in MitoTracker Red CMXRos for 20 min at 37 °C. Then, the labeling solution was removed, and the cells were washed twice with the culture medium. Next, the mitochondrial isolation procedure was performed on ice in the dark as described above.
BMDCs were incubated with the prelabeled mitochondria. After incubation for 3–6 h, the DCs were washed and fixed with 4% paraformaldehyde, followed by staining with hamster primary anti-CD11c antibody (Biolegend, 117306) for 30 min. FITC-conjugated rabbit anti-hamster IgG secondary antibodies were then added and incubated for 1 h at 37 °C (Invitrogen). The cell nuclei were labeled with DAPI (Beyotime, P0131) according to the manufacturer’s instructions. The DCs were then mounted and analyzed under an LMS 710 (Carl Zeiss) confocal microscope or analyzed by a NovoCyte flow cytometer (ACEA Biosciences).
Inhibition and activation of BMDCs by TLR2 inhibitorsBMDCs from wild-type mice were pretreated with C29 (100 μM) (Med Chem Express, 363600-92-4), a specific inhibitor of TLR2, for 2 h and then treated with or without mitochondria (10 μg/ml) for 24 h. The culture supernatants were collected to measure the levels of IL-6, TNF-α and IL-12p70. The cells were incubated with the following antibodies: FITC-conjugated anti-mouse CD40 (Biolegend, 553790), PE-conjugated anti-mouse CD86 (Biolegend, 105008), APC-conjugated anti-mouse CD11c (Biolegend, 117310), BV421-conjugated anti-mouse CD80 (Biolegend, 104725), and PE-Cy7-conjugated anti-mouse MHC II (Biolegend, 107630).
DC-based immunotherapy in vivoTo assess the therapeutic effect of mitochondria-pulsed DC-based immunotherapy in vivo, mitochondria (10 μg/ml) from OVA-MITO-expressing B16-F10 cells or Vehicle-MITO-expressing B16-F10 cells were cocultured with 1 × 10⁶ C57BL/6 mouse-derived DCs per 10 cm cell culture dish, followed by LPS (10 μg/ml) to stimulate BMDCs overnight. Next, 6-week-old C57BL/6 mice were s.c. inoculated with 1 × 10⁶ E.G7-OVA or 2 × 10⁵ B16-OVA tumor cells. After three days, 1 × 10⁶ mitochondria-pulsed DCs were s.c. injected at weekly intervals for 3 weeks.
For the B16-F10 models, mitochondria (10 μg/ml) from TRP2-MITO-expressing B16-F10 cells or Vehicle-MITO-expressing B16-F10 cells were cocultured with BMDCs, which were then stimulated with LPS. The C57BL/6 mice were s.c. inoculated with 2 × 10⁵ B16-F10 tumor cells and treated with mitochondria-pulsed DCs in the same injection schedule. One week after tumor inoculation, tumor volume was measured every two days using an electronic caliper and calculated by the formula (length × width2 × 0.52).
In vivo T-cell responseC57BL/6 mice were s.c. injected with 100 μl PBS containing 5 μg soluble OVA, 50 μg mito plus 5 μg soluble OVA (OVA/mito) or 50 μg OVA-MITO at weekly intervals for 3 weeks. For the B16-F10 models, C57BL/6 mice (6–8 weeks) were s.c. injected with 100 μl PBS containing 50 μg Mito or 50 μg TRP2-MITO at weekly intervals for 3 weeks. One week after the last injection, all mice were sacrificed, and the splenic lymphocytes were harvested and purified using mouse lymphocyte separation medium (Dakewe). Isolated splenocytes were directly used for staining with TRP2-tetramers (Biolegend, CPM-1-0448) or OVA-tetramers (MBL, TS-5001-1C). After the incubation, FITC anti-mouse CD8 antibody (Biolegend, 553031) was added and incubated. This was followed by detection with a NovoCyte flow cytometer (ACEA Biosciences). Then, the freshly isolated lymphocytes were restimulated with OVA257–264 (SIINFEKL) peptide (Invivogen, vac-sin), OVA323–339 (ISQAVHAAHAEINEAGR) peptide (10 μg/ml) (Invivogen, vac-isq) or TRP2180-188 (SVYDFFVWL) (Shanghai Toshisun Biology and Technology Co., Ltd.) for 72 h. Brefeldin A (Biolegend, 420601) was added to the cell cultures 4 h before harvesting the cells. The cells were collected and stained using the LIVE/DEAD™ Fixable Violet Dead Cell Stain Kit (Invitrogen) for live cells. Then, the cells were stained with FITC anti-mouse CD8 antibody (Biolegend, 553031). Subsequently, the cells were fixed and permeabilized with a Fixation/Permeabilization Solution Kit (BD Biosciences, 554714) and incubated with PE-conjugated anti-mouse IFN-γ (Biolegend, 505808) or APC-conjugated anti-mouse granzyme B (Biolegend, 515406) overnight at 4 °C. Samples were acquired using a NovoCyte flow cytometer (ACEA Biosciences). In addition, the T-cell-conditioned medium was collected for the measurement of the levels of IFN-γ using the IFN gamma “Femto-HS” High Sensitivity Mouse ELISA Kit (Invitrogen, 88-8314-88).
Cytotoxic T lymphocyte (CTL) assayTo obtain effector T cells, splenic lymphocytes from immunized mice were isolated and stimulated with SIINFEKL peptide (10 μg/ml) in the presence of interleukin-2 (20 ng/ml) (Sigma–Aldrich) for 72 h. B16-OVA cells used as the targets were seeded in 96-well plates (5 × 10³ cells/well) and cocultured with different groups of effector T cells at different effector-to-target (E:T) ratios. After incubation for 6 h at 37 °C, the cell culture supernatants were collected, and lactate dehydrogenase activity was measured using a CytoTox96 Non-Radioactive Cytotoxic Assay kit (Promega, G1781, G1782) according to the manufacturer’s instructions.
Adoptive transfer and immunization in vivoC57BL/6 mice were s.c. injected with 5 μg soluble OVA, 50 μg mito plus 5 μg soluble OVA or 50 μg OVA-MITO following a three-dose immunization regimen spaced 7 days apart. The immunized mice were sacrificed on day 21 after the first vaccination for the collection of splenic lymphocytes, and a total of 1 × 10⁷ lymphocytes in 100 μl PBS were intravenously (i.v.) injected into C57BL/6 mice. Recipient mice were then s.c. injected with 2 × 10⁵ B16-OVA cells after the reception of lymphocytes. The tumor sizes were measured and calculated as previously described.
The proliferation assay of OT-I CD8+ T lymphocytesBMDCs derived from wild-type or TLR2−/− mice were cultured for 6 days, and the cells were then stimulated with OVA (1 μg/ml) or OVA-MITO (10 μg/ml) for 18 h. Then, the cells were collected and resuspended in RPMI 1640 for further studies.
The CD8+ T lymphocytes from the spleen of OT-1 mice were prepared through CD8 magnetic bead negative selection using a Mouse CD8+ T-Cell Isolation Kit (Stem Cell). Next, the CD8+ T lymphocytes were resuspended in 2.5 μM CFSE labeling solution and then incubated at 37 °C for 15 min. Subsequently, serum-containing medium was added and incubated for 5 min. After washing three times with PBS, the OT-1 CD8+ T lymphocytes were cocultured with OVA- or OVA-MITO-treated BMDCs at a 5:1 ratio for 48 or 72 h. The number of CD8+ T lymphocytes was counted under a white light microscope after 48 h of incubation. After 72 h of coculture, the nonadherent cells were harvested, and the CFSE fluorescence value of T cells was analyzed by flow cytometry.
Preparation and characterization of liposomesTo prepare the liposomes, cardiolipin was synthesized by the solvent injection method as previously described [62]. Briefly, cardiolipin (Sigma‒Aldrich, C0563-100MG) and cholesterol were dissolved in absolute ethanol at 65 °C (mass ratio = 2:1). This mixed solution was added dropwise through a 1 ml syringe into a stirred aqueous phase at 65 °C. The volume of this mixed solution was reduced to 2/3 by a heating magnetic stirrer at 65 °C to remove the absolute ethanol. TEM (H-600, Hitachi, Japan) and DLS (Malvern Zetasizer Nano ZS) were used to determine the size distribution and morphology of cardiolipin liposomes.
Therapeutic effect of TPR2-MITO combined with cardiolipinTo evaluate the therapeutic effect of TPR2-MITO in combination with cardiolipin, C57BL/6 mice were s.c. inoculated with 2 × 10⁵ B16-F10 tumor cells on day 0. Then, mice were s.c. injected with 50 μg TRP2-MITO on day 3, day 10, and day 17. In addition, 3 days after tumor inoculation, mice were intraperitoneally (i.p.) administered 5 mg/kg cardiolipin every 3 days. Tumor volume was measured on day 7 after inoculation and calculated as described above.
Crls1 siRNA transfection and knockdownThe following RNAi sequences were used: siCrls1 #1 (rat, 5′- CGAACACTAGCTAAGTACT-3′); siCrls1 #2 (rat, 5′-CAGCTCCAGTTTTCAATTA -3′); siCrls1 #3 (rat, 5′- AACATTCATCAGCAAGGTAAATACA-3′). Stably transfected TRP2 cells were seeded in six-well plates (2 × 10³ cells/well) and transfected with siRNA oligonucleotides specific for cardiolipin or negative control siRNA using Lipofectamine 3000 Transfection Reagent (Invitrogen, L3000-015). The next day, the cells were replenished with fresh complete media and harvested 48 h later to measure the cardiolipin RNA and cardiolipin content in the cells. The cardiolipin content was analyzed by a Cardiolipin Assay Kit (Abcam, ab241036) according to the manufacturer’s instructions.
Crls1 siRNA mito-vaccine treatment in vivoControl and Crls1 siRNA-transfected cells were treated with Lipofectamine 3000 Transfection Reagent as described above and were collected 48 h after transfection. Next, mitochondria were extracted from the siRNA-transfected cells. In addition, an in vivo experiment using a Crls1 siRNA mito-vaccine (siCrls1) and a control mito-vaccine (siScramble) was performed. Briefly, 6-week-old C57BL/6 mice were s.c. inoculated with 2 × 10⁵ B16-F10 tumor cells on day 0. Then, mice were s.c. injected with 100 μl PBS containing 50 μg siCrls1 or 50 μg siScramble on day 3, 10, and 17. One week after tumor cell inoculation, tumor volume was measured and calculated as described above.
Safety evaluation of the mito-vaccine in healthy miceTo assess the safety of different Mito-vaccines in vivo, the appearance and weight of vaccinated mice were monitored every day. The serum samples of the vaccinated mice were collected for the analysis of biochemical parameters. Specifically, the indicators of serum biochemical parameters, including aspartate aminotransferase (AST), alanine aminotransferase (ALT), blood urea nitrogen (BUN), creatinine (CREA), and alkaline phosphatase (ALP) enzymes, were detected by COBAS (Roche Diagnostics). The Anti-mitochondrial antibody content was analyzed by Anti-mitochondrial antibody (AMA) ELISA Kit (MYBIOSOURCE, MBS262592) according to the manufacturer’s instructions.
Statistical analysisAll statistical analyses were performed using GraphPad Prism software v8.02 (ns, not significant; *P < 0.05; ** P < 0.01; *** P < 0.001; and **** P < 0.0001). The data are presented as the mean ± standard error. Data were analyzed using unpaired t test or one-way ANOVA. The log-rank (Mantel-Cox) test was used to evaluate the significant difference in survival analysis.
留言 (0)