
記住我


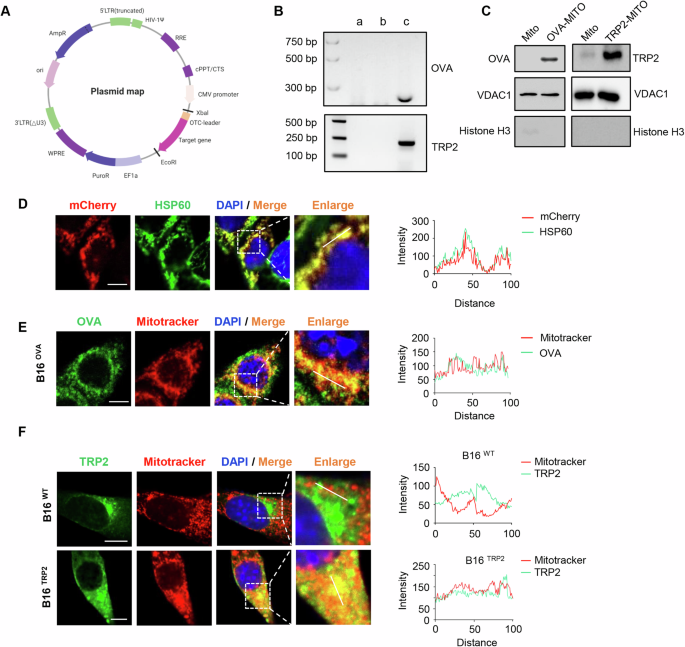
To evaluate the expression of SIRPα in steady-state and activated pulmonary ILC2, cohorts of WT mice were intranasally challenged with PBS or IL-33 (0.5 μg) for 3 days, with lung samples collected on day 4 for evaluation of SIRPα expression. Lung ILC2s were FACS sorted as CD45+, lineage-, CD127+, and ST2+ cells (Fig. S1A). Single-cell RNA sequencing (scRNAseq) was employed to investigate the transcriptome-level expression of SIRPα. The scRNAseq, visualized through UMAP plots, delineated distinct transcriptome profiles of activated and naïve ILC2s (Fig. 1A). It was found that while some cells express Sirpα under PBS conditions, activation with IL-33 leads to the emergence of a unique population of ILC2s that express Sirpα (Fig. 1A, middle panel). Furthermore, the expression level of SIRPα genes was measured in both naïve and IL-33-activated ILC2s (Fig. 1A, right panel). To investigate the correlation between Sirpα expression and Il5 and Il13, we examined the expression of these cytokines in ILC2s. It is important to note the pivotal role of Il5 and Il13 in exacerbating AHR. Our findings showed that elevated Il5 and Il13 expression in ILC2s was correlated with upregulated Sirpα (Fig. 1B). The kinetics of SIRPα protein expression was further assessed in wild-type mice. Pure populations of naive lung ILC2s were FACS sorted and cultured ex vivo for 24, 48, and 72 h in the presence of IL-33 (Fig. 1C). Expression of SIRPα gradually increased over time with IL-33 activation, reaching peak levels 72 h post-activation (Fig. 1D). To validate these results in vivo, we assessed the expression of SIRPα protein on ILC2s in a mouse model of IL33-mediated airway inflammation. Cohorts of wild-type mice were intranasally treated with IL-33 or PBS for three consecutive days (Fig. 1E). Flow cytometry analysis on the fourth day revealed a significant upregulation of SIRPα on ILC2s in response to IL-33 (Fig. 1F).
Fig. 1
SIRPα expression is upregulated in activated ILC2s and controls ILC2s function. A UMAP projections of total ILC2s (left panel) and naïve ILC2s (nILC2s) versus IL-33-activated ILC2s (middle panel). Pure populations of either naïve or IL-33-activated pulmonary ILC2s were profiled by scRNAseq. Expression level of SIRPα is demonstrated on a gradient from gray (lowest expression) to solid red (highest expression). Violin plots comparing Sirpα expression level in naïve ILC2s (blue plot) versus IL-33-activated ILC2s (red plot). Dots represent cells. B The volcano plot shows the expression level of Sirpα in Sirpα-positive ILC2 cells based on Il5 and Il13 transcript levels. The dots represent cells, and Sirpα expression level is indicated by the color scale ranging from purple (lowest expression) to yellow (highest expression). C Pulmonary nILC2s from C57BL/6 WT mice were sorted using FACS and cultured (50 × 104/ml) ex vivo in the presence of rmIL-2 (10 ng/ml), rmIL-7 (10 ng/ml), and rmIL-33 (50 ng/ml) for the indicated durations at 37 °C. Flow cytometry analysis assessed SIRPα expression over time. D Representative plots depict SIRPα protein expression levels at 0-, 24-, 48-, and 72 h post-culture. The gray plot represents Fluorescence-minus-one (FMO) control. Corresponding quantitation is presented as Mean Fluorescence Intensity (MFI); n = 3. E WT mice were intranasally challenged with rmIL-33 or PBS over 3 consecutive days. Lung ILC2s were isolated on day 4 and SIRPα expression in ILC2s was analyzed. F Representative plots of SIRPα protein expression levels in PBS and IL-33 group. The gray plot is FMO. Quantification is shown as MFI; n = 4. G Activated ILC2s were FACS-sorted based on SIRPα expression into SIRPα- (bule rectangle) and SIRPα+ (red rectangle) populations. H, I Intranuclear protein expression levels of GATA-3 (H) and Ki67 (I) in SIRPα- versus SIRPα+ ILC2s. Corresponding quantitation is presented as MFI; n = 3. J, K Frequency (%) of IL-5+ and IL-13+ ILC2s in both SIRPα- and SIRPα+ populations; n = 5. L–Q WT mice received intranasal doses of rmIL-33 over 3 consecutive days. Activated ILC2s were sorted and cultured with rmIL-2 (10 ng/ml) and rmIL-7 (10 ng/ml) in the presence of either vehicle or anti-SIRPα antibody (20 μg/mL) for 24 h. M, N GATA-3 (M) and Ki67 (N) expression levels in activated ILC2s are shown. Corresponding quantitation is presented as MFI; n = 4. O, Q Levels of IL-5 (O) and IL-13 (Q) production in the culture supernatant were measured by LEGENDPLEX and are shown in bar graphs; n = 4. R–V Activated ILC2s from WT and SIRPα KO mice were cultured with rmIL-2 and rmIL-7 for 24 h. S, T Expression of GATA-3 (S) and Ki67 (T) in activated ILC2s is depicted. Corresponding quantitation is presented as MFI; n = 4. U, V Levels of IL-5 (U) and IL-13 (V) production in the culture supernatant were measured; n = 3. Data are presented as mean ± standard error of the mean (SEM) and are representative of at least 2 independent experiments. Two-tailed student’s t-test or one-way ANOVA followed by Tukey post-hoc tests were employed for statistical analysis; *< 0.05, **< 0.01, and ***< 0.001. Schematic images are sourced by an open-access license from Servier Medical Art
We analyzed the expression of Sirpα and Cd47 in Th1, Th2, Th17, ILC1, ILC2, and ILC3 cells using publicly available scRNAseq data generated from a mouse asthma model [25]. Our findings revealed that Sirpα is most highly expressed in ILC2s, while Cd47 is expressed on a variety of immune cells (Fig. S1B). Additionally, we examined the expression of Sirpα and Cd47 in immune cells, including ILC2s, within the intestinal tract and abdominal cavity of a mouse model of inflammatory bowel disease using public databases [26], and the results were comparable to the mouse asthma model (Fig. S1C). We further validated these findings using our IL-33 stimulation model, which demonstrated that ILC2s exhibited the highest SIPRα expression at the protein level, while CD47 was expressed on many different immune cells (Fig. S1D and S1E). Overall, these results suggest that targeting SIRPα on ILC2s may be a feasible approach for treating asthma.
ILC2s were further classified into SIRPα+ and SIRPα- based on the expression of SIRPα protein (Fig. 1G). GATA-3, an activation marker for ILC2s, exhibited significantly higher expression in SIRPα+ ILC2s compared to their SIRPα- counterparts (Fig. 1H). Furthermore, the proliferation marker Ki67 was markedly upregulated in SIRPα+ ILC2s (Fig. 1I). Functionally, SIRPα+ ILC2s exhibited a notable higher frequency of IL-5+/IL-13+ cells compared to SIRPα- counterparts (Fig. 1J, K). These results suggest that SIRPα is upregulated in activated lung ILC2 at the transcriptome and protein levels.
SIRPα controls ILC2 activation, proliferation, and cytokine productionHaving established the inducibility of SIRPα in activated ILC2s, we proceeded to investigate its impact on ILC2s functionality. WT mice were treated with IL-33 for three consecutive days (i.n.). On the fourth day, lung ILC2s were isolated and cultured in the presence of recombinant mouse (rm)IL-2, rmIL-7, and either vehicle or anti-SIRPα blocking antibody for 24 h (Fig. 1L). The absence of cytotoxic effects from anti-SIRPα antibody, we confirmed using annexin-V/DAPI staining (Fig. S1F). Evaluation of GATA-3 expression, an activation marker for ILC2s, revealed that ILC2s treated with the anti-SIRPα antibody exhibited significantly higher GATA-3 expression compared to the vehicle group (Fig. 1M). Moreover, the expression of Ki67, a marker of proliferative activity, showed a significant increase in ILC2s treated with anti-SIRPα antibody (Fig. 1N). Notably, anti-SIRPα antibody treatment significantly boosted the secretion of ILC2s effector cytokines IL-5 and IL-13 in the culture supernatant (Fig. 1O, P). Building upon these observations, we sought to elucidate the role of SIRPα in ILC2 function by utilizing SIRPα knockout (SIRPαKO) mice. Intranasal administration of IL-33 into SIRPαKO, and WT mice for three consecutive days was followed by sorting pure populations of lung ILC2s and ex vivo culture of them (Fig. 1Q). Notably, in the deficiency of SIRPα, ILC2s exhibited significantly increased expression of the activation marker GATA-3 and the proliferation marker Ki67 (Fig. 1R, S). Additionally, the secretion levels of IL-5 and IL-13 in the culture supernatant were elevated compared to WT (Fig. 1T, U). Furthermore, the cytokine production capacity per cell was examined by flow cytometry with intracellular staining of IL-5 and IL-13. The percentage of IL-5 + IL-13+ was significantly increased in ILC2s of SIRPα KO compared to ILC2s of WT (Fig. S1G). The results suggest that the deficiency of SIRPα itself results in heightened activation of ILC2s, enhancing cytokine secretion and cell proliferation. Furthermore, SIRPα may exert an inhibitory role in ILC2 activation ex vivo.
SIRPα effectively controls ILC2-induced AHR and lung inflammationIn our pursuit of elucidating the role of SIRPα signaling in the regulation of AHR, we employed SIRPα KO mice. Cohorts of WT and SIRPα KO mice underwent intranasal administration of IL-33 or PBS for three consecutive days (Fig. 2A). On day 4, we measured lung resistance and dynamic compliance, followed by the analysis of BAL samples (Fig. S2). SIRPα KO mice exhibited significantly higher pulmonary resistance compared to WT mice (Fig. 2B), with an exacerbated response observed in dynamic compliance results (Fig. 2C). The number of ILC2s in SIRPα KO mice was significantly increased compared to WT mice (Fig. 2D). SIRPα deficiency significantly intensified lung inflammation, as demonstrated by the increase in CD45+ cells and eosinophils (Fig. 2E, F). Furthermore, levels of IL-5 and IL-13 were significantly elevated in SIRPα KO mice compared to their WT counterparts (Fig. 2G, H). Histological analysis of lung tissue (Fig. 2I) supported these results, showing that IL-33 challenges significantly increased epithelial thickness (Fig. 2J) and inflammatory cell count (Fig. 2K) in SIRPα KO mice compared to WT mice. To address potential confounding effects that may arise from SIRPα knockout on the lung microenvironment, we evaluated ILC2-induced airway inflammation in alymphoid mice. We transferred pure populations of ILC2s that were sorted from both WT and SIRPα KO mice to Rag2−/− GC−/− mice (Fig. 2L). After three days of IL-33 intranasal administration, mice were given either SIRPα KO ILC2s or WT ILC2s. On the fourth day, mice receiving SIRPα KO ILC2s showed significantly higher lung resistance and exacerbated dynamic compliance compared to those receiving WT ILC2s (Fig. 2M, N). The number of ILC2s in mice receiving SIRPα KO ILC2s was significantly increased compared to those receiving WT ILC2s (Fig. 2O). Transferring SIRPα KO ILC2s significantly intensified lung inflammation, as demonstrated by the increase in CD45+ cells and eosinophils (Fig. 2P, Q). Additionally, levels of IL-5 and IL-13 were significantly elevated in the transferred SIRPα KO ILC2s mice compared to the transferred WT ILC2s mice (Fig. 2R, S). Histological analysis of lung tissue (Fig. 2T) supported the results, indicating that IL-33 challenges significantly increased epithelial thickness (Fig. 2U) and inflammatory cell count (Fig. 2V) in mice receiving SIRPα KO ILC2s compared to those receiving WT ILC2s.
Fig. 2
SIRPα deficiency aggravates AHR and lung inflammation. A–K Cohorts of WT and SIRPα KO mice were intranasally exposed to 0.5 µg of rmIL-33 or PBS for 3 days. On day 4, lung function, pulmonary ILC2s, BAL cellularity and cytokine levels, as well as histology were analyzed. B, C Lung resistance (B) and dynamic compliance (C) in response to elevating doses of methacholine are displayed; n = 5. D–F The total number of ILC2s per lung (D), total number of CD45+ cells (E) and CD45+, Gr-1-, CD11c-, SiglecF+ eosinophils (F) in BAL fluid are demonstrated in bar graphs; n = 5. G, H Levels of IL-5 (G) and IL-13 (H) in the BAL fluid were measured by LEGENDPLEX and are shown in bar graphs; n = 5. I Lung histologic sections stained with hematoxylin and eosin (H&E) are displayed; scale bars=50 µm. J, K Quantification of airway epithelium thickness (J) and infiltrating cells (K); n = 3. L–V Cohorts of Rag−/−GC−/− mice were intravenously injected with 4 × 10⁵ activated ILC2s isolated from either WT or SIRPα KO mice. Recipient mice were received 1.0 µg rmIL-33 or PBS intranasally for 4 days. On day 5, lung function, pulmonary ILC2s, BAL cellularity and cytokine levels, as well as histology were analyzed. M, N Lung resistance (M) and dynamic compliance (N) in response to elevating doses of methacholine are depicted; n = 5. O–S The total number of ILC2s per lung (O), total number of CD45+ cells (P) and CD45+, Gr-1-, CD11c-, SiglecF+ eosinophils (Q) in BAL fluid are demonstrated in bar graphs; n = 5. R, S Levels of IL-5 (R) and IL-13 (S) in the BAL fluid are shown in bar graphs; n = 5. T Lung histologic sections stained with hematoxylin and eosin (H&E) are presented; scale bars=50 µm. U, V Quantification of airway epithelium thickness (U) and infiltrating cells (V); n = 3. Data are presented as means ± SEM and are representative of at least 2 independent experiments. Two-tailed student’s t-test or one-way ANOVA followed by Tukey post-hoc tests were employed for statistical analysis; *< 0.05, **< 0.01, ***< 0.001, and ****< 0.0001. Schematic images are sourced by an open access license from Servier Medical Art
These findings highlight the crucial role of SIRPα in modulating ILC2-induced AHR and lung inflammation.
SIRPα regulates acute and chronic allergen-induced AHRTo further confirm that SIRPα deficiency exacerbates AHR, we employed a clinically relevant pulmonary inflammatory disease model using Alternaria alternata (A. alternata), a common fungus associated with allergic disease. WT and SIRPα KO mice were exposed to 100 µg of A. alternata or PBS i.n. over days 1–4. On day 5, we analyzed lung function, pulmonary ILC2 number, BAL-infiltrating cell count, and histology (Fig. 3A). Consistent with our previous findings, the lung resistance of SIRPα KO mice was significantly higher, and their dynamic compliance was considerably improved compared to WT mice (Fig. 3B, C). Additionally, SIRPα KO mice showed a substantial increase in the total number of pulmonary ILC2s (Fig. 3D). Furthermore, the numbers of CD45+ cells and eosinophils in BAL samples of SIRPα KO mice were significantly higher than those in WT mice (Fig. 3E, F). The levels of IL-5 and IL-13 in the BAL fluid significantly increased in SIRPα KO mice (Fig. 3G, H). Histological analysis of the lungs showed that the thickness of the epithelium and inflammatory cell recruitment considerably increased in SIRPα KO mice (Fig. 3I–K). Furthermore, we established a chronic mouse model of AHR with A. alternata in WT and SIRPα KO mice (Fig. 3L). The study demonstrated that deficiency in SIRPα significantly worsened AHR, increased ILC2 counts in the lungs, and raised CD45+ cell and eosinophil count in BAL fluid. Additionally, levels of IL-5 and IL-13 in BAL were significantly higher in SIRPα KO mice compared to WT counterparts (Fig. 3L–V). This thorough analysis suggests that SIRPα plays a pivotal role in improving both acute and chronic allergen-induced AHR.
Fig. 3
SIRPα deficiency exacerbates A. alternata-induced AHR in acute and chronic models. A–L WT and SIRPα KO mice were intranasally received 100 µg of A. alternata on days 1–4. On day 5, AHR and lung inflammation were assessed. B, C Lung resistance (B) and dynamic compliance (C) in response to elevating doses of methacholine are displayed; n = 5. D–G The total number of ILC2s per lung (D), total number of CD45+ cells (E) and eosinophils (F) in BAL fluid are demonstrated in bar graphs; n = 5. G, H Levels of IL-5 (G) and IL-13 (H) in the BAL fluid were measured by LEGENDPLEX and shown in bar graphs; n = 5. I Lung histologic sections stained with hematoxylin and eosin (H&E) are illustrated; scale bars=50 µm. J, K Quantification of airway epithelium thickness (J) and infiltrating cells (K); n = 3. L A cohort of WT and SIRPα KO mice were challenged intranasally with Alternaria alternata (A. alternata) or PBS for first three days. They were then challenged on day 7, 11, 14, 18, 21, and 25. M, N Lung resistance (M) and dynamic compliance (N) in response to elevating doses of methacholine; n = 5. O–Q Total number of ILC2s per lung (O), and total number of CD45+ cells (P) and eosinophils (Q) in BAL fluid have been demonstrated in bar graphs; n = 5. R, S Levels of IL-5 (R) and IL-13 (S) in the BAL fluid; n = 5. T Lung histologic sections stained with hematoxylin and eosin (H&E) are presented; scale bars=50 µm. U, V Quantification of airway epithelium thickness (U) and infiltrating cells (V); n = 3. Data are presented as means ± SEMs and are representative of at least 2 independent experiments. Two-tailed student’s t-test or one-way ANOVA followed by Tukey post-hoc tests; *p < 0.05, **p < 0.01, and ***p < 0.001. Schematic images are sourced by an open-access license from Servier Medical Art
SIRPα modulates ILC2 mitochondrial respiration by suppressing the NF-κB pathwayIn recent years, a growing body of evidence has implicated mitochondrial respiration in influencing the cytokine secretion capacity of ILC2s [27, 28]. To unravel the metabolic changes associated with SIRPα deficiency in ILC2s, we isolated pulmonary ILC2s from mice subjected to intranasal IL-33 challenges for 3 days. Subsequently, RNA sequencing (RNAseq) was performed on ILC2s following an 18 h culture with rmIL-2 and rmIL-7 (Fig. 4A). We observed 4696 differentially expressed genes (DEGs) induced by SIRPα deficiency. Notably, the lack of SIRPα resulted in the upregulation of genes encoding TH2 cytokines, such as Il6, Il5, and Il13 concomitant with the downregulation of Klf2 (Fig. 4B). To validate the association between SIRPα signaling and these pathways, Ingenuity Pathways Analysis (IPA) was employed, demonstrating upregulation of the IL-33 signaling, JAK/STAT signaling, TCA cycle and respiratory electron transfer, and ERK/MAPK signaling pathways along with the downregulation of apoptosis signaling pathway in SIRPα KO ILC2s (Fig. 4C). Furthermore, SIRPα deficiency upregulated genes related to the key molecules in the mitogen-activated protein kinase (MAPK) pathway (Mapk14) and Janus kinase/signal transducer and activator of transcription (JAK/STAT) pathway (Jak1, Stat3) (Fig. 4D). Literature reviews have identified the JAK/STAT and ERK/MAPK pathways as regulators of NF-κB [24, 29,30,31,32]. KLF2 has also been identified as an inhibitor of NF-κB [33, 34]. Additionally, NF-κB has been reported to regulate mitochondrial energy production [29]. Based on the results obtained in the IPA, a mechanism to control NF-κB is hypothesized, as shown in Fig. 4E. The expression levels of each protein were examined. To confirm the transcriptomics results, we examined the expression of crucial proteins involved in aforementioned signaling pathways within activated lung ILC2s from WT and SIRPα KO mice (Fig. 4F). Our findings indicate that SIRPα deficiency in ILC2s resulted in a significant increase in phosphorylated STAT3 (pSTAT3), p38, and p65, as well as a decrease in KLF2 (Fig. 4G–J). At the metabolic level, our transcriptomic analysis revealed that loss of SIRPα in ILC2s induced an overall upregulation of OXPHOS and mitochondrial respiratory gene signatures (Fig. 4K). In particular, TCA cycle enzymes citrate synthase (Cs), aconitase (Aco1, Aco2), isocitrate dehydrogenase (Idh1, Idh3a, Idh3b), oxoglutarate dehydrogenase (Ogdh), succinate-CoA ligase GDP-forming subunit beta (Suclg2), succinate dehydrogenase (Sdha) and fumarate hydratase (Fh1) were all increased in ILC2s lacking SIRPα. To confirm our transcriptomic results, we measured the impact of SIRPα on mitochondrial respiration in ILC2s by measuring live oxidative metabolism (Fig. 4L). Although basal respiration remained consistent between WT and SIRPα KO ILC2s, loss of SIRPα significantly elevated spare respiratory capacity and ATP production rates (Fig. 4M–O). Additionally, we observed higher mitochondrial activation in SIRPα KO ILC2s compared to the control group, as measured by Mito tracker green expression (Fig. 4P). To investigate the causal relationship between the SIRPα-CD47 axis and mitochondrial function in the regulation of ILC2 activity, we administered the mitochondrial complex I inhibitor BAY 87-2243 to ILC2s isolated from SIRPα KO and examined the impact on cytokine production capacity and ILC2 activation [35, 36]. The absence of cytotoxic effects of BAY 87-2243 was confirmed using annexin-V/DAPI staining (Fig. S3A). The results demonstrated that ILC2s treated with BAY87-2243 exhibit a markedly diminished expression of GATA-3, a marker of ILC2 activation, and Ki67, a marker of cellular proliferation, in comparison to the vehicle group (Fig. S3B and S3C). Additionally, the secretion levels of IL-5 and IL-13 in the culture supernatant were decreased compared to the vehicle group (Fig. S3D and S3E). Collectively, these findings suggest that SIRPα exerts control over cytokine production and cell proliferative capacity in ILC2 cells by regulating mitochondrial oxidative energy production.
Fig. 4
SIRPα modulates ILC2 mitochondrial respiration via NF-κB pathways. A–P Cohorts of WT and SIRPα KO mice were intranasally challenged with rmIL-33 over 3 consecutive days. On day 4, lung ILC2s were isolated and cultured with rmIL-2 and rmIL-7 for 24 h. B Total RNA was extracted to perform a bulk transcriptomic analysis. Volcano plots represent differentially expressed genes. C Gene set enrichment analysis by Ingenuity Pathway Analysis (IPA) depicting critical pathways regulated in SIRPα-deficient ILC2s. D Dot plot representation of selected critical genes involved in ILC2 related genes, MAPK, and JAK/STAT pathways. Dot size is indicative of the total gene expression level. E Overview of downstream SIRPα signaling elements. F–I Cohorts of WT and SIRPα KO mice were challenged intranasally for 3 days with rmIL-33. On day 4, lung ILC2s were isolated and cultured with rmIL-2, rmIL-7 for 24 h. Representative histogram of protein expression of pSTAT3 (G), p38 (H), KLF2 (I), and p65 (J). Corresponding quantitation is presented as MFI; n = 4. Corresponding quantitation is presented for each protein as MFI; n = 4. K Dot plot representation of selected critical genes involved in OXPHOS and Mitochondrial respiratory pathways. Dot size is indicative of the total gene expression level. L–O Mitochondrial respiratory profile showing oxygen consumption rates (OCR) in response to sequential injections of Oligomycin (ATP synthase inhibitor), BAM15 (mitochondrial uncoupler), and Rotenone + antimycin A (complex I and II inhibitors). Key parameters of mitochondrial function, including basal respiration (M), spare respiratory capacity (N), and ATP production rate (O) are presented; n = 3. P Mitochondrial sizes were assessed using Mito Tracker green and are shown in plot graphs. Data are presented as mean +/− SEM and are representative of at least 2 experiments. Two-tailed student’s t-test was employed for statistical analysis; *< 0.05, **< 0.01, ***< 0.001, and ns= non-significant. Schematic images are sourced by an open-access license from Servier Medical Art
CD47 is upregulated in activated ILC2s and plays a crucial role in limiting cellular effector functionTo further explore the role of CD47-SIRPα axis in ILC2s, we examined its expression in naïve and activated ILC2s. Pure populations of naive lung ILC2s were FACS sorted and cultured ex vivo for 24, 48, and 72 h in the presence of IL-33. Expression of CD47 gradually increased over time with IL-33 activation, reaching peak levels 72 h post-activation (Fig. 5A). To validate this result in vivo, we assessed the expression of CD47 proteins on ILC2s in a mouse model of IL33-mediated airway inflammation. Cohorts of wild-type mice were intranasally treated with IL-33 or PBS for three consecutive days. Flow cytometry analysis on the fourth day revealed a significant upregulation of CD47 on ILC2s in response to IL-33 (Fig. 5B). To investigate the role of CD47 in ILC2s, we utilized WT mice and CD47 knockout (CD47 KO) mice. Intranasal administrations of IL-33 into WT and CD47 KO mice for three consecutive days were followed by sorting and ex vivo culture of pure populations of lung ILC2s (Fig. 5C). Notably, in the absence of CD47, ILC2s exhibited significantly increased expression of the activation marker GATA-3 and the proliferation marker Ki67 (Fig. 5D, E). Additionally, the secretion levels of IL-5 and IL-13 in the culture supernatant were elevated in CD47 KO mice compared to WT counterparts (Fig. 5F, G). Furthermore, the cytokine production capacity per cell was examined by flow cytometry with intracellular staining of IL-5 and IL-13. The percentage of IL-5+IL-13+ was significantly increased in ILC2s of CD47 KO compared to ILC2s of WT (Fig. S3F). These results suggest that the loss of the CD47 results in enhanced activation of ILC2s, elevating cytokine secretion and cell proliferation. To elucidate the impact of CD47 deficiency on AHR and lung inflammation, we examined AHR indices in CD47 KO mice. Both WT and CD47 KO mice underwent intranasal administration of IL-33 (0.5 μg) or PBS for 3 consecutive days (Fig. 5H). On day 4, we directly measured lung resistance and dynamic compliance, as well as flow cytometry analyses on BAL and lung samples. Similar to SIRPα KO mice, the pulmonary resistance was significantly lower in WT mice compared to CD47 KO mice (Fig. 5I, J). The number of ILC2s in CD47 KO mice significantly increased compared to WT mice (Fig. 5K). The lack of CD47 expression resulted in a significant exacerbation of lung inflammation, as indicated by increased CD45+ cells and eosinophils (Fig. 5L, M). Additionally, elevated levels of IL-5 and IL-13 were observed in CD47 KO mice compared to WT mice (Fig. 5N, O). Histological analysis of the lungs (Fig. 5P) corroborated these findings, demonstrating that IL-33-induced thickening of the epithelium (Fig. 5Q) and increase in inflammatory cell count (Fig. 5R) were more pronounced in CD47 KO mice compared to WT mice. These results suggest that CD47, the sole ligand for SIRPα, is expressed on ILC2s and is crucial for limiting their function.
Fig. 5
Lack of CD47 increases ILC2 function and aggravates AHR. A Pulmonary nILC2s from C57BL/6 WT mice were sorted using FACS and cultured (50 × 104/ml) ex vivo in the presence of rmIL-2 (10 ng/ml), rmIL-7 (10 ng/ml), and rmIL-33 (50 ng/ml) for the indicated durations at 37 °C. Flow cytometry analysis assessed CD47 expression over time. Representative plots depict CD47 protein expression levels at 0-, 24-, 48-, and 72 h post-culture. The gray plot represents Fluorescence-minus-one (FMO) control. Corresponding quantitation is presented as Mean Fluorescence Intensity (MFI); n = 3. B WT mice were intranasally challenged with rmIL-33 or PBS over 3 consecutive days. Lung ILC2s were isolated on day 4 and CD47 expression in ILC2s was analyzed. Representative plots of CD47 protein expression levels in PBS and IL-33 group. The gray plot is FMO. Quantification is shown as MFI; n = 4. C–G Activated ILC2s were sorted from WT and CD47 KO mice following three intranasal challenges with rm-IL-33 (0.5 μg/mouse). Sorted cells were incubated with rmIL-2 and rmIL-7 for 24 h. D, E Expression levels of GATA-3 (D) and Ki67 (E) in activated ILC2s are presented. Corresponding quantitation is presented as MFI; n = 4. F, G Levels of IL-5 (F) and IL-13 (G) production in the culture supernatant were measured; n = 4. H–R A cohort of WT and CD47 KO mice received were intranasally exposed to 0.5 µg of rmIL-33 or PBS for 3 days. On day 4, lung function, pulmonary ILC2s, BAL cellularity, and cytokine levels, as well as histology were analyzed. I, J Lung resistance (I) and dynamic compliance (J) in response to elevating doses of methacholine; n = 5. K–M Total number of ILC2s per lung (K) as well as total number of CD45+ cells (L) and eosinophils (M) in BAL fluid have been demonstrated in bar graphs; n = 5. N, O Levels of IL-5 (N) and IL-13 (O) in the BAL fluid were measured by Legendplex and shown in bar graphs; n = 5. P Lung histologic sections stained with hematoxylin and eosin (H&E); scale bars=50 µm. Q, R Quantification of airway epithelium thickness (Q) and infiltrating cells (R); n = 3. Data are presented as means ± SEM and are representative of at least 2 independent experiments. Statistical analysis was performed using two-tailed Student’s t-test; *< 0.05, **< 0.01, ***< 0.001, and ****< 0.0001. Schematic images are sourced by an open access license from Servier Medical Art
Endogenous and exogenous CD47 regulate ILC2 function via activation of SIRPα pathwayTo investigate a therapeutic approach of targeting SIRPα-CD47 pathway, we questioned whether endogenous CD47 on ILC2s can downregulate ILC2 function by binding to SIRPα on ILC2. CD47 KO (CD45.2) and WT (CD45.1) mice were intranasally treated with IL-33 for three consecutive days, and pulmonary ILC2s were isolated on the fourth day. Two groups were formed: one consisting solely of ILC2s from only CD47 KO mice (monoculture), and another group consisting of ILC2 from both CD47 KO (CD45.2) and WT (CD45.1) mice, which were co-cultured in a 1:1 ratio (co-culture group) and incubated for 24 h. The function of CD47 KO-derived ILC2 in each group was evaluated by FACS (Fig. 6A and S3G). The expression of the ILC2 activation marker GATA-3 and the proliferation marker Ki67 significantly decreased in the group of co-culturing WT and CD47 KO ILC2s compared to CD47 KO monoculture ILC2s (Fig. 6B, C). Additionally, the percentage of ILC2s positive for both IL-5 and IL-13 was reduced in the co-culture group compared to the monoculture group (Fig. 6D).
Fig. 6
CD47 administration controls ILC2 function via activating SIRPα signaling. A)WT (CD45.1) and CD47 KO (CD45.2) mice were intranasally exposed to 0.5 μg rmIL-33 for three days, and lung ILC2s were isolated on day four. Two groups were formed: one consisting ILC2s from only CD47 KO mice (monoculture group), and another consisting of ILC2s from both CD47 KO (CD45.2) and WT (CD45.1) mice, which were co-cultured in a 1:1 ratio (co-culture group) and incubated for 24 h. The function of CD47 KO-derived ILC2 in each group was then evaluated by FACS. B, C Expression levels of GATA-3 (B) and Ki67 (C) in activated ILC2s are presented. Corresponding quantitation is presented as MFI; n = 4. D Frequency (%) of IL-5+ and IL-13+ ILC2s in both monoculture and co-culture groups; n = 4. E–I WT mice received intranasal doses of rmIL-33 over 3 consecutive days. Activated ILC2s were sorted and cultured with rmIL-2 (10 ng/ml) and rmIL-7 (10 ng/ml) in the presence of either vehicle or CD47-Fc (20 μg/mL) for 24 h. F, G GATA-3 (F) and Ki67 (G) expression levels in activated ILC2s are shown. Corresponding quantitation is presented as MFI; n = 4. H, I Levels of IL-5 (H) and IL-13 (I) production in the culture supernatant were measured by LEGENDPLEX and are shown in bar graphs; n = 4. J WT mice were treated with rmIL-33 by intranasal injection for three days in a row. Activated ILC2 cells were sorted and cultured with rmIL-2 (10 ng/ml) and rmIL-7 (10 ng/ml). The following day, vehicle or CD47-Fc (20 μg/mL) was added to the culture wells and analyzed by FACS after one hour. K Overview of downstream SIRPα signaling elements. L–O Representative histogram of protein expression of pSTAT3 (L), p38 (M), KLF2 (N), and p65 (O). Corresponding quantitation is presented for each protein as MFI; n = 4. Data are presented as means ± SEM and are representative of at least 2 independent experiments. Two-tailed student’s t-test or one-way ANOVA followed by Tukey post-hoc tests were employed for statistical analysis; *< 0.05, **< 0.01, ***< 0.001, and ****< 0.0001. Schematic images are sourced by an open access license from Servier Medical Art
To explore the potential of exogenous CD47 to further limit the ILC2 function, we designed a set of experiments using CD47-Fc protein. WT mice were treated with IL-33 (i.n.) for three consecutive days. On the fourth day, lung ILC2s were isolated and cultured in the presence of rmIL-2, rmIL-7, and either vehicle or CD47-Fc for 24 h (Fig. 6E). The absence of cytotoxic effects of CD47-Fc was confirmed using annexin-V/DAPI staining (Fig. S
留言 (0)