Materials
TiO2NPs (anatase, nanopowder, < 100 nm particle size), trisodium citrate, HEPES, prostaglandin E1 (PGE1), glutaraldehyde, EDTA, EGTA, ferric chloride, urethane, clopidogrel, and bovine serum albumin were obtained from Sigma-Aldrich (St. Louis, MO, USA). Thrombin and collagen were obtained from Calbiochem (San Diego, CA, USA) and Chrono-log (Havertown, PA, USA), respectively. Fluorescein isothiocyanate (FITC)-labeled anti-CD62P antibody (anti-CD62P-FITC Ab), FITC-labeled PAC-1 (PAC-1-FITC), and FITC-labeled annexin V (annexin V-FITC) were from BD Biosciences (San Jose, CA, USA). Fluo-4 acetoxymethyl ester (Fluo-4 AM) was obtained from Invitrogen (Carlsbad, CA, USA).
Blood collection and preparation of human platelets (hPLTs)
This work was supported by the Ethics Committee of the Health Service Center at Seoul National University with the approval from the Institutional Review Board of Seoul National University (IRB No. 1702/003–004, 5, March, 2019). To simplify our study design, we selected only healthy male donors aged 20–30 years, excluding risk factors for thrombosis such as gender, age, and disease, and taking any medication in the past 2 weeks. For platelet-rich-plasma (PRP) preparation, whole blood with 3.2% trisodium citrate was centrifuged at 150 × g for 15 min and platelet cell count in PRP was adjusted 3 × 10⁸ cells/mL by diluting with platelet-poor-plasma (PPP) on the day of experiments.
Characterization of TiO
2NPs
TiO2NPs were not surface treated and insoluble in water, hydrochloric acid, or nitric acid. The particles were dispersed in distilled water and sonication was performed before each experiment, using an ultrasonicator with a maximum output of 150–200 W for 15 s to prevent agglomeration. TiO2NPs were dried and observed with scanning electron microscope (SEM) (SU8010, Hitachi Limited, Japan) to examine the size distribution. Detailed statistical analysis (Nano measure 1.2 and OraginPro2021) of TiO2NPs were performed by random measurement of 100 nanoparticles in the images taken by SEM. The dynamic particle size of the nanoparticles was evaluated using a Malvern laser particle size analyzer (DLS-7000, Otsuka Electronics, Co., Osaka, Japan). The sample was weighed and dispersed in deionized water (0.1% mass fraction), sonicated for 3 min, adjusted to pH 7.4 with NaOH or HCl. The zeta potential was measured with a nanoparticle size analyzer (ZS-90, Malvern Instruments, UK). All data were repeated three times and averaged. Technical support was provided by Beijing Standard Spectrum Testing Technology Co.
Observation of cellular uptake of TiO2NPs under transmission electron microscope (TEM)
Cellular uptake of TiO2NPs by PLTs was observed using TEM following these procedures. After incubating isolated PLTs for 24 h with distilled water (as a control) and 25 µg/mL of TiO2NPs dispersed in distilled water as a colloidal suspension, cell fixation was carried out using a 2% glutaraldehyde solution in the refrigerator for 1 h, followed by post-fixation using 1% osmium tetroxide for 2 h. Subsequently, en-bloc staining was done with 0.5% uranyl acetate for 30 min, followed by serial dehydration steps with 30, 50, 70, 80, 90% ethanol (1 time each) and 100% ethanol (3 times). Transition and infiltration were then gradually performed using propylene oxide (10 min, twice), once with propylene oxide and Spurr's resin (1:1) for 2 h, and finally with Spurr's resin in a desiccator overnight. The next day, infiltration was completed with fresh Spurr's resin for 2 h in the desiccator, and samples were then kept in a 70 °C oven overnight for polymerization. Finally, samples were examined under TEM (JEOL, JEM 1010).
Measurement of PLT aggregation
After incubation with TiO2NPs (0.5, 1, 5, 10, 25, and 100 μg/ml; 5 min, 30 min, and 60 min) at 37 °C, the number of individual PLTs per microliter was calculated using optical microscopy and the degree of PLT aggregation was assessed based on the count of single cells. Data were presented as percentages of PLT aggregation. Besides, PLT aggregation induced by TiO2NP treatment under physiology-mimicking conditions was observed by the above method under stimulation with thrombin (0.6–0.8 U/ml), collagen (2–4 μg/ml). PLT suspension was exposed to a shear rate of 1500 s−1 for 10 min at 37 °C using a programmable cone-plate viscometer. The shear-stressed platelets were fixed with 0.5% glutaraldehyde in Tyrode's buffer (134 mM NaCl, 2.9 mM KCl, 1.0 mM MgCl2, 10.0 mM HEPES, 5.0 mM glucose, 12.0 mM NaHCO3, 0.34 mM Na2HPO4, and 0.3% bovine serum albumin, pH 7.4) to evaluate platelet aggregation. The number of single platelets per microliter was counted under a phase-contrast light microscope. Prior to counting, platelet suspensions were diluted to approximately 300 to 500 particles in 5/25 squares. The variations between two different fixed samples from the same platelet suspension were typically less than 3% from the mean. Optical observation and counting methods can effectively exclude the potential influence of nanomaterial agglutination on platelet aggregation, ensuring accurate results.
Evaluation of LDH leakage
Lactate dehydrogenase (LDH) leakage from PLT was measured by spectrophotometry. After incubation with TiO2NPs for 5 min, the supernatant obtained from the centrifuge reaction mixture was used for LDH determination (digitonin 50 μM treatment for 1 h was used as positive control). The degree of cell lysis was expressed as a percentage of total enzyme activity compared to control incubation with cleavage with digitonin.
Flow cytometry analysis
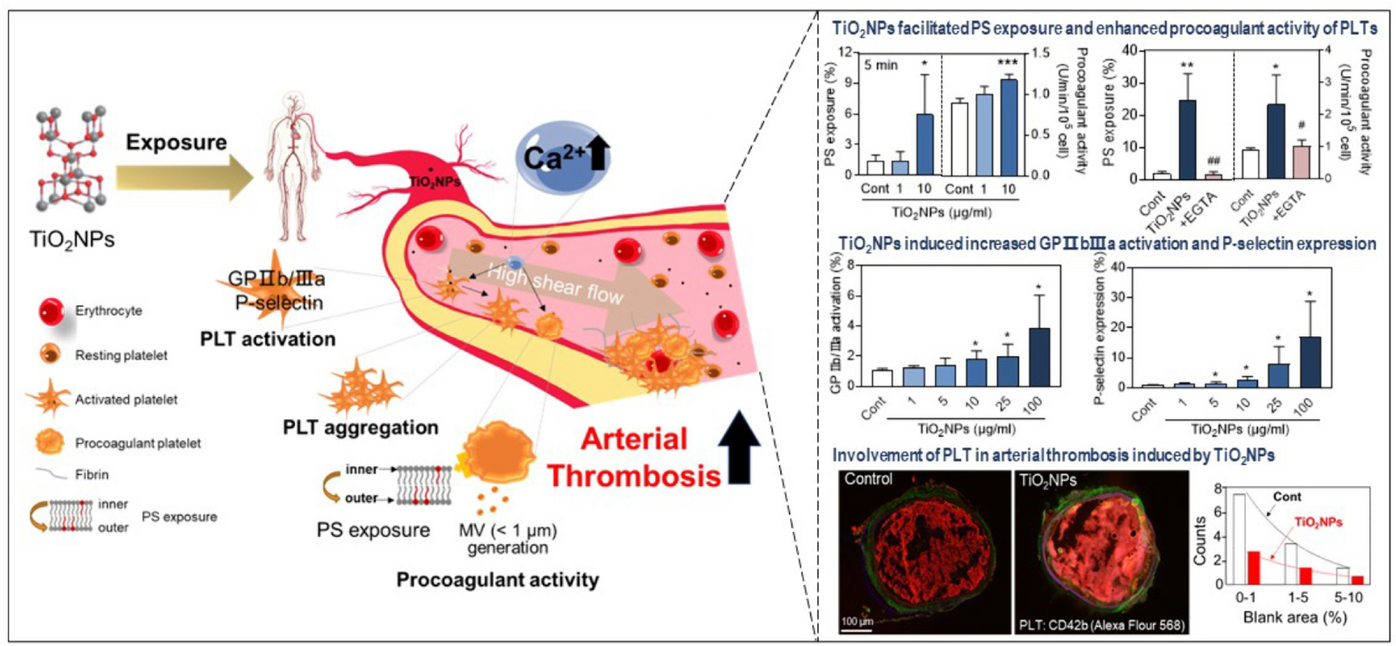
The PLTs were obtained by centrifugation as described above. After PLTs were exposed with TiO2NPs at 37 °C for 10 min, the level of P-selectin and the activation of glycoprotein GPIIb/IIIa were determined by staining with CD62P-FITC and PAC-1-FITC for 20 min, respectively. PS exposure and MV generation in PLTs were examined by staining with both annexin V-FITC and anti-CD42b-PE Ab (as PLT identifier). MVs are described as cells with a diameter of less than 1 µm. Therefore, the cell population of MVs was differentiated by flow cytometry SSC versus FSC, while MV production in PLTs was confirmed by the PLT surface marker CD42b. Intracellular calcium level was determined by pre-loading fluo-4/AM (5 µM) for 45 min. All the determinations were conducted using FACS Calibur (Becton Dickinson, USA), and Cell Quest Pro software was used to collect and analyze data from 10,000 events. When analyzing, draw the part of annexin V-FITC positive staining and CD42b positive staining in the FACS program, and then export the percentage. Upon analyzing, for example, the PS exposure on platelets, we identified the portion of annexin V-FITC positive staining and CD42b positive staining in the FACS program. Subsequently, we exported the corresponding percentage.
A prothrombinase assay
The prothrombinase assay was applied to assess procoagulant activity. Specifically, TiO2NP-treated PLTs were further induced into thrombin generation by adding 5 nM Xa factor, 10 nM Va factor and 2 μM prothrombin. Then, chromogenic substrate S2238 (Chromogenic, Milan, Italy) was used to measure the generated thrombin after adding a stop buffer (50 mM Tris–HCl, 120 mM NaCl, 2 mM EDTA, pH 7.9). Calculation of thrombin production rate was based on the absorbance change at 405 nm from the calibration curve.
Animals
The experimental C57BL/6 J mice (male, 12 weeks old) were kept in a clean environment without specific pathogens and fed with SPF chow diet and distilled water. The indoor temperature was controlled at 23 ± 1 ℃, the humidity was 55–70%, and the circadian rhythm was alternated (12 h/12 h). Mice were randomly divided into two groups: control group and exposed group (TiO2NPs, 25 mg/kg, intravenous injection). Mice were anesthetized using 3–5% isoflurane by inhalation, and blood samples and other relevant indicators were collected from the mice under anesthesia with a mercy endpoint. All animal experiments were reviewed and approved by the Animal Ethics Committee of China Medical University (CMU20231000). For this specific experiment, we strictly adhered to the triple-blind methodology, ensuring that neither the experimental observer, the research subject, nor the data analyst was aware of the experimental specifics until the official release of the analysis results. Furthermore, taking into account the blinding techniques employed in animal studies, mice were subsequently randomized and assigned to either the control or exposure groups (TiO2NPs, 25 mg/kg, intravenous administration).
Ex vivo assessment using blood cell analyzer
Blood (30 μl) was collected from mice tail with EDTA-K2 -containing tube 1 h post TiO2NP injection. Then fresh blood samples were tested by an automated five-classification animal blood cell analyzer (IDEXX ProCyte Dx, Japan) for the following indicators: PLT count (performed by both impedance (PLT-I) and optical (PLT-O) method), percentage of PLT-larger cell ratio (L-PCR%), PLT crit (PLT%), mean PLT volume (MPV), mean PLT volume/PLT count (MPV/P), PLT distribution width (PDW), red blood cell count, percentage of hematocrit, hemoglobin, and white blood cell-related indexes.
Ex vivo measurement of mPLT aggregation was conducted by an animal blood cell analyzer with impedance method, which only allows one single cell go through. The PLT aggregation rate was calculated by the formula: (PLTCont-PLTTiO2NPs)/PLTCont × 100)%.
Arterial thrombosis in mice
Arterial thrombosis mouse model: The left common carotid artery was isolated from the left side of the trachea using 3 × 5 mm tin foil to isolate the surrounding tissues. Afterwards, 1 × 2 mm filter paper was fully submerged with 5% FeCl3 and applied to the left common carotid artery for 15 min.
Ultrasound observation: The blood flow signal by the Doppler ultrasound in the mouse model was slightly adjusted based on previous study(Jing et al. 2023; Wang and Xu 2005). Mice were anesthetized with isoflurane inhalation at 3% and maintained at 2% throughout the procedure and then cleaned of hair on the neck and chest to facilitate ultrasound. AVINNO6 LAB small animal Doppler ultrasound system (VINNO Co., China) was used. The left common carotid artery was imaged and the flow signals (including velocity, flow volume, internal diameter, perfusion index, heart rate) were quantified.
Thrombuspathological experiment
The tissue of the common carotid artery was collected for the pathological experiment. The thrombus tissue was embedded using the frozen section embedding agent Sakura OCT (a water-soluble mixture of polyethylene glycol and polyvinyl alcohol), sectioned at 6 μm thickness with frozen sectioning machine (CM 1950, LEICA, Germany), and collected using adhesive slides to observe thrombus morphology under a general light microscope. By measuring the percentage of each blank area in the thrombus (the area that blood flow can pass through), it is artificially divided into the following groups: 0–1, 1–5, and 5–10% of the total area. Less blank area means more compact thrombus.
Immunofluorescence observations for frozen sections were examined by adding α-fibronogen with Alexa Fluor® 488 and CD42b with Alexa Fluor® 568, respectively. Then, the samples were sealed with a blocking buffer containing a liquid with an anti-fluorescent cracking agent.
Statistical analysis
All data are presented as the mean and standard deviation. Data were subjected to Student's t-test or two-way ANOVA followed by Duncan's multiple range test. In all cases, a P value < 0.05 was considered statistically significant. The asterisk represents significant differences from the control group (***P < 0.001; **P < 0.01; *P < 0.05). The pound represents significant differences from the TiO2NP treatment group (###P < 0.001; ##P < 0.01; #P < 0.05).


留言 (0)