
記住我


Prior to the experiment, 144 male C57BL/6 mice (213, Vital River, Beijing, China) were accommodated in facilities adhering to specific pathogen-free (SPF) animal facilities with consistent humidity levels of 45%-50% and temperatures ranging from 25–27 °C for one week. Mice underwent exposure to a light–dark cycle lasting 12 h each day to facilitate adaptation to the experimental conditions. Animal experimental procedures conducted in our institute have received approval from the Animal Ethics Committee.
Traumatic brain injury (TBI) results from the controlled cortical impact (CCI) on the brain's right hemisphere. Mice were anesthetized throughout the surgical procedure using the isoflurane vaporizer (901809, VetEquip, Inc., Livermore, CA) with a concentration of 2–2.5% isoflurane (PHR2874, Sigma-Aldrich, USA). The depth of anesthesia was monitored using the toe pinch reflex. Secure the mouse's head in a stereotactic frame and perform a midline incision, approximately 1 cm long, along the head to expose the skull. Preparation is needed for a right frontal craniotomy, with a planned center point of 0.5 mm anterior to the anterior fontanelle and 2.0 mm lateral. The diameter of the craniotomy should be 3.5 mm to adequately expose the dura mater and cerebral cortex. Cortical contusion injury (CCI) was induced using the PinPoint™ Precision Cortical Impactor (PCI3000-1, Hatteras Instruments Inc., USA). A tip with a 3 mm impact diameter applied vertical force to the brain's surface. The velocity upon impact is 3 m per second, with an impact span lasting 150 ms, and a penetration depth of 2 mm. Following a TBI, it is essential to promptly replace and secure the bone flap and subsequently suture the scalp. All aspects of the animals in the sham group, including anesthesia, skin incision, and craniotomy surgery, followed the protocol, except for CCI. During the surgery, it is advised to employ a heating pad to ensure that the temperature of the mouse's rectum remains at 37 ± 0.5 °C (Zhao et al. 2022; Ignowski et al. 2018; Krukowski et al. 2021; Wu et al. 2021a).
Injection of lentiviruses and animal experiment groupingThe lentiviral expression systems were constructed by utilizing the lentiviral overexpression vector (LV4, GimaGen, Shanghai, China) and the lentiviral knockdown vector (pGLVU6/GFP, C06001, GimaGen, Shanghai, China). sh-Wtap (TRCN0000331380; target sequence: GGAAAGTACACAGATCTTAAT) and sh-NC(CTCGCTTGGGCGAGAGTAA) (Jin et al. 2017) The lentivirus was acquired from Sigma-Aldrich (USA) with a determined virus titer of 109 TU/mL.
One week prior to TBI surgery, 2 μL of sh-Wtap (silencing Wtap lentivirus), sh-NC (silencing lentivirus negative control), oe-Lcn2 (overexpressing Lcn2 lentivirus), and oe-NC (overexpressing lentivirus negative control) lentiviruses were administered through injection into the right lateral ventricle of mice using a stereotaxic apparatus (SR-5R, Narishige Scientific Instruments Laboratory, Japan) with a flow rate set at 0.5 µL/min for 10 min. At a distance of 0.2 mm from the bregma, 1.0 mm away from the midline, and 1.5 mm beneath the brain's surface, the insertion point was precisely situated (Wu et al. 2021b, 2020; Lu et al. 2020).
The mice were grouped as follows: (1) Sham group, TBI group; (2) Sham + sh-NC + oe-NC group, TBI + sh-NC + oe-NC group, TBI + sh-Wtap + oe-NC group, and TBI + sh-Wtap + oe-Lcn2 group. Each group comprised 24 mice, out of which 8 mice were dedicated to neurobehavioral testing and assessment. After 3 days post-TBI surgery, 16 mice were euthanized, with the brains of 8 mice being employed for measuring brain water content and the remaining 8 mice's cortical tissue being utilized for subsequent histopathology, gene analysis, and protein detection.
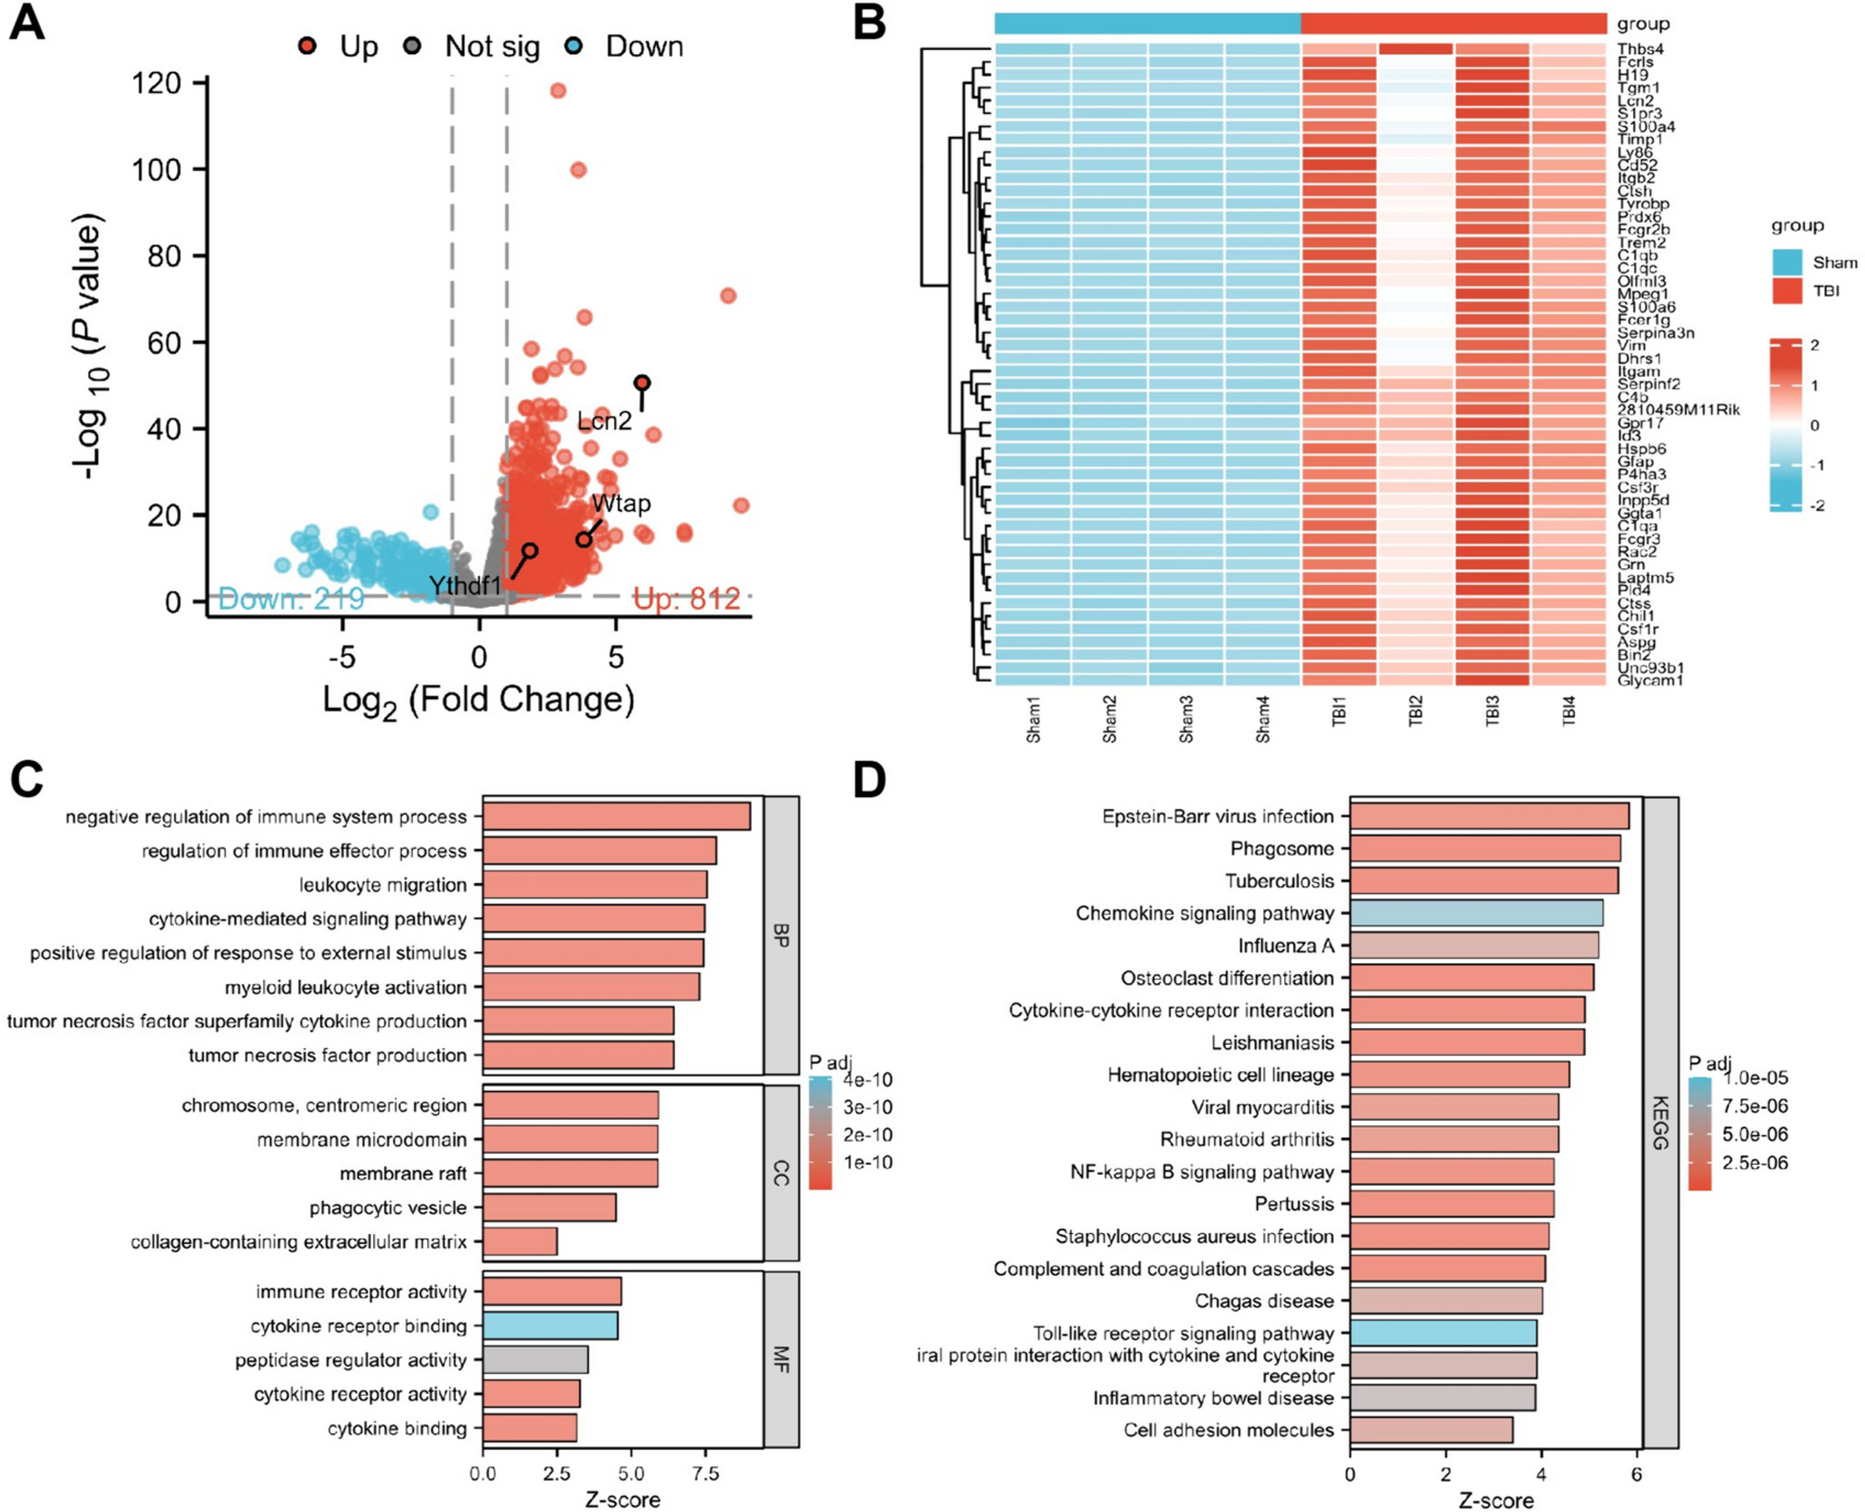
RNA retrieval and sequencing analysisIsolation of total RNA was carried out from the ipsilateral cerebral cortex sections of mice in the Sham and TBI cohorts (3 days after surgery) using Trizol reagent (15596026, Invitrogen, Thermo Fisher Scientific, Waltham, MA, USA), with 4 samples per group. RNA sample concentration and purity levels were assessed with a Nanodrop2000 spectrophotometer (1011U, Nanodrop, Thermo Fisher Scientific, Waltham, MA, USA). Total RNA samples meeting the following criteria based on denaturing agarose gel electrophoresis and Bioanalyzer 2100 analysis for RNA integrity are used for subsequent trials: RNA integrity index (RIN) must be equal to or greater than seven (7.0) with a ratio of 28S to 18S exceeding 1.5.
CapitalBio Technology, located in Beijing, China, produced and sequenced the library for sequencing. Each sample utilizes a sum of 5 μg RNA. In summary, the Ribo-Zero™ Magnetic Kit (MRZE706, Epicentre Technologies, Madison, Wisconsin, USA) is employed to eliminate ribosomal RNA (rRNA) from total RNA. The NEB Next Ultra RNA Library Prep Kit (#E7775, NEB, USA), provided by NEB, USA, was utilized for Illumina sequencing to establish a repository dedicated to genetic sequencing. Next, the RNA fragments are broken down into fragments of about 300 base pairs (bp) using NEB Next First Strand Synthesis Reaction Buffer (5 ×). For the synthesis of the initial cDNA strand, a combination of reverse transcriptase primers and random primers was utilized, followed by the generation of the complementary cDNA strand in a reaction buffer comprising dUTP Mix (10 ×). Repairing the cDNA fragment involves adding a poly(A) tail and ligating a sequencing adaptor. Upon the joining of the Illumina sequencing adapters, the second cDNA strand underwent digestion using the USER enzyme (#M5508, NEB, USA) to generate libraries with strand specificity. Following this, the library DNA needs to undergo amplification, purification, and enrichment via PCR. The library was then assessed utilizing an Agilent 2100 system and quantified with the KAPA Library Quantification Kit (KK4844, KAPA Biosystems). Finally, the NextSeqCN500 (Illumina) sequencer was used to perform paired-end sequencing (Regan et al. 2021; Bao et al. 2023).
Quality assessment of sequencing data and alignment with reference genomeThe evaluation of the quality of paired-end reads within the initial sequencing dataset was conducted using FastQC v0.11.8 software. The initial data underwent preprocessing via Cutadapt software version 1.18 to eliminate Illumina sequencing adapters and poly(A) terminal sequences. Eliminate reads with an N content surpassing 5% by employing a Perl script. Seventy percent of the total reads were retained after extracting those with a base quality score exceeding 20. It was done using version 0.0.13 of the FASTX Toolkit software. The paired-end sequences were corrected utilizing BBMap software. Afterwards, the screened and superior read fragments were mapped to the mouse reference genome employing hisat2 software (version 0.7.12) (Bao et al. 2023).
Bioinformatics analysisWe obtained the transcriptome sequencing dataset GSE167459 from the GEO database (http://www.ncbi.nlm.nih.gov/geo/). This dataset is composed of TBI-associated microglial and astrocytic cells. It consists of 5 samples from both sham and TBI groups for microglial cells and 5 samples from both sham and TBI groups for astrocytic cells. Differential expression analysis was conducted on the sequencing data and dataset GSE167459 utilizing the "edgeR" package in R language (version 4.2.1), based on mRNA read count. The criteria for differential gene selection were set as |logFC|> 1 and P.value < 0.05. The generation of volcano plots and boxplots for differentially expressed genes could be accomplished using the "ggplot2" package in R, while a heatmap of differential gene expression could be created using the "heatmap" package in R. After converting the obtained differentially expressed genes into ID format, we will perform enrichment analysis using the "clusterProfiler" package in R software. The z-score values for each enriched term will be calculated using the provided molecular values with the GOplot package. Finally, a bar plot depicting the enrichment analysis results will be created (Yu et al. 2012; Walter et al. 2015). The STRING database (https://string-db.org/) analyzes protein–protein interactions encoded by genes. It conducts network analysis on the top 20 genes that encode proteins with differences and measures their degree of centrality. Additionally, we performed further extraction and analysis of the expression statuses of factors associated with m6A modification from the transcriptome sequencing results. Subsequently, Spearman correlation analysis was performed on the highest-ranked genes by their centrality and the m6A regulators Wtap and Ythdf1. We utilized the SRAMP website to predict the m6A binding sites on the target gene Lcn2 RNA and generated a schematic diagram illustrating the secondary structure of the m6A site (Zhou et al. 2016).
Neuropsychological testing and assessmentTwo research personnel who were unaware of the experimental design assessed neurological deficits. The assessment included baseline, TBI, and sham surgery through a comprehensive modified neurological severity score (mNSS), the rotarod test, and the footprint analysis on days 1, 3, 7, and 14. Every behavior is tested using four experiments, repeated twice to ensure data verification.
The mNSS score could be used to assess several key aspects of motor function in mice, including muscle condition, abnormal movement, sensory function (vision, touch, proprioception), equilibrium, and reflex capabilities. Neurological function is assessed on a scale ranging from 0 to 18, where a rating of 0 signifies typical function while a rating of 18 denotes the utmost degree of dysfunction. Normal mice were assigned a score of 0 points. An mNSS score between 1 and 6 was classified as mild injury, while a score ranging from 7 to 12 was classified as moderate injury, and a score with a range of 13 to 18 was classified as severe injury (Xu et al. 2017; Chen et al. 2018).
Using the Rota-Rod treadmill (LE8205, Shenzhen Rewood Life Technology Co., Ltd), the Rotarod test is employed to assess motor coordination and limb strength. The testing process comprises six-speed change experiments. These experiments begin with an initial speed of 5 rpm for the first 10 s, followed by a gradual rise from 5 to 10 rpm over the subsequent 30 s. Finally, the speed linearly increases from 10 to 20 rpm between 40 and 90 s. The experiments initiate with an initial velocity of 5 rThe ultimate score is calculated according to the mean duration that the mice were able to sustain their equilibrium on the rod across the six trials (Wu et al. 2021a).
Foot fault test: Evaluating the functionality of motion. Place the mice on hexagonal grids of various dimensions. The mouse places its paws on the wire as it traverses the grid. While carrying a load with each step, the claws may land or slide between the metal wires. A foot fault has been documented. Determine the total count of steps the mouse takes to traverse the grid, considering the movement of each forelimb while also monitoring the overall number of errors in foot placement for every forelimb. Determine the ratio of forelimb mistakes to the overall steps (Wu et al. 2021a).
Morris water maze test (MWM)The MWM was carried out to measure mice's spatial cognitive and mnemonic capabilities on days 15–21 after TBI. The MWM pool comprises a stainless steel cylindrical structure measuring 122 cm in diameter and 51 cm in height. This structure also includes an underwater concealed platform with a diameter of 10 cm. The MWM device is filled with water at 22 ± 2 °C and colored white using non-toxic paint. The experiment comprises two sequential stages: the training phase, which spans from day 15 to day 20, and the spatial memory testing phase on day 21. Four latency tests are conducted daily during the training phase, each lasting 90 s. The mice (n = 8/group) distributed among the quadrants of the pool, starting from the first quadrant and ending at the fourth quadrant. The time a mouse locates the platform within a 90-s timeframe and remains on it for 5 s is documented as the escape latency period. If the mouse fails to locate the platform within 90 s, it is then directed to the platform and given a 15-s period to stay on it. The time taken for the mouse to escape is recorded as 90 s. In the testing phase, after removing the platform, the mice were then relocated to the quadrant positioned diagonally across from the platform, where they were given 90 s to search for its location. The video tracking system (EthoVision XT 13, Noldus Information Technology, Wageningen, Netherlands) was employed for recording and analyzing platform crossing time, escape latency, and swimming trajectory (Liu et al. 2023; Zhao et al. 2022).
Measurement of brain water contentBy the third day after TBI, the mice were humanely put down, and their brains were harvested without undergoing cardiac perfusion. The injured hemisphere tissue sample was dissected and measured using an electronic analytical scale to ascertain its wet weight. The dry weight was obtained by drying it at 100 °C for 48 h. The mathematical expression to determine brain water content is provided as follows: Brain water content (%) = (wet weight—dry weight) / wet weight × 100% (Chen et al. 2018).
Volume assessment of contusionTo quantify the extent of contusion located in the cortex on the same side three days after TBI, the sections that were stained underwent digitization and analysis through ImageJ software after being treated with cresyl violet. To calculate the volume, the area of the damage should be added together and multiplied by the interlayer distance (500 μm). The percentage loss in hemispherical organization could be calculated using the subsequent equation:
(Volume of the opposite hemisphere—Volume of the same hemisphere)/(Volume of the opposite hemisphere) × 100% (Wu et al. 2021a).
ELISAWeigh 0.1 g of cortical tissue from each group of mice and transfer it to 900 μL of saline solution. Subsequently, sonicate and centrifuge the mixture at 3000 g for 15 min to obtain a tissue homogenate. The total protein concentration in the tissue homogenate was measured using the BCA Protein Assay Kit (P0012S, Beyotime, Shanghai, China). Additionally, the cell culture medium and supernatant from primary cortical neurons were collected for each group. The levels of interleukin-1β (IL-1β; PI301, Beyotime, Shanghai, China), IL-6 (PI326, Beyotime, Shanghai, China), and tumor necrosis factor α (TNF-α; PT512, Beyotime, Shanghai, China) were measured in the tissue homogenate and cell culture supernatant following the instructions provided by the ELISA kits. Absorbance values were assessed at 450 nm using an enzyme-linked immunosorbent assay (ELISA) reader (Bio-Tek, Winooski, VT, USA). Analyze using Origin 9.5 software (Cui et al. 2018; Xu et al. 2017).
Immunofluorescent stainingThree days after TBI, the mice are anesthetized, and cardiac perfusion is conducted using 0.9% NaCl. Subsequently, the injured brain tissue is dissected. Subsequently, we will utilize a paraformaldehyde solution with a concentration of over 4% to fix the brain tissue. We will then transfer it to a temperature-controlled environment at 4 °C, where it will be immersed in a 25% glucose phosphate buffer to facilitate dehydration. Once dehydration is complete, the tissue will be carefully removed, and the surface moisture will be dried. Subsequently, a surgical knife will flatten the targeted tissue before placing it on a specimen tray. Subsequently, we will employ an OCT embedding medium to envelop the tissue and position the specimen tray on the freezing stage of the cryostat for prompt freezing and embedding. We could begin slicing once the OCT has turned white and hardened. Our process involves cutting continuous sagittal sections with an approximate thickness of 10 μm. Following sectioning, the slices will be rinsed with room temperature phosphate-buffered saline (PBS), with each rinse lasting 5 min. This rinsing process will be repeated a total of three times. Next, the tissue sections will undergo permeabilization and blocking with a solution of 1% donkey serum containing 0.3% Triton X-100 for one hour. Next, the brain tissue will be incubated overnight with a primary antibody at 4 °C. Following overnight incubation, the frozen sections will undergo a 1-h incubation at room temperature using the following secondary antibodies: goat anti-rabbit (Cy3 ®; 1:1000, ab6939, Abcam, UK), goat anti-mouse (Alexa Fluor® 488; 1:1000, ab150117, Abcam, UK), and goat anti-rat (Alexa Fluor® 488; 1:1000, ab150157, Abcam, UK). In the future, the slices will be washed using PBS and stained with DAPI. The detailed information for one of the antibodies is as follows: Rabbit anti-Iba-1 (1:200, ab178846, Abcam, UK) or Mouse anti-Iba-1 (1:100, ab283319, Abcam, UK), Mouse anti-GFAP (1:50, ab4648, Abcam, UK), Rabbit anti-C3 (1:100, ab97462, Abcam, UK), Rat anti-CD16/32 (1:200, ab25235, Abcam, UK), Rat anti-CD206 (1:100, MA5-16,871, Thermo Fisher Scientific, Waltham, MA, USA), Mouse anti-NeuN (1:100, ab104224, Abcam, UK), and Rabbit anti-Lcn2 (1:200, A2092, Abclonal, Wuhan, China) (Wang et al. 2021b; Chen et al. 2018).
We collected coronal slices ranging from -1.0 to -3.0 mm of the anterior fontanelle for immunofluorescence image analysis and quantification. We randomly selected five non-adjacent sections spaced 100 μm apart in each animal. Subsequently, we choose five regions of interest (ROIs) from these sections for further analysis. These regions of interest (ROIs) are approximately 200 μm adjacent to the boundary of brain lesions. ImageJ software is utilized to analyze the fluorescence intensity and determine the ratio of Iba-1 + , GFAP + C3 + , Iba-1 + CD16/32 + , Iba-1 + CD206 + , Iba-1 + Lcn2 + , GFAP + Lcn2 + , and NeuN + Lcn2 + cells (Wu et al. 2021a).
TUNEL staining detects neuronal apoptosis in tissuesTo better evaluate neuronal apoptosis in the traumatized cortical region, we utilized the immunofluorescent double staining technique to label terminal deoxynucleotidyl transferase dUTP nick-end labeling (TUNEL) and neuronal nuclear (NeuN). This allowed us to investigate the proximity of apoptotic cells to neurons in a given area. Immunostaining of frozen sections was conducted using a rabbit anti-NeuN antibody (1:100, ab190195, Abcam, UK) overnight at 4 °C. Subsequently, TUNEL staining was conducted through the in situ cell death detection kit from Beyotime (C1089, Shanghai, China). Finally, the slices were covered with DAPI (C1006, Beyotime, Shanghai, China). A confocal laser scanning microscope (CLSM; LSM 510 META, Carl Zeiss AG) was utilized to observe and quantify six arbitrary microscopic fields per section. Three sections were analyzed each individual animal. All counting is done in Braille. The findings are presented as the proportion of total neurons experiencing apoptosis, as determined through dual staining with NeuN and TUNEL/NeuN stained cells (Xu et al. 2017).
Quantification of RNA m6A methylationThe procurement of overall RNA from tissues and cells was executed with the application of TRIzol reagent as directed by the manufacturer. The global quantities of m6A RNA were observed and recorded using the EpiQuik m6A RNA Methylation Quantification Kit (ab185912, Abcam, UK). Apply 200 ng of purified PolyA + mRNA onto the assay well. Next, the total RNA was immobilized onto the strip wells using a high-affinity RNA solution. Antibodies for capturing and detecting m6A levels are included in the reagent kit. Measure the light absorption of individual RNA specimens at 450 nm with a microplate spectrophotometer, followed by colorimetric quantification to determine the m6A level (Shen et al. 2021; Wang et al. 2023a).
m6A dot plot experimentMix the cellular RNA and the organism RNA with an equal volume of 20 × SSC buffer (S6639, Sigma-Aldrich, USA). Incubate the mixture at 65 °C for 5 min to induce denaturation. Next, add 100 ng, 200 ng, or 400 ng of poly(A) + RNA onto the Hybond N + membrane (YA1760, Solarbio, Beijing, China). After exposing the membrane to UV crosslinking for 30 min, rinse it with PBST buffer and then block it using 5% non-fat milk. Next, the membrane went through incubation for the duration of the night at 4 °C with an anti-m6A antibody (mouse, 1:1000, 68,055–1-Ig, Proteintech, Wuhan, China). Next, incubate the sample with the secondary antibody at the ambient conditions for one hour and visualize the result using enhanced chemiluminescence (ECL). Apply an equal quantity of RNA onto the membrane and then stain it with a 0.02% methylene blue solution for 2 h (Shen et al. 2021; Song et al. 2019).
MeRIP-qPCRThe total RNA (100 µg) extracted from cells and tissues was then incubated with either anti-m6A antibody (mouse, 68055–1-Ig, 1:1000, Proteintech, Wuhan, China) or anti-IgG (Rabbit, 1:100, 30,=000–0-AP, Proteintech, Wuhan, China) coupled to protein A/G magnetic beads in IP buffer (140 mM NaCl, 1% NP-40, 2 mM EDTA, 20 mM Tris pH 7.5; enriched with protease inhibitors and RNase inhibitors) overnight at 4 °C. Incubate 300 μL of elution buffer containing 0.05% SDS, 1 mM EDTA, and 5 mM Tris–HCl with 8.4 μg of proteinase K (9034, Takara, Beijing, China) held at 50 °C for a time span of 1.5 h. Subsequently, remove RNA from the beads. Quantification of m6A modification levels in Lcn2 was achieved through RT-qPCR (Shen et al. 2021; Wang et al. 2023a).
RIP PCR experimentMutant plasmids for Lcn2 were constructed by introducing mutations at the m6A site using PCR-based methods. The coding sequence (CDS) for synthesizing Lcn2 mRNA should be cloned into the vector pCDNA3.1 (V79520, Invitrogen, ThermoFisher Scientific, USA). Furthermore, the adenine (A) at position 442 and position 507 were mutated to guanine (G) to construct the mutant plasmids Lcn2-MUT1 and Lcn2-MUT2 of Lcn2.
Based on the experimental protocol, RIP assays were conducted using the EZ-Magna RIP™ RNA-binding protein immunoprecipitation kit (17–701, Millipore, Sigma-Aldrich, Billerica, MA, USA). We used RIP lysis buffer containing RNase and protease inhibitors to lyse 90% of confluent cells from each group. The RNA extract (100 µl) was incubated with either an anti-Ythdf1 antibody (rabbit; 1:100, 17479–1-AP, Proteintech, Wuhan Sanying, China) or an anti-Wtap antibody (rabbit; 1:100, 10200–1-AP, Proteintech, Wuhan Sanying, China) conjugated magnetic beads in the RIP buffer. A negative control, Anti-IgG (Rabbit, 1:100, 30000–0-AP, Proteintech, Wuhan Sanying, China), was utilized (Wang et al. 2023a).
RNA stability experimentActinomycin D (Act-D; 5 µg/ml; A9415, Sigma-Aldrich, USA) could be employed to assess RNA stability in cells. Cells should be harvested, and RNA should be extracted at specific time points after incubation for RT-qPCR analysis (Wang et al. 2023a).
Isolation, cultivation and identification of primary cellsPrimary cortical neurons were isolated from wild-type C57BL6 mice on postnatal days 1–3. First, methodically disconnect the meninges and vascular structures to achieve a distinct separation of the cerebral cortex. Next, the tissue was finely diced and digested using 0.25% trypsin (25200–072, Thermo Fisher Scientific, Waltham, MA, USA) at 37℃ for 20 min, with subsequent gentle agitation. The dispersed cells were individually seeded onto 6-well plates, 96-well plates, and coverslips (24 mm × 24 mm) coated with poly-L-lysine (100 μg/ml). They were cultivated in Neurobasal Medium Plus (A3582901, Thermo Fisher Scientific, Waltham, MA, USA), supplemented with 2% B27 supplement (A3582801, Thermo Fisher Scientific, Waltham, MA, USA), 0.5 mM L-glutamine, and 50 U/ml penicillin/streptomycin. The cultures were maintained in a 5% CO2 atmosphere at 37 °C. Replace the culture medium every 8 h and then exchange half every other day. Experiments using neuronal cultures are conducted 8 to 10 days after they are seeded (Cai et al. 2022; Lai et al. 2020; Xing et al. 2014).
Primary microglia were isolated from wild-type C57BL6 mice on postnatal days 1–3 after birth. The meninges were removed, and the cortical tissue was digested at 37 °C for 30 min using 0.25% trypsin–EDTA. Subsequently, the tissue was mechanically triturated in DMEM/F12 medium (12400–024, Thermo Fisher Scientific, Waltham, MA, USA) supplemented with 10% fetal bovine serum (FBS) (26140079, Thermo Fisher Scientific, Waltham, MA, USA). Mixed dermal cells should be inoculated in DMEM/F12 culture medium supplemented with 10% FBS. The culture medium should be completely replaced every 3–4 days to ensure optimal growth. Confluence should be achieved after approximately 10–12 days in vitro. After 15–18 days of incubation, the mixed neuroglial cell cultures were treated with a trypsin solution (0.25% trypsin–EDTA diluted 1:4 in DMEM/F12) for 15–25 min. This treatment detached the intact cell layer, while the small glial cells stayed adhered to the flask's base, isolating the small glial cells.
Primary astrocytes were separated from wild-type C57BL6 mice between postnatal days 1 and 3. In brief, astrocytes were obtained from a mixed glial culture of cortical cells after 10–14 days of culture. This was achieved by shaking the culture overnight at 220 g to eliminate microglia and oligodendrocytes. The star-shaped glial cells underwent digestion and dissociation using trypsin before being re-seeded onto a cell culture plate coated with collagen proteins. Experiments were conducted using primary cultured astrocytes from the 2nd to the 4th generations.
Identification: Immunofluorescence staining was used to identify primary cortical neurons, small glial cells, and astrocytes. The cells were immobilized in a 4% paraformaldehyde solution at ambient temperature for 30 min. Following PBS washing, a blocking solution (consisting of 5% donkey serum and 0.1% Triton X-100 in PBS) was applied to the cells and left to incubate at room temperature for 2 h. 100 μL of rabbit anti-III class β-tubulin (1:100 dilution, ab18207, Abcam, UK), rabbit anti-Iba-1 (1:200 dilution, ab178846, Abcam, UK), and rabbit anti-GFAP (1:5000 dilution, ab7260, Abcam, UK) were then added to coverslips. Over a night-long period at 4 °C, cells were incubated with the coverslips. Then, depending on the primary antibody selected, incubate the samples with either Goat Anti-Rabbit Secondary Antibody (Cy3®; 1:1000, ab6939, Abcam, UK) or (Alexa Fluor® 488; 1:1000, ab150077, Abcam, UK) for 1 h at room temperature. Finally, cell nuclei were labeled with DAPI and then observed and imaged using confocal fluorescence microscopy (Rangaraju et al. 2018; Zhu et al. 2022; Zhong et al. 2021; Kang et al. 2018; Xing et al. 2014). The specificity and purity of the cultured microglial cells were assessed utilizing flow cytometry. The cells were labeled with anti-CD11b-FITC antibody (11–0112-82, Thermo Fisher Scientific, Waltham, MA, USA) for fluorescence detection, and over 95% of the cells were found to be CD11b positive, indicating a high level of purity in the cultured microglial cells (Xing et al. 2014).
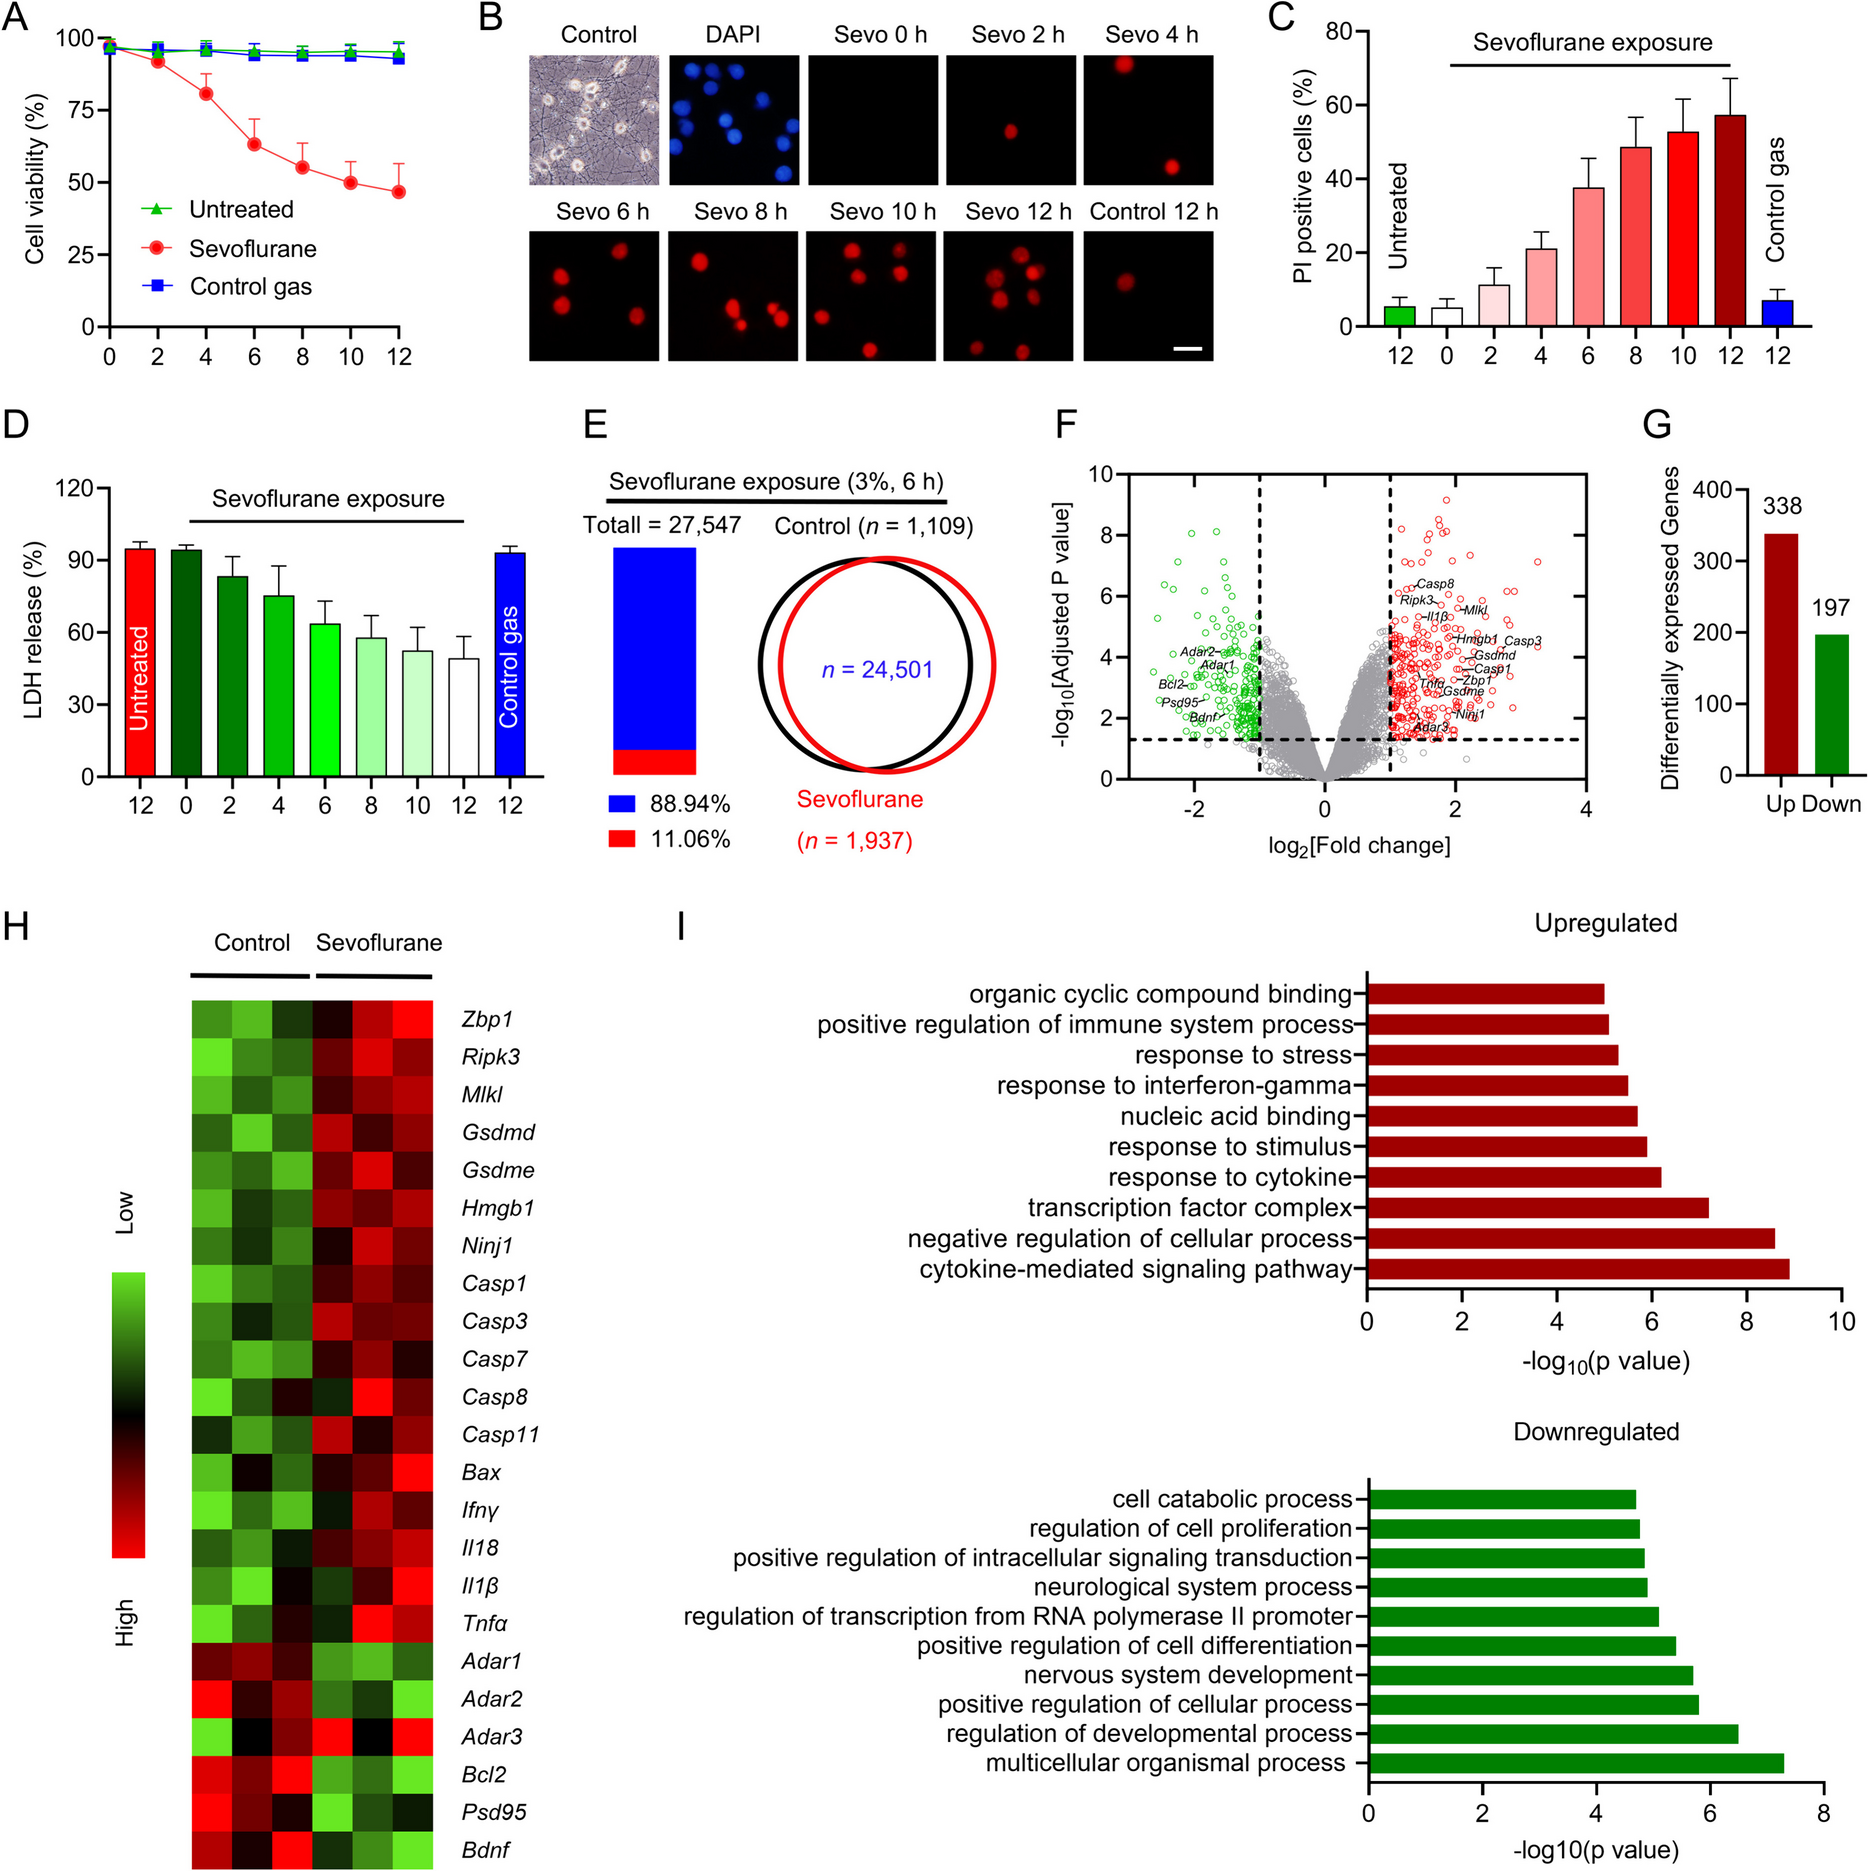
in vitro TBI modelDeveloping an in vitro TBI model through mechanical stretch-induced injury. Prior to a 5-day stretch exposure, primary cortical neurons (7 × 100,000 cells/well) were seeded onto a silicone membrane in custom stainless steel wells. The hole should be installed into the stretching device and subjected to severe stretching damage, simulating a strain field model similar to TBI in human bodies. The strain rate should be set at 10/s, the membrane deformation at 50%, and the peak pressure at 3–4 psi (Kenny et al. 2019; Bao et al. 2021; Ji et al. 2012).
Cell death assessmentThe assessment of cell cytotoxicity employed the lactate dehydrogenase (LDH) assay kit (MAK066-1, Sigma-Aldrich, USA). Cortical neurons were cultured in 6-well plates at 1 × 10⁶ cells per well for 7 days. After processing, collect 75 μl of supernatant from each sample. Then, react the collected supernatant with 150 μl of LDH reagent at room temperature for a period of 20 min. Utilizing a microplate reader, the sample's optical density (OD) was gauged at 490 nm. In the above statement, the term 'release of LDH' pertains to the percentage of LDH present in the supernatant relative to the total LDH (which includes intracellular and supernatant LDH) (Xu et al. 2021).
Neurotoxicity-induced oligodendrocytes and astrocytesNeurotoxicity in microglial cells was induced by lipopolysaccharide (LPS, 1 μg/ml; Sigma Aldrich, USA) and interferon-gamma (IFN-γ, 20 ng/ml; Sigma Aldrich, USA). Astrocytes exhibit neurotoxicity when induced by C1q (400 ng/ml; MCE, USA), TNF-α (30 ng/ml; Abcam, UK), and IL-1α (3 ng/ml; Abcam, UK) (Wang et al. 2021b). To assess the neurotoxicity of induced microglial cells and astrocytes, the cells were stimulated for 24 h. Subsequently, the supernatant from the culture medium was collected to obtain microglial cell-conditioned medium (MCM) and astrocyte-conditioned medium (ACM). Then, replace half of the original cortical neuron culture medium with either MCM or ACM. Incubate the cells for 24 h to measure the release of lactate dehydrogenase (LDH) and apoptosis rate. The experimental groups consisted of microglia treated with either PBS or LPS + IFN-γ, astrocytes treated with PBS or C1q + TNFα + IL-1α, and primary cortical neurons treated with untreat-M (uninduced microglial cell culture medium), MCM, untreat-A (uninduced astrocyte culture medium), and ACM.
Cell apoptosis detectionCell apoptosis was detected using the Flow Cel Assay Kit (APOAF, Sigma Aldrich, USA). Prepare a suspension of primary cortical neurons (1 × 10⁵/mL). Next, sequentially add 5 µL of FITC-Annexin V and PI. Next, incubate the sample in a dimly lit room at ambient temperature for a duration of 20 min. The Guava® easyCyte™ 6-2L Base System flow cytometer (0500–5007, Luminex) was used to detect cellular apoptosis. Perform data analysis using CellQuest Pro software. Apoptotic cells contribute to Quadrants 2 and 3 (Lu et al. 2020; Zhao et al. 2018).
CRISPR/Cas9We utilized a transposon plasmid to induce deletions in the Wtap and Ythdf1 genes using the CRISPR/Cas9 system. This transposon plasmid consists of an expression cassette for the spCas9 enzyme, a gene for purine resistance, and a chimeric guide RNA. Separately, the sgRNAs targeting the Wtap and Ythdf1 genes were designed using an online website and subsequently synthesized by Shanghai Biotech, a company based in China. Ythdf1-sgRNA1: 5'-CGTGACAGGCCCGGCCTCGTGGG-3'; Ythdf1-sgRNA2: 5'-TGGACTACGGCACCAGCGCTGGG-3'; Wtap-sgRNA1: 5'-GCTGCGAGACCCGCAAATAAAGG-3'; Wtap-sgRNA2: 5'-ATGGCAGCTCCTCCCGCCAGAGG-3'. Transfecting cells using Lipofectamine 3000 (Invitrogen, Thermo Fisher, USA). The transfected cells were selected 24 h after transfection using puromycin (2 µg/mL) from MCE, USA. After three days, transfer the individual bacterial colony into a 96-well plate. Genomic DNA extraction was conducted using the Quick-DNA Miniprep Kit (Zymo Research) for identification of deletions or insertions in the target colonies Wtap and Ythdf1. Sanger sequencing (GENEWIZ, China) was conducted on 5–10 bacterial colonies to acquire plasmids, followed by Chromas software sequence analysis. Select positive clones for downstream research. All clones are maintained in an identical environment to the parent cell (Lin et al. 2023).
Plasmid transfection and cell experiment groupingThe Lcn2 gene should be ligated with the eukaryotic expression vector pCDNA3.1 to generate the overexpression plasmid of Lcn2, called oe-Lcn2. Primary cortical neurons were plated with a density of 2 × 10⁵ cells per well in a 6-well plate and maintained in a CO2 incubator for 24 h. Following this, the target plasmid was transfected into the primary cortical neurons using Lipofectamine 3000. According to the instruction manual for the reference reagent, the recommended concentration for plasmid usage is 50 nM. However, adjustments should be made based on specific circumstances. The cells were cultured at 37℃ and 5% CO2 after transfection for 6 to 8 h. Subsequently, after complete medium replacement, a culture period of 48 h was allocated for the cells. RNA and protein extraction was conducted for further investigations (Sato et al. 2010).
The specific cell experiment groups consist of the following: primary cortical neurons, (1) control group, Model group (in vitro TBI model group); (2) TBI model primary cortical neurons: vector group (plasmid vector control), Wtap-KO group (Wtap gene knockout), Ythdf1-
留言 (0)