Experimental design and vaccine preparation
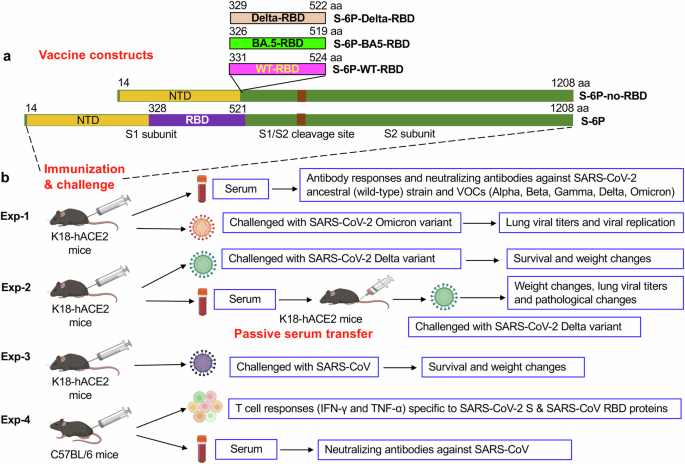
The subunit vaccines were prepared as described below18. Specifically, the DNA sequence of SARS-CoV-2 Omicron BA.1 variant containing a C-terminal Foldon trimerization domain and a His6 tag (S-6P) was amplified by PCR based on a codon-optimized plasmid expressing the S protein of Omicron BA.1 variant of SARS-CoV-2 (GISAID accession number EPI_ISL_6795835) with HexaPro sequences (a mutated furin cleavage site and 6 proline substitutions). The amplified PCR fragment was inserted into a pLenti mammalian cell expression vector. The S-6P-no-RBD was constructed by truncating the RBD fragment of the above S-6P sequence, and ligating using ClonExpress MultiS One Step Cloning kit (Cellagen Technology). The S-6P-Delta-RBD, S-6P-BA5-RBD, and S-6P-WT-RBD were constructed by inserting the respective RBD fragment of SARS-CoV-2 Delta variant (GISAID accession number EPI_ISL_7178410), Omicron BA.5 subvariant (GISAID accession number EPI_ISL_12043290), or the ancestral SARS-CoV-2 strain (GenBank accession number QHR63250.2) using the above Cloning kit. Each recombinant plasmid was confirmed for correct sequences by sequencing analysis, and transfected into HEK293F cells, followed by purification of the related proteins from the cell culture supernatants using Ni-NTA Superflow (Qiagen).
SDS-PAGE of the purified proteins
The purified proteins were analyzed by SDS-PAGE. Specifically, the proteins were mixed with Laemmli SDS-PAGE Sample buffer (Bio-Rad), and separated by 8% SDS-PAGE Gel in the presence of Tris-Glycine running buffer, followed by staining using SimplyBlue SafeStain buffer (Thermo Fisher Scientific).
Thermal shift assay of the purified proteins
The thermal stability of the expressed proteins at variable pH values was performed using the protein gel stain reagent and real-time PCR machine based on the manufacturer’s instruction. Specifically, 10 µl of each protein was added into a 96-well PCR plate, followed by addition of 2.5 µl of 50× SYPRO Ruby Protein Gel Stain (Sigma-Aldrich). In total, 12.5 µl of Tris buffers at specific pH values was then added to each well. The melt temperature of the proteins in each well was measured by CFX Opus 96 Real-Time PCR System instrument (Bio-Rad).
Cryo-EM grid preparation and data acquisition
The isolated S-6P-no-RBD protein (4 µl at 3.78 μM) was applied to freshly glow-discharged Quantifoil R1.2/1.3 300-mesh copper grids (EM Sciences), and then blotted for 4 s at 4 °C under 100% chamber humidity and plunge-frozen in liquid ethane using a Vitrobot Mark IV (FEI). Cryo-EM data were collected using Latitude-S (Gatan) on a Titan Krios electron microscope (Thermo Fisher Scientific) equipped with a K3 direct electron detector with a Biocontinuum energy filter (Gatan) in CDS mode at the Hormel Institute, University of Minnesota. The movies were collected at a nominal magnification of ×130,000 (corresponding to 0.664 Å per pixel), a 20 eV slit width, a dose rate of 21 e– per Å2 per second, and a total dose of 42 e − /Å2. The statistics of cryo-EM data collection are summarized in Supplementary Table 1.
Image processing
Cryo-EM data were processed using cryoSPARC v4.0.341, and the data processing procedures are outlined in Supplementary Fig. 3. Dose-fractionated movies were first subjected to Patch motion correction and Patch CTF estimation with MotionCor242 and CTFFIND-4.1.1343, respectively. Images with the defocus values outside of −0.6 to −2.8 μm or the CTF fit resolutions worse than 5 Å were excluded from the further steps. Particles were picked using both Blob picker and Template picker accompanied with removing duplicate particles. Three rounds of 2D classifications were applied to remove junk particles and particles (319, 289) extracted from the good 2D classes were used for Ab-initio Reconstruction of four maps and then for the heterogeneous refinements. The good 3D class (171, 788 particles) was finally subjected to further homogeneous, non-uniform and CTF refinements to generate a 2.8 Å resolution final map with applying C3 symmetry. Map resolution was determined by gold-standard Fourier shell correlation (FSC) at 0.143 between the two half-maps. Local resolution variation was estimated from the two half-maps in cryoSPARC v4.0.3.
Model building and refinement
Initial model building of the S-6P-no-RBD was performed in Coot-0.8.944 using PDB 7TGW without RBD domains as the starting model. Several rounds of refinement in Phenix-1.1645 and manually building in Coot-0.8.9 were performed until the final reliable models were obtained. The final model has good stereochemistry by evaluation in MolProbity46. The statistics of 3D reconstruction and model refinement are shown in Supplementary Table 1. Figures were generated using UCSF Chimera X v0.9347.
Construction of recombinant plasmids
The recombinant plasmids were constructed as described below18. Specifically, the recombinant plasmids encoding the S protein of SARS-CoV-2 ancestral wild-type (WT) strain (GenBank accession number QHR63250.2), SARS-CoV original strain (GenBank accession number AY274119), and SARS-CoV-2 Alpha variant (GISAID accession number EPI_ISL_718813) were constructed by inserting each DNA sequence into a pcDNA3.1/V5-His-TOPO vector. SARS-CoV-2 Omicron BA.1 (GISAID accession number EPI_ISL_6795835), BA.2 (GISAID accession number EPI_ISL_12030355), BA.2.75 (GISAID accession number EPI_ISL_14384334), BA.4.6 (GISAID accession number EPI_ISL_14288784), and BA.5 (GISAID accession number EPI_ISL_12043290), as well as recombinant plasmids expressing each S protein of Beta, Gamma, and Delta variants, were constructed using a multi-site-directed mutagenesis kit, and the mutations in the RBD region were included in each construct. The sequence-confirmed plasmids were used for generation of pseudoviruses as described below.
Pseudovirus generation and neutralization assay
The pseudoviruses were generated as described below48,49,50. Specifically, each of the above recombinant plasmid was co-transfected with the pLenti-CMV-luciferase and PS-PAX2 plasmids into 293T cells using a PEI transfection method. Pseudovirus-containing culture supernatants were collected 72 h after transfection, and incubated with serially diluted mouse sera (2–4-fold serial dilutions for serum neutralizing antibodies against different strains of SARS-CoV-2 pseudovirus, and two-fold serial dilutions for serum neutralizing antibodies against SARS-CoV pseudovirus) at 37 °C for 1 h. The virus-serum mixture was then added to 293T cells expressing human ACE2 receptor (hACE2/293 T). 24 h later, fresh medium was added to the cells, which were further cultured for 48 h. The cells were then sequentially incubated with cell lysis buffer and luciferase substrate (Promega), and measured for relative luciferase activity using Cytation 7 Microplate Multi-Mode Reader and Gen5 software. 50% pseudovirus neutralization was calculated as NT50.
Ethics statement
Male and female K18-hACE2 transgenic mice (6–8-week-old) and C57BL/6 mice (8–10-week-old) were used in this study, and they were randomly assigned to each group. The animal protocols were approved by the Institutional Animal Care and Use Committees (IACUC) of Georgia State University and University of Iowa. All mouse-related experiments were conducted by strictly following our approved protocols and the Guidelines for the Care and Use of Laboratory Animals of National Institutes of Health. Mice reaching 25% weight loss with significant clinical symptoms, or 30% weight loss, were humanely euthanized by cervical dislocation under anesthesia.
Animal immunization and serum collection
The K18-hACE2 mice were i.m. immunized with each protein (10 μg/mouse) or PBS control plus Alum (500 μg/mouse) and MPL (10 μg/mouse) adjuvants (InvivoGen). The selection of the above adjuvants and the doses of the proteins was based on our previously optimized schedules18,37,38. The cocktail is the combination of S-6P-Delta-RBD and S-6P-BA5-RBD proteins (5 μg for each protein, 10 μg/mouse). These mice were further boosted twice with the same immunogen and adjuvants every 3 weeks. The sera were collected from each mouse 10 days after the 3rd immunization and measured for neutralizing antibodies against SARS-CoV-2 and SARS-CoV (as described above), and IgG antibody responses (as described below), or pooled for passive transfer to naive mice for subsequent challenge studies (as described below). In a separate experiment, C57BL/6 mice were immunized as described above, and sera and splenocytes were collected 4 months after the 3rd immunization for detection of neutralizing antibodies (as described above) and T cell responses (as described below).
ELISA
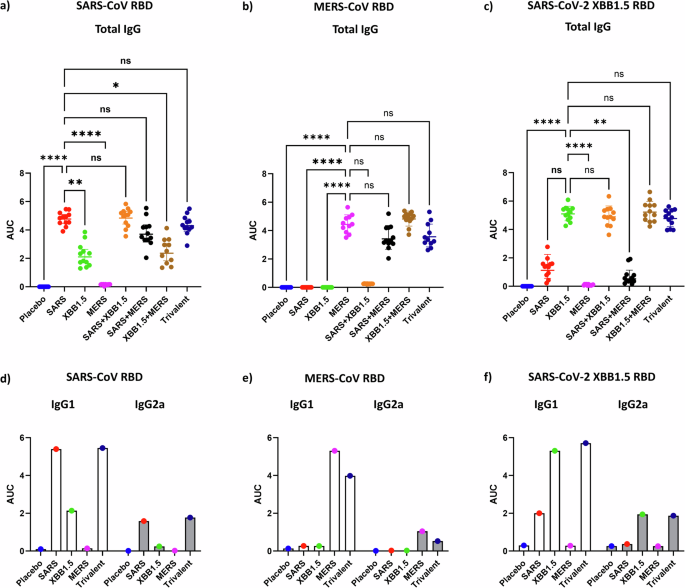
ELISA was carried out to test S/RBD-specific IgG antibodies in immunized mouse sera38,48. Specifically, ELISA plates were coated with the respective SARS-CoV-2 S or RBD protein (1 μg/ml) at 4 °C overnight, and blocked at 37 °C for 2 h, with 2% fat-free milk in PBS containing 0.05% Tween-20 (PBST). After washing with PBST for five times, the plates were sequentially incubated with 3-fold serially diluted sera, and horseradish peroxidase (HRP)-conjugated anti-mouse IgG (Fab specific) antibody (1:60,000 dilution; Sigma, #A9917) at 37 °C for 1 h. The plates were washed again as described above, incubated with TMB (3,3’,5,5’-Tetramethylbenzidine) substrate (Sigma, #T4319), and stopped for reaction by H2SO4 (1 N). The absorbance at 450 nm (A450) was measured using Cytation 7 Microplate Multi-Mode Reader.
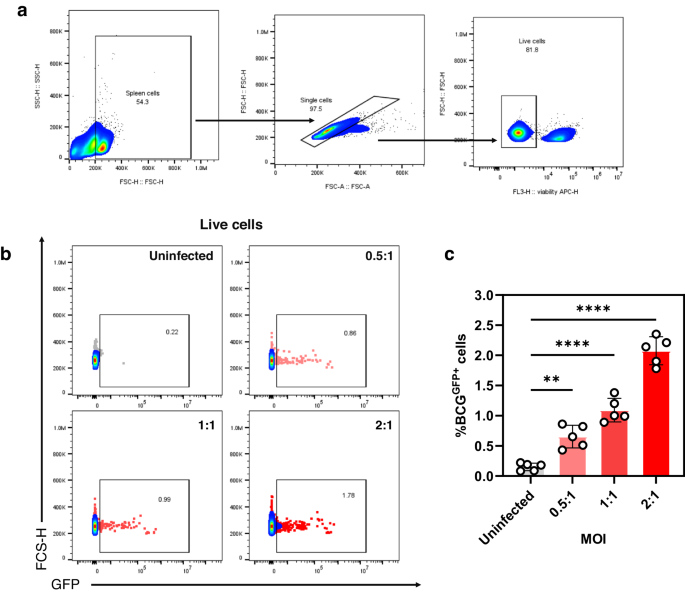
Flow cytometry analysis
Flow cytometry was carried out to analyze SARS-CoV-2 or SARS-CoV-specific CD4+ and CD8+ T cell responses in the mouse splenocytes51,52. Briefly, splenocytes (1 × 10⁶ cells/ml, 200 µl/well) were incubated with 5 μg/ml of S-6P-no-RBD (for SARS-CoV-2) or a Fc-fused SARS-CoV RBD (for SARS-CoV)50 protein diluted in RPMI 1640 medium containing 10% FBS and mouse IL-2 (R&D Systems, 1 ng/ml) at 37 °C. After 41 h, the cells were restimulated as above for 1 h, followed by incubation with Brefeldin A (5 μg/ml; Biolegend, #420601) and BD GolgiStop™ Protein Transport Inhibitor (containing Monensin) (1:1500 dilution; BD Biosciences, #554724) for another 6 h. After washing with PBS, the cells were stained with Fixable Viability Dye eFluor™ 660 (1:1000 dilution; eBioscience, #65-0864-14) to exclude dead cells. After incubation with TruStain FcX plus (1:200 dilution; Bioligand, #156604) to block Fc receptors, the cells were then stained with anti-mouse CD45-PE-Cy7 (1:333 dilution; BD Biosciences, #552848) and anti-mouse-CD8-FITC (1:200 dilution; BD Biosciences, #553031) or anti-mouse-CD4-FITC (1:200 dilution; Biolegend, #100406) antibodies. After fixation and permeabilization (Fixation/Permeabilization Kit, BD Biosciences, #554714), the cells were stained with anti-mouse-IFN-γ-PE (1:100 dilution; Biolegend, #505808) or anti-mouse-TNF-α-BV421 (1:100 dilution; Biolegend, #506328) antibody, and analyzed by CytoFLEX flow cytometer (Beckman Coulter Life Sciences). The gating strategy and representative plot of flow cytometry are shown in Supplementary Figs. 6 and 7.
Challenge of immunized mice with SARS-CoV-2 or SARS-CoV
Three separate challenge experiments were performed 2 weeks after the 3rd immunization as described below18,38,53. (1) The immunized mice were intranasally (i.n.) infected with SARS-CoV-2 Delta variant (a high lethal dose of 104 plaque forming units (PFU)/mouse, 50 μl/mouse), and observed for body weight changes and survival for 14 days after challenge. (2) The immunized mice were i.n. infected with SARS-CoV-2 Omicron variant (BA.1 subvariant, an optimal infectious dose of 105 PFU/mouse, 50 μl/mouse). The mice were then sacrificed two days after infection, and the lungs were collected for measurement of viral titers and replication. (3) The immunized mice were i.n. infected with SARS-CoV MA15 strain (a lethal dose of 200 PFU/mouse, 50 μl/mouse), and observed for body weight changes and survival for 13 days after infection (note: the reason that these mice were not observed for 14 days post-SARS-CoV challenge, as for post-SARS-CoV-2 Delta variant challenge, was due to closure of the BSL-3 laboratory for yearly maintenance).
Challenge of naive mice receiving immune sera with SARS-CoV-2 Delta variant
Pooled mouse sera (200 μl/mouse) from the respective immunization groups were intraperitoneally (i.p.) administered to naive mice54. Six hours after serum administration, the mice were i.n. infected with SARS-CoV-2 Delta variant (5 × 10³ PFU/mouse: a dose optimized for evaluating viral titers and pathological changes in the lungs; 50 μl/mouse). Four days after the viral infection, the mice were euthanized for lung collection. Half lungs were collected in PBS for measurement of viral titers by plaque assay, and the other half were collected in Zinc formalin for pathological analysis, as described below.
Viral titer detection
Lungs collected from SARS-CoV-2 Omicron or Delta variant-challenged mice were measured for viral titers by a standard plaque assay as described below53. Specifically, lung tissues were homogenized and centrifuged, and the supernatants were diluted in DMEM cell culture medium, followed by incubation with Vero E6 cells at 37 °C for 1 h. The inoculation was removed, and the cells were then overlaid with 0.6% agarose and cultured for three days. After removing the overlays, the cells were stained with 0.1% crystal violet to show plaques. Viral titers were calculated as PFU/ml of mouse lung tissues.
RNA isolation and qRT-PCR
Lungs collected from SARS-CoV-2 Omicron variant-challenged mice were also measured for viral replication as described below53. Specifically, RNA was extracted from virus-infected mouse lungs using Invitrogen TRIzol reagent (Thermo Fisher Scientific) according to the manufacturer’s instructions. In all, 1 μg of total RNA was used as template for the first strand of cDNA. The resulting cDNA was subjected to amplification of selected genes by real-time quantitative PCR (qRT-PCR) using Power SYBR Green PCR Master Mix (Applied Biosystems). Viral nucleocapsid (N) gene was detected using nCOV_N1 primer (Integrated DNA Technologies, 10007031). The expression levels were normalized to glyceraldehyde-3-phosphate dehydrogenase (GAPDH) using the following threshold cycle (CT) equation: ΔCT = CT of the gene of interest − CT of GAPDH. The results are expressed as a ratio to GAPDH calculated as 2−ΔCT.
Pathological analysis of lung tissues
Lungs collected from SARS-CoV-2 Delta variant-challenged mice were analyzed for pathological effects. Specifically, paraffin-embedded lung tissue sections were stained using the hematoxylin and eosin (H&E) method, and the relevant slides were examined for pathological effects using a grouped masking approach55. Edema distribution in the lungs were ordinally numbered56, with the scores being reported as 0 (none), 1 (< 25%), 2 (26–50%), 3 (51–75%), and 4 (> 75%) of tissue fields. High resolution images were taken using a BX53 Microscope (DP73 digital camera) and CellSens Dimension software (Olympus).
Statistical analysis
GraphPad Prism 9.0.2 statistical software was used to calculate statistical significances among various vaccination groups. Ordinary one-way ANOVA (Dunnett’s multiple comparison test) was performed to assess statistical significances between S-6P-Delta-RBD and other groups, and Ordinary one-way ANOVA (Tukey’s multiple comparison test) was performed to assess statistical significances among different groups. The respective statistical tests are shown in the related figure legends. *, **, and *** designate P < 0.05, P < 0.01, and P < 0.001, respectively.


留言 (0)