This was a phase 2, open-label, computer-randomised, controlled safety, and immunogenicity trial of R21/Matrix-M™ in healthy, adult Thai participants conducted in the Clinical Therapeutics Unit, Faculty of Tropical Medicine, Mahidol University in Bangkok, Thailand between January and September 2023. The study protocol is included as a supplementary file (Supplementary Protocol).
Study participants
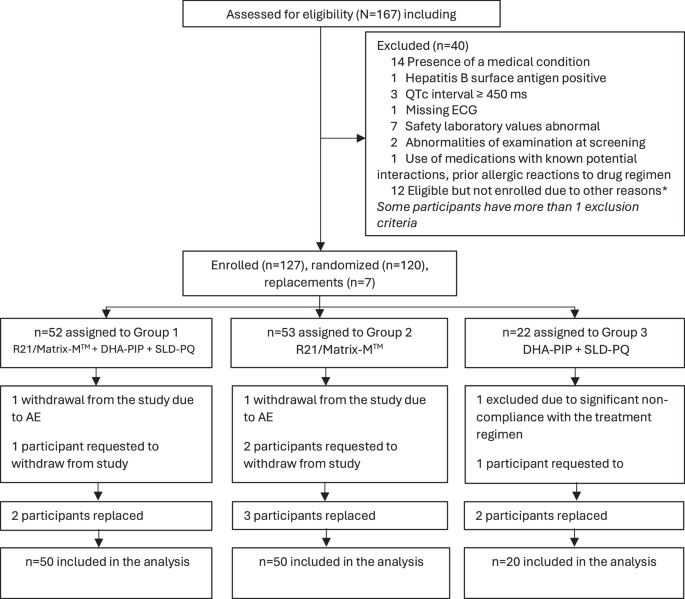
After a full explanation of study procedures healthy Thai male or non-pregnant female participants, aged 18 to 55 years (inclusive), without a history of malaria, who provided informed consent and were willing to adhere to the study requirements were recruited. Participants were screened before enrolment for haematological or biochemical abnormalities, and for malaria and viral infections (HBsAg, HCV, HIV). A total of 120 participants who passed screening were randomised to one of three study groups and received three rounds of study drugs or vaccines one month apart:
Group 1 (n = 50): 3 doses of R21/Matrix-M™ for three consecutive months concurrently with 3-days of daily dihydroartemisinin-piperaquine and a single low dose of primaquine (SLDPQ).
Group 2 (n = 50): 3-daily doses of R21/Matrix-M™ alone for three consecutive months.
Group 3 (n = 20): 3-days of dihydroartemisinin-piperaquine and SLDPQ for three consecutive months.
Study vaccine/R21/Matrix-M™
R21 was manufactured by the SIIPL. Participants received a two-vial formulation: R21 was mixed immediately prior to administration with Matrix-M™, a saponin-based vaccine adjuvant (Novavax AB, Uppsala, Sweden). A dose of 10 μg R21 with 50 μg Matrix-M™ was used in the trial. All vaccines received three doses R21/Matrix-M™ one month apart, administered as a 0.75 ml dose intramuscularly into the deltoid muscle of the participant (Table 1). The amino acid residues incorporated in the R21 full and C-term constructs used in the ELISA are shown in Supplementary Methods.
Antimalarial drugs
Dihydroartemisinin/piperaquine (DP) tablets (Shanghai Fosun Pharmaceutical Co., Ltd., China) for adult patients containing 40 mg dihydroartemisinin and 320 mg piperaquine were prescribed according to the participant’s bodyweight with a therapeutic dose range between 2 and 10 mg/kg/day dihydroartemisinin and 16–26 mg/kg/dose piperaquine. A single low dose of primaquine (0.25 mg base/kg; Government Pharmaceutical Organization GPO, Thailand) was co-administered on the first day of each round of antimalarials.
Study procedures
Participants in treatment groups 1 and 2 received R21/Matrix-M™ on Day 0 of Month 0, 1, 2. Participants in treatment groups 1 and 3 received the standard DP treatment on Days 0, 1, 2, of Month 0, 1, 2. In addition, each participant in groups 1 and 3 received a single low dose of primaquine (0.25 mg base/ kg; Thai Government Pharmaceutical Organisation, Bangkok, Thailand) on the first day of each vaccination (Day 0). Local injection site and general solicited adverse events (AEs) were monitored on days 2, 3, and 7 post-vaccination. All other AEs (unsolicited) were recorded over a 28-day period after each vaccination. Serious AEs (SAEs) were captured throughout the study period. All injection site AEs were considered causally related to vaccination; the causality of all other AEs was assessed by the investigator. Haematological and biochemical tests for safety assessment were conducted at screening, on Day 0 and 7 of the first vaccination (M0) and Month 3. Abnormal test results were followed until they resolved.
Pharmacokinetics
Plasma samples for quantification of piperaquine were collected during each vaccination round (Month 0, 1, and 2) on Day 0 (pre-1st dose), Day 1 (pre-2nd dose), Day 2 (pre-3rd dose), and Day 7 for group 1 and 3. Collected samples were stored at −80 °C and transferred to the Department of Clinical Pharmacology, Mahidol Oxford Research Unit, Bangkok, Thailand, for drug quantification. Piperaquine was quantified using liquid chromatography (LC) coupled with tandem mass spectrometry (MS/MS) detection according to a previously published and validated method10. The coefficient of variation for the quality control samples was <5% and the lower limit of quantification of piperaquine was set to 1.50 ng/mL. The impact of the vaccine dose on the observed drug concentrations of piperaquine were investigated by comparing drug concentrations in group 3 (standard vaccine dose) and group 1 using the Wilcoxon rank sum test. The pharmacokinetic comparison was made at each time point.
Immunogenicity assessments
A validated four-plex enzyme-linked immunosorbent assay (ELISA) was used to measure IgG antibodies specific to four antigens. These comprised the full length R21 vaccine construct, six repeats of the central NANP6 amino acid repeat region of CS protein (NANP6), the C-terminus of CS protein (C-term), and Hepatitis B surface antigen (HBs). The amino acid residues incorporated in the R21 full and C-term constructs used in the ELISA are shown in the Supplementary Methods. This assay uses electrochemiluminescence (ECL) as a detection technique (Meso Scale Discovery (MSD, Rockville, Maryland, USA)). Samples were collected prior to first vaccination (M0), prior to second vaccination (M1D0), prior to third vaccination (M2D0), month 3 and month 6. The samples were processed at Jenner Institute, Oxford. Briefly, pre-coated malaria 4-plex plates (MSD, USA) are blocked for 30 min with casein (Thermo Fisher Scientific) at room temperature (RT) with shaking. After washing with PBS-Tween, plasma samples (diluted to between 1000 and 300,000 fold in casein (Thermo Fisher Scientific)) were plated in triplicate alongside pooled serum standards and QC samples. After incubation at RT with shaking for 2 h, plates were washed, and detection antibody SULFO-TAG Anti-human IgG (3D3cc; MSD, USA) was added for a further 1 h at RT with shaking. After washing, MSD GOLD read buffer B (MSD, USA) was added before the plate was read immediately using a MESO QuickPlex SQ 120 plate reader.
Statistical consideration
Using the Blackwelder method for precision-based sample size calculations, a total of 20 participants per group was needed for group 3 to test against each of Groups 1 and 2 separately11. Using the Fisher’s exact test power simulations, a difference in serologic response of 30% (e.g., 50% vs 80%) resulted in 85% power with a sample size of 50 participants in each of Groups 1 and 2 testing at 5% significance level. Randomisation numbers were generated in blocks size 12, for the 3 study arms in a ratio of 5:5:2, for Group 1, Group 2, and Group 3 respectively.
All analyses were conducted according to a predefined Statistical Analysis Plan. Primary outcome analyses were carried out on both the according to per-protocol (PP) and the intention to treat (ITT) population. The PP analyses was the main strategy for the immunogenicity analyses. The safety outcomes were analyzed using the ITT approach. Participant demographic characteristics (age, gender, weight), and all other baseline information were summarised for each treatment group. The mean (SD) was used for continuous normally distributed data. The median (IQR) for continuous variables were used for skewed distribution variables. We approximated the total exposure to piperaquine in each treatment group by deriving the area under the plasma concentration time profile (AUC) for each individual up to the last measured drug concentration (AUC0-d7), using the cubic spline method for ascending concentrations and the logarithmic cubic spline method for descending concentrations. Observed drug concentrations at each time point was also compared between groups. Concentrations that were below the lower limit of quantification (LLOQ) were excluded from analysis only at the point when such values occurred. The raw immunology data were log-transformed using the natural log. The differences in the means between groups on log scale were calculated with the 95% confidence intervals for the differences in means. The differences in means on a log-scale and the corresponding 95% confidence intervals were back transformed by taking an exponential function. The resulting geometric mean ratios (GMR) and their 95% confidence intervals are reported. Statistical significance was declared as 5% level. Statistical analyses have been performed in Stata 18.0.


留言 (0)